


1. Introduction
As the global obesity epidemic exacerbates health disparities, understanding socioeconomic (SES)-obesity interactions across racial groups is critical for designing equitable interventions. Socioeconomic status robustly predicts obesity, yet its multidimensional racial dynamics remain unquantified. While McLaren identified inverse income-obesity gradients [1], contemporary data show diverging trajectories by SES: obesity declined in high-SES adolescents but rose in low-SES groups [2]. These gradients exhibit racial stratification, wherein educational attainment reduces obesity risk more substantially for White individuals than for minorities, reflecting diminished returns in marginalized populations. Adulthood disparities persist: low-income Californians had 35% higher obesity odds (OR=1.35), with Hispanics experiencing 1.8-fold stronger income effects than Whites [3].
The mediating role of obesity in this context is unequivocal: Body Mass Index (BMI) explains 15-22% of SES-driven disparities in metabolic syndrome [4]. However, most studies conceptualize SES unidimensionally, ignoring how distinct dimensions-income (economic capital), education (cultural capital), and occupation (social capital)-interact differentially across races. Critically, employment quality, a core occupational dimension, exemplifies this complexity: Oddo et al. found that precarious employment disproportionately burdens minorities (especially low-education Hispanic and Black women) and elevates BMI by 2.18 units per one-point increase in precarity—yet no study has integrated this evidence into a multidimensional SES-race framework to quantify its compensatory potential [5] This analytical gap impedes targeted policy design.
This study bridges this gap through a race-stratified tripartite SES model. Using 2021-2023 NHANES data, we employ logistic regression with race-SES interactions to:Quantify race-specific obesity gradients across income, education, and occupation;Test occupation's compensatory potential in low-income minorities.By challenging universal SES assumptions, this research aims to advance precision public health for targeted equity.
2. Data collection
2.1. Data source and processing
We utilized data from the National Health and Nutrition Examination Survey (NHANES)2021-2023 cycle, the most recent publicly available data representing the non-institutionalized civilian population of the U.S. After merging demographic, examination, and questionnaire modules, we applied mobile examination center weights (WTMEC2YR) to account for complex survey design. The analytic sample included 62350 adults (≥18 years) with complete data on obesity status and socioeconomic variables, following the exclusion of pregnant women and individuals with missing key covariates.
2.2. Variable definitions
To ensure accurate interpretation and analysis, the definitions of all variables are specified in Table 1 below, which is essential for maintaining the rigor of this study.
|
Variable Type |
Variable |
Definitions |
|
Outcome variable |
Obesity |
Defined as body mass index ≥30 kg/m² based on measured height and weight |
|
Core predictor variable |
Income |
Family income-to-poverty ratio (continuous, range: 0-5) |
|
Education |
Highest education level (ordinal: <high school, high school, college, graduate) |
|
|
Occupation |
Currently working,Employed but absent,Employment Status Unkown,Not in Labor Force,Unemployed(Looking) |
|
|
Stratifying variable |
Race/ethnicity |
Mexican American,NH-White,NH-Black,Hispanics,NH-Asian |
2.3. Statistical methods and rationale
We employed complex survey-weighted logistic regression to quantify race-specific socioeconomic gradients in obesity risk, incorporating multiplicative interaction terms between race/ethnicity and each SES dimension. This approach directly tests for effect modification while maintaining full sample efficiency-superior to stratified models for detecting cross-race differentials. To evaluate the compensatory potential of occupation, we conducted subgroup analyses among low-income individuals (income-to-poverty ratio <1.3) using the same interaction framework. All analyses were implemented in R's survey package, with Taylor series linearization used to appropriately weight estimates and account for the complex sampling design.
3. Data analysis
3.1. Descriptive statistical analysis
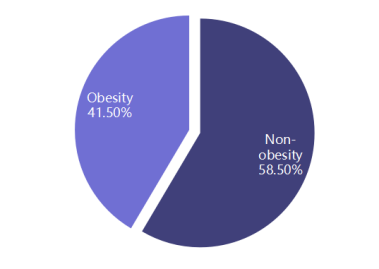
In the analyzed NHANES sample, 41.5% of adults were classified as obese according to Figure 1.
Obesity prevalence varied significantly across racial and gender groups. As is shown in Table 2 that the obesity prevalence was highest among Non-Hispanic Black women (54.2%), followed by Mexican American women (50.0%), and lowest among Other Hispanic women (39.7%). Among men, Non-Hispanic Black men had the highest rate (46.5%), while Non-Hispanic White men had the lowest (38.2%). Rates for Mexican American and Non-Hispanic Asian groups fell in between, with prevalence for women ranging from 46.8% to 50.0% and for men from 40.4% to 43.3%.
|
Race / Ethnicity |
Gender |
Obesity Rate (SE) |
|
Non-Hispanic White |
Male |
38.2% (0.020) |
|
Non-Hispanic Black |
Male |
46.5% (0.039) |
|
Mexican American |
Male |
43.3% (0.037) |
|
Other Hispanic |
Male |
42.1% (0.040) |
|
Non-Hispanic Asian |
Male |
40.4% (0.059) |
|
Non-Hispanic White |
Female |
40.0% (0.017) |
|
Non-Hispanic Black |
Female |
54.2%(0.031) |
|
Mexican American |
Female |
50.0%(0.070) |
|
Other Hispanic |
Female |
39.7% (0.039) |
|
Non-Hispanic Asian |
Female |
46.8% (0.049) |
3.2. Modelling
3.2.1. Methods
Analyses were stratified by race/ethnicity. We employed survey-weighted logistic regression (svyglm) that incorporated a linear income-to-poverty ratio, orthogonal polynomials for education, and categorical occupation and gender. Race/ethnicity was entered as a priori confounder.:
where denotes a 4-d.f. cubic spline for income-to-poverty ratio,
 are orthogonal polynomials for education level, and reference categories are “currently working”(occupation) and male (gender).
3.2.2. Results
The model was estimated using survey-weighted generalized linear regression using the svyglm function in R (survey package) to account for the stratified, clustered NHANES design and unequal probability of selection. A quasi-binomial family was specified to allow for possible over-dispersion.The results of the regression analysis are presented in Table 3.
|
Coef |
SE |
z |
p |
|
|
(Intercept) |
-0.3283302 |
0.12347 |
-3.606 |
0.0366 |
|
s(income_poverty, k = 4) |
0.01529 |
0.02639 |
0.0.579 |
0.6030 |
|
education.L |
-0.37735 |
0.10960 |
-3.443 |
0.0411 |
|
education.Q |
-0.27001 |
0.09071 |
-2.976 |
0.0588 |
|
education.C |
-0.13885 |
0.08153 |
-1.703 |
0.1871 |
|
Occupation Employed but Absent |
-0.26308 |
0.17446 |
-1.508 |
0.2287 |
|
Occupation Not in Labor Force |
-0.07031 |
0.06644 |
-0.158 |
0.3676 |
|
Occupation Unemployed |
-0.15956 |
0.21425 |
-0.745 |
0.5105 |
|
Gender Female |
0.19545 |
0.06932 |
2.819 |
0.0668 |
|
race_ethnicity Non-Hispanic Black |
0.37648 |
0.12420 |
3.031 |
0.0563 |
|
race_ethnicity Mexican American |
0.16162 |
0.24447 |
0.661 |
0.5558 |
|
race_ethnicity Other Hispanic |
0.02849 |
0.13159 |
0.216 |
0.8425 |
|
race_ethnicity Non-Hispanic Asian |
0.12670 |
0.18310 |
0.692 |
0.5387 |
In the base logistic regression model without interactions, a one-unit increase in the income-to-poverty ratio was not significantly associated with obesity risk (β= 0.015, p = 0.60).
Education exhibited a strong and statistically significant gradient: the linear term (β_L=−0.38, p=0.041) and the quadratic term (β_Q=−0.27, p=0.059) both made substantial contributions, while the cubic term (β_C=−0.14, p=0.19) did not achieve statistical significance.
Among occupational categories, individuals “employed but absent” demonstrated a non-significant trend toward lower obesity odds (β=−0.26, p = 0.23); similarly, those “not in the labor force” displayed a modest, marginally non-significant reduction (β=−0.07, p = 0.37), and the unemployed group evidenced no difference (β=−0.16, p = 0.51).
Female sex was associated with higher obesity odds (β=0.20, p=0.067), corresponding to a 22 % increase (OR = 1.22, 95 % CI 1.06–1.39).
Across race/ethnicity strata, only non-Hispanic Black participants showed a marginally significant elevation in obesity likelihood (β= 0.38, p = 0.056); all remaining groups did not significantly differ from non-Hispanic White adults (all p > 0.5).
3.3. Cross-effect analysis
Since the gender×income_poverty interaction was not statistically significant (p = 0.13), we retained the main-effects specification and depict the survey-weighted associations between each SES dimension and obesity prevalence stratified by race/ethnicity.
3.3.1. Income-to-poverty ratio
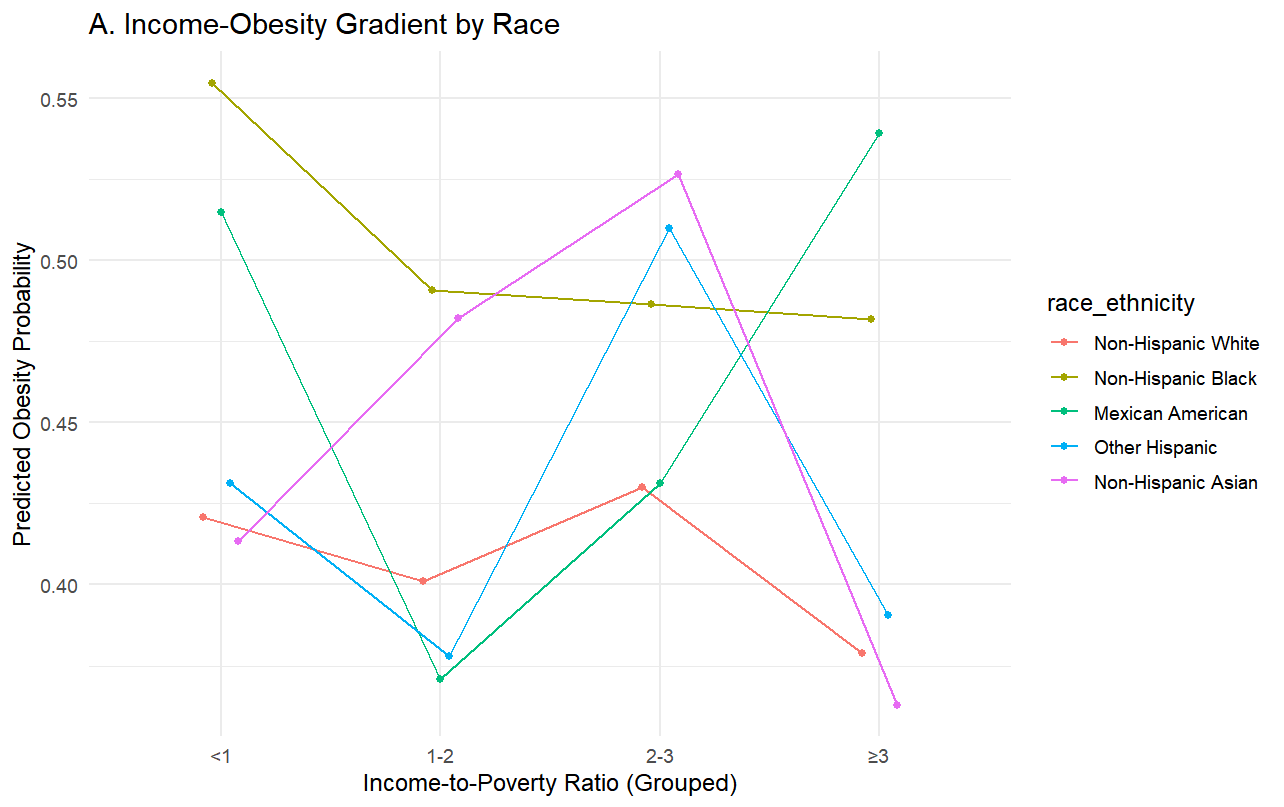
As is shown in Figure 2,at the lowest income band (<1), Non-Hispanic Black adults exhibited the highest obesity prevalence (>0.55), followed by Mexican American group (≈0.51), while Other Hispanic,Non-Hispanic Whites and Non-Hispanic Asian strata exhibited similar prevalence rates around 0.42.
At the highest income band (≥3), probabilities converge but with clear racial layering: Non-Hispanic Black remains relatively stable at≈0.48 after income >1, Mexican American peaks at ≥3 (≈0.46) following a U-shape dip at 1-2, while Non-Hispanic Asian and Other Hispanic show the steepest swings, both reaching their highest values at 2-3 (≈0.52) before dropping below 0.40 at ≥3.
Non-Hispanic White adults displayed a shallow, non-significant gradient (≈0.05 percentage-point drop), suggesting that income alone is less predictive once occupation and education are held constant.
Overall, a rising income-to-poverty ratio is associated with a systematic downward compression of obesity probability across all racial groups. From the lowest band (<1) to the highest (≥3), most strata exhibit step-wise declines, with the steepest drops typically occurring between <1 and 1-2.
The peak obesity probability (>0.55) occurred among low-income Non-Hispanic Black adults, coinciding with the highest residual SES disadvantage and neighborhood-level obesogenic exposures.
Convergence at high income suggests that economic resources attenuate—but do not eliminate—racial disparities, supporting a “diminishing returns” interpretation rather than a complete SES crossover.
3.3.2. Education level
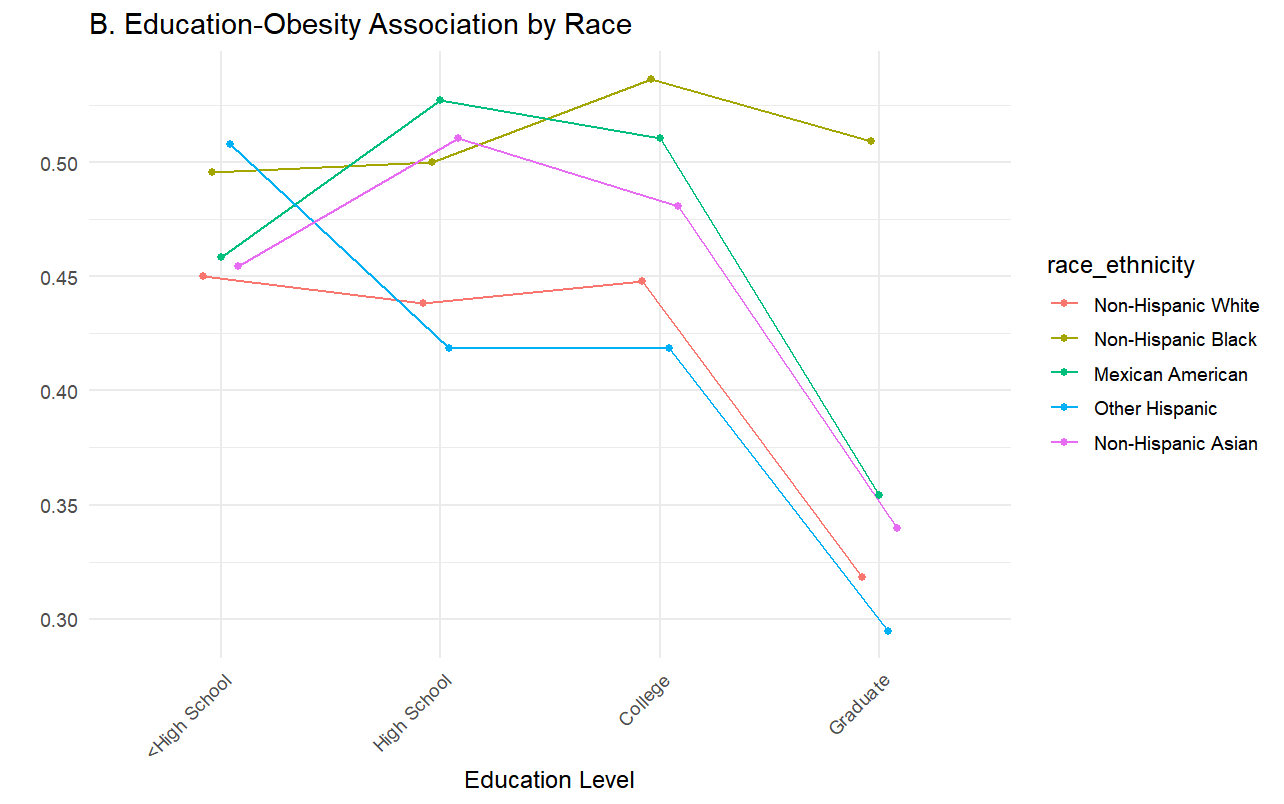
As is shown in Figure 3,at the lowest education band (<high school), other Hispanic adults exhibited the highest obesity prevalence (>0.50), followed by non-Hispanic black adults (≈0.50), while Mexican American, Non-Hispanic Asian and Non-Hispanic White strata exhibited similar prevalence rates around 0.46.
At high-school, three racial groups (Mexican American, Non-Hispanic Asian, Non-Hispanic White) exhibit a transient peak (0.50-0.525) before declining sharply into college and graduate levels, suggesting that the early collegiate environment still exposes adults to obesogenic pressures (irregular schedules, campus foodscapes).
By contrast, Non-Hispanic Black and Other Hispanic demonstrate a slight decrease at high-school, followed by a secondary rise at college before resuming descent—underscoring race-specific sensitivity to transitional academic settings.
3.3.3. Employment status
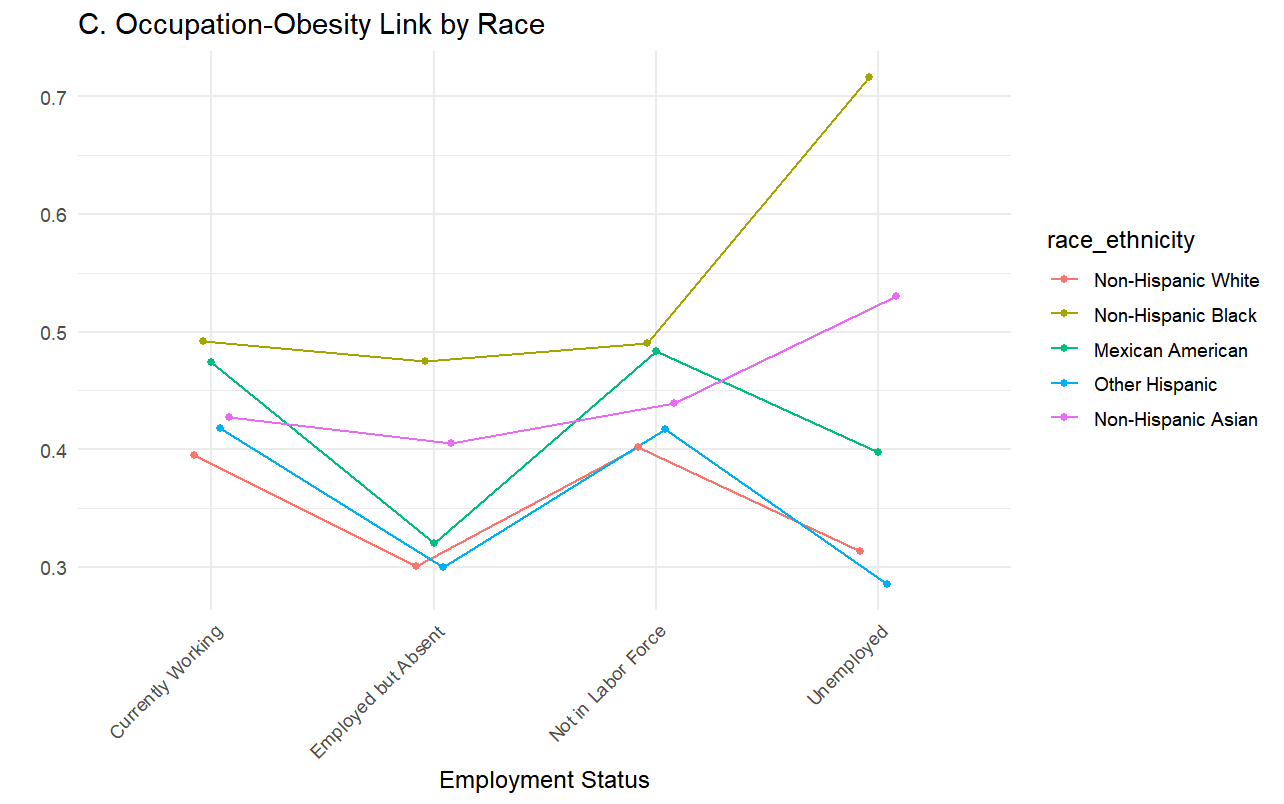
As is shown in Figure 4, currently working and Not in Labor Force adults exhibit nearly identical obesity probabilities (0.4-0.5 across all races), suggesting that formal employment status alone (vs. voluntary/non-participation) does not substantially alter obesogenic exposure once income and education are held constant.
Being employed but absent is associated with a race-specific decrease in obesity probability: Mexican American, Non-Hispanic White and Other Hispanic show marked decreases (about 10% points)-with Non-Hispanic White and Other Hispanic reaching their lowest observed rates (≈0.3)-whereas Non-Hispanic Black and Non-Hispanic Asian exhibit modest drops (within 5%-points). This suggests that short-term absence may disproportionately reduce adults’ exposure to workplace obesogenic factors (irregular schedules, on-site foodscapes), while Black and Asian adults maintain higher baseline probabilities, consistent with residual neighbourhood disadvantages and stress-related metabolic responses.
Unemployment induces steep but opposite changes by race: Non-Hispanic Black and Non-Hispanic Asian adults exhibit substantial increases, whereas Mexican American, Other Hispanic and Non-Hispanic White adults demonstrate marked decreases .
The most pronounced effect is observed in Non-Hispanic Black adults, whose probability rises to ≈0.72-underscoring that job loss disproportionately exposes this group to obesogenic environments (food swamps, stress-related over-consumption), while protective effects emerge in other racial strata.
4. Conclusion
This study conducted a racially stratified analysis of multidimensional socioeconomic status (SES) among US adults and found distinct pathways to obesity across racial/ethnic groups. Key findings: Education was the most consistent and significant predictor—higher educational attainment linearly reduced the odds of obesity, and this gradient persisted across all population groups after adjusting for other SES factors. While income was not generally associated with obesity after controlling for education/occupation, racial patterns emerged: low-income non-Hispanic black adults had the highest obesity prevalence, and higher income did not eliminate racial disparities, supporting "diminishing returns" for minorities. Although the main employment effect was not significant, stratified analyses revealed race-specific risks: unemployment increased the odds of obesity by approximately 20% for non-Hispanic black adults (while being protective/neutral for the rest of the population), while being employed but not at home reduced the odds of obesity for Mexican Americans, non-Hispanic whites, and other Hispanic adults. These findings call for targeted policies: strengthening education for minority youth; addressing structural and community-based obesity drivers (e.g., food swamps) in low-income Black/Hispanic areas beyond income transfers; and developing personalized social safety nets and job training programs to mitigate the impact of unemployment on non-Hispanic Black adults.
This cross-sectional study cannot establish causality and lacks contextual variables (e.g., the neighborhood food environment). Future research should employ longitudinal designs and geospatial data to explore racial differences in obesity risk dynamics and the interplay between location and socioeconomic status.
References
[1]. McLaren, L. (2007). Socioeconomic status and obesity. Epidemiologic reviews, 29(1), 29-48.
[2]. Frederick, C. B., Snellman, K., & Putnam, R. D. (2014). Increasing socioeconomic disparities in adolescent obesity. Proceedings of the National Academy of Sciences, 111(4), 1338-1342.
[3]. Gong, S., Wang, L., Zhou, Z., Wang, K., & Alamian, A. (2022). Income disparities in obesity Trends among US adults: an analysis of the 2011–2014 California health interview survey. International journal of environmental research and public health, 19(12), 7188.
[4]. Bann, D., Cooper, R., Wills, A. K., Adams, J., & Kuh, D. (2014). Socioeconomic position across life and body composition in early old age: findings from a British birth cohort study. J Epidemiol Community Health, 68(6), 516-523.
[5]. Oddo, V. M., Zhuang, C. C., Dugan, J. A., Andrea, S. B., Hajat, A., Peckham, T., & Jones‐Smith, J. C. (2023). Association between precarious employment and BMI in the United States. Obesity, 31(1), 234-242.
Cite this article
Zhang,X. (2025). The Relationship Between Obesity and Socioeconomic Status: Evidence from NHANES 2021-2023. Applied and Computational Engineering,203,1-8.
Data availability
The datasets used and/or analyzed during the current study will be available from the authors upon reasonable request.
Disclaimer/Publisher's Note
The statements, opinions and data contained in all publications are solely those of the individual author(s) and contributor(s) and not of EWA Publishing and/or the editor(s). EWA Publishing and/or the editor(s) disclaim responsibility for any injury to people or property resulting from any ideas, methods, instructions or products referred to in the content.
About volume
Volume title: Proceedings of CONF-SPML 2026 Symposium: The 2nd Neural Computing and Applications Workshop 2025
© 2024 by the author(s). Licensee EWA Publishing, Oxford, UK. This article is an open access article distributed under the terms and
conditions of the Creative Commons Attribution (CC BY) license. Authors who
publish this series agree to the following terms:
1. Authors retain copyright and grant the series right of first publication with the work simultaneously licensed under a Creative Commons
Attribution License that allows others to share the work with an acknowledgment of the work's authorship and initial publication in this
series.
2. Authors are able to enter into separate, additional contractual arrangements for the non-exclusive distribution of the series's published
version of the work (e.g., post it to an institutional repository or publish it in a book), with an acknowledgment of its initial
publication in this series.
3. Authors are permitted and encouraged to post their work online (e.g., in institutional repositories or on their website) prior to and
during the submission process, as it can lead to productive exchanges, as well as earlier and greater citation of published work (See
Open access policy for details).
References
[1]. McLaren, L. (2007). Socioeconomic status and obesity. Epidemiologic reviews, 29(1), 29-48.
[2]. Frederick, C. B., Snellman, K., & Putnam, R. D. (2014). Increasing socioeconomic disparities in adolescent obesity. Proceedings of the National Academy of Sciences, 111(4), 1338-1342.
[3]. Gong, S., Wang, L., Zhou, Z., Wang, K., & Alamian, A. (2022). Income disparities in obesity Trends among US adults: an analysis of the 2011–2014 California health interview survey. International journal of environmental research and public health, 19(12), 7188.
[4]. Bann, D., Cooper, R., Wills, A. K., Adams, J., & Kuh, D. (2014). Socioeconomic position across life and body composition in early old age: findings from a British birth cohort study. J Epidemiol Community Health, 68(6), 516-523.
[5]. Oddo, V. M., Zhuang, C. C., Dugan, J. A., Andrea, S. B., Hajat, A., Peckham, T., & Jones‐Smith, J. C. (2023). Association between precarious employment and BMI in the United States. Obesity, 31(1), 234-242.