


1. Introduction
Diabetes, also known as a chronic illness, is a group of metabolic diseases due to a high level of sugar in the blood over a long period. The risk factor and severity of diabetes can be reduced significantly if the precise early prediction is possible [1]. Diabetes is a life-long disease because of the high levels of sugar within the blood [2]. More than 90-95% of people worldwide are affected by Type 2 diabetes [3]. In the research on prediction accuracy rates, the results on the PID dataset demonstrate that a deep learning approach designs an auspicious system for the prediction of diabetes with a prediction accuracy of 98.35%, F1 score of 98, and an MCC of 97 for five-fold cross-validation [4]. In [5], the authors employed three different ML classifiers, such as Machine Learning (DT), Support Vector Machine (SVM), and Naïve Bayes (NB), to prognosticate the likelihood of diabetes with maximum accuracy. They demonstrated that NB is the best-performing model with an AUC of 0.819.
In this experiment, 1,200 clinical subjects were selected as the dataset for machine learning, including both those with and without diabetes. Each object has detailed characteristic information, such as glycated hemoglobin, fasting blood glucose, 2-hour postprandial blood glucose, age, and family history of diabetes, among others. Then, two models were selected: the logistic regression model, representing linear models, and the fully connected layer model, representing nonlinear models, for machine learning. For each model, the experimental group assigns weights to the feature variables, while the control group assigns equal weights to all the feature variables. Therefore, a total of four experiments were conducted. This study aimed to explore which model is more suitable for clinical use in the early prediction stage of diabetes, and whether assigning weights to the feature variables would lead to a higher accuracy rate for disease prediction. This result can more conveniently identify people at high risk of diabetes, and avoid unnecessary, excessive examinations and treatments for those at low risk, thereby reducing the economic burden and psychological stress on patients.
2. Data and model research methods
2.1. Research procedure
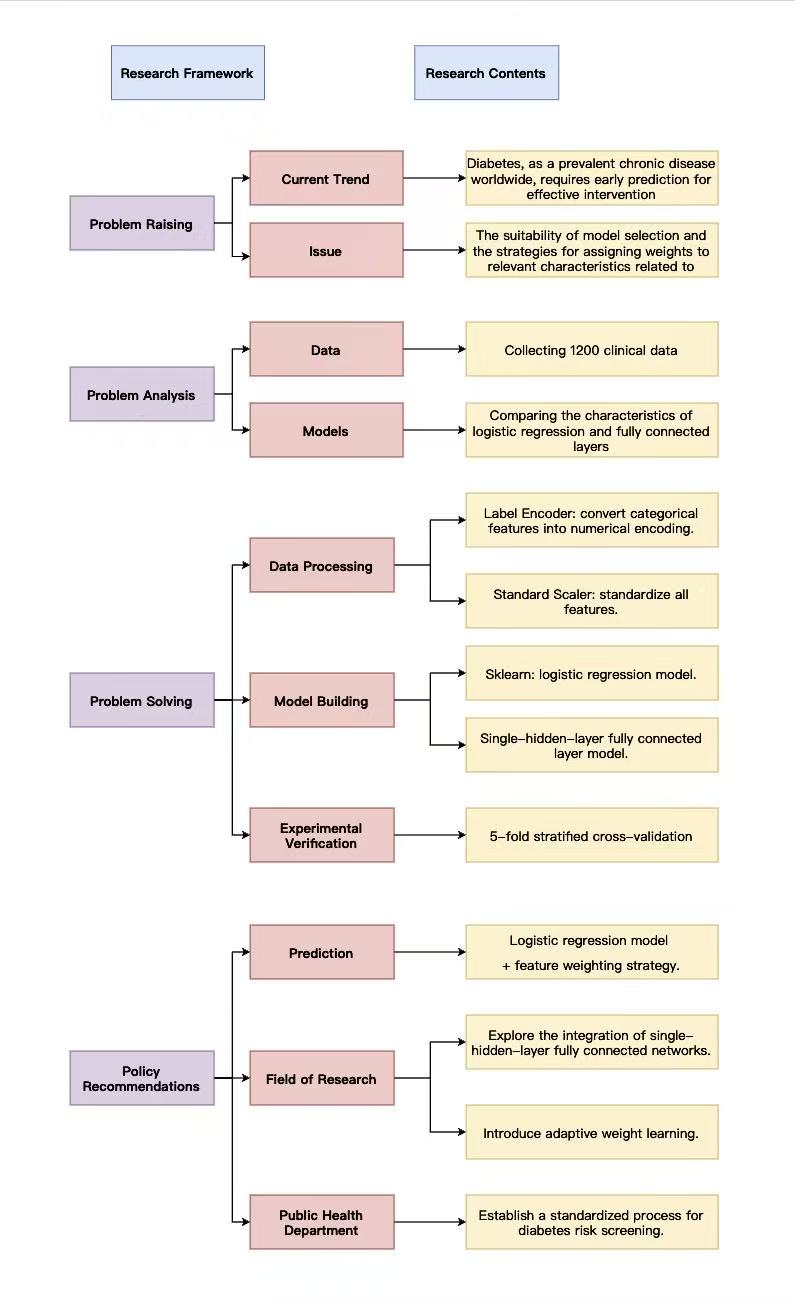
Figure 1 shows the eesearch framework. This study focuses on feature selection and weight configuration in early diabetes prediction. Current diabetes prediction has two limitations: a lack of systematic comparison between logistic regression and fully connected layer models with analysis of feature weight strategies, and insufficient research on how feature weights affect linear and non-linear models, making it difficult to determine optimal model-weight combinations.
The research analyzed semi-structured clinical data from 1200 patients in a hospital, including 12 clinical features, such as BMI, systolic blood pressure, fasting blood glucose, and diabetes status labels. At the model level, it compared logistic regression with single-hidden-layer fully connected layers, focusing on their adaptability differences in binary prediction tasks like diabetes. Regarding weight configuration, both weighted and unweighted schemes were designed to explore their impact on model performance.
In processing, categorical features were converted to numerical values using label encoding, and all features underwent standardization. Logistic regression models were built using scikit-learn, while single-hidden-layer fully connected neural networks were constructed with deep learning frameworks, each configured in weighted and unweighted versions. Through 5-fold stratified cross-validation, the single-hidden-layer fully connected model showed superior performance, and the feature weight strategy effectively improved prediction accuracy for both model types.
Based on findings, policy recommendations include that medical institutions should prioritize logistic regression combined with feature weight strategies for early diabetes prediction; future research could explore the integration of logistic regression with single-hidden-layer fully connected layers and introduce attention mechanisms for dynamic weight adjustment to optimize prediction in complex clinical scenarios.
2.2. Data module
2.2.1. Dataset introduction
This study utilized a clinical diabetes dataset from a certain hospital, which consisted of 1200 samples. The feature values included gender, age, smoking history, diabetes family history, BMI, systolic blood pressure, diastolic blood pressure, fasting blood glucose, 2-hour post-meal blood glucose, glycosylated hemoglobin, lipid indicators, whether having hypertension, and whether suffering from diabetes, totaling 12 items.
2.2.2. Data processing
The data for this study were derived from the clinical treatment records of diabetic patients in a certain hospital. They encompassed 12 characteristic variables, including 9 numerical and 3 categorical, and 1 target variable, indicating whether the patient has diabetes. First, select the samples without missing values for the target variable, clearly define the two labels of "non-diabetic" and "diabetic", and verify the sample distribution to confirm that there is no severe class imbalance, ensuring the validity of the modeling data.
Then, for numerical variables, the Z-score standardization method was employed to convert all numerical features into a distribution with a mean of 0 and a standard deviation of 1, eliminating the feature scale differences caused by different units, such as blood pressure in mmHg and blood sugar in mmol/l, and avoiding the model's excessive reliance on features with a large numerical range.
Furthermore, for categorical variables, a category encoding method is employed to convert discrete qualitative values into continuous integers that can be recognized by the model. This approach preserves the semantic associations of the features while enabling the conversion of categorical data into a numerical format, providing compatible input for subsequent model training.
2.2.3. Assigning weights
To explore how feature weight optimization affects diabetes prediction models, this study designed two strategies: "differentiated weights" and "equal weights," applied respectively to logistic regression and a fully connected layer.
The equal-weight strategy aims to construct a baseline model without feature priorities, eliminating differences in feature importance for unbiased initial weights. For logistic regression, Z-score standardization is applied to all features (mean=0, standard deviation=1), ensuring equal weights at the early training stage without feature priority bias. For fully connected neural networks, to prevent automatic learning of feature importance, less clinically significant features are scaled up, and high-intensity noise is added to core physiological indicators, forcing equal initial contribution of all features in early training.
The differentiated weighting strategy, based on clinical knowledge and data-driven, assigns higher weights to core features to enhance their predictive contribution and improve diagnostic accuracy. For logistic regression, random forest calculates feature importance via decision tree splitting contribution, selecting core diabetes indicators, such as fasting blood glucose, 2-hour post-meal blood glucose, and glycosylated hemoglobin. Core features get weight coefficients of 1.5, while non-core features get 1.0, strengthening key indicators' influence to align with clinical logic. For fully connected networks, "autonomous weight learning" is used—input and hidden layer weights update iteratively during training, letting the model identify important features by data distribution. Post-training, the input layer weight matrix L2 norm quantifies feature weights, with clinical core features contributing more and achieving data-pattern and clinical-logic consistent differentiated allocation.
2.3. Models
2.3.1. Feature weight optimization logistic regression
This model enhances the influence of critical clinical indicators on the prediction results through differentiated weight allocation. The determination of feature weights is accomplished through an ensemble learning method. The predictive contribution of each feature is quantitatively evaluated using an ensemble tree model, and then weights are allocated based on the average importance ratio of each feature. During the prediction process, the weighted features are integrated through a linear function, and then mapped to the probability of illness through a probability conversion mechanism, providing a quantitative basis for clinical risk assessment.
2.3.2. Unweighted logistic regression
Unweighted logistic regression was used as the control model, employing a feature equalization processing strategy. Its feature preprocessing process was consistent with the weighted version, eliminating the complex weight calculation and optimization steps.
2.3.3. Feature weight optimization multi-layer perceptron model
The model is based on a deep network structure and combines feature weight optimization to accurately capture complex clinical correlations. Its network structure consists of four fully connected layers: the input layer has a dimension matching the total number of features, ensuring that all preprocessed indicators can be effectively input; the hidden layers sequentially have 64, 32, and 16 neurons, achieving deep integration of features by gradually reducing the dimension; the output layer corresponds to a binary classification task and directly outputs the prediction results of the two health states. The hidden layers all use the ReLU activation function, which can effectively introduce nonlinear factors, enabling the model to learn the complex correlations between clinical indicators, such as the combined influence of fasting blood glucose and positive family history, and the interaction between blood pressure and lipid indicators, etc. During the training process, the model dynamically adjusts the network parameters through the backpropagation algorithm, while combining feature weight optimization to further enhance the influence of key indicators on the network decision.
2.3.4. Unweighted multi-layer perceptron model
The unweighted multi-layer perceptron model was used as a control. Its network structure was the same as the weighted version, except that an equalization strategy was adopted in the feature preprocessing stage to eliminate the inherent differences in the importance of the features. It performed numerical amplification on indicators with less clinical significance and added noise interference to key indicators such as blood glucose and glycosylated hemoglobin, forcing all features to tend towards balance at the numerical level. This ensured that all features had the same influence in the early stage of model training, without any additional weight adjustment mechanism.
3. Experiment on model evaluation and comparison
3.1. Experimental setup
3.1.1. 5-Fold stratified cross-validation
When the number of samples that can be utilized to train the model is significantly reduced, the outcomes can sometimes be affected by a random selection of the (train, validation) sets [6, 7]. Moreover, the biggest advantage of using the K-Fold CV technique is that it does not care about how the data is divided [8]. In this experiment, the data set was divided using the five-fold stratified cross-validation method to ensure the stability and reliability of the experimental results. This method divides the dataset into five mutually exclusive subsets. The use of randomized subsets of data in cross-validation is a strong way to test the success rate of models used for classification in healthcare organizations [9, 10]. Within each subset, the distribution ratio of the two types of healthy state samples is the same as that of the original dataset, effectively avoiding experimental deviations caused by imbalanced sample distribution. During the experiment, each subset was successively used as the validation set, while the remaining four subsets were combined as the training set. This process was repeated five times for training and validation. Finally, the average value of the five validations was taken as the experimental result, which significantly reduced the random error of a single experiment and improved the credibility of model performance evaluation, ensuring the scientific nature of the experimental conclusion.
3.1.2. Experimental comparison design
This study designed two sets of control experiments: The first set compared the weights of the logistic regression model, by examining the performance differences between the weighted and unweighted versions, to verify the enhancement effect of feature weight optimization on the linear model; the second set compared the weights of the multi-layer perceptron model, by analyzing the performance under two different weight configurations, to investigate the impact of weight optimization on the non-linear model. All experiments were conducted under the same hardware environment and data preprocessing standards to ensure that the experimental variables were only the weight configuration strategies, thereby accurately verifying the value of weight optimization and providing a reliable experimental basis for the optimization direction of the diabetes prediction model.
3.2. Results and analysis
|
Accuracy |
Precision (no diabetes) |
Recall (no diabetes) |
F1 (no diabetes) |
Precision (diabetes) |
Recall (diabetes) |
F1 (diabetes) |
AUC |
|
|
logistic regression (weight) |
98.90% |
96.99% |
96.99% |
96.96% |
99.33% |
99.33% |
99.33% |
99.93% |
|
fully connected layer(weight) |
98.38% |
95.62% |
95.47% |
95.51% |
99.01% |
99.02% |
99.01% |
99.49% |
|
logistic regression (no weight) |
95.60% |
85.53% |
91.46% |
88.36% |
98.07% |
96.53% |
97.29% |
97.98% |
|
fully connected layer (no weight) |
93.16% |
79.65% |
83.41% |
81.42% |
96.34% |
95.29% |
95.81% |
96.75% |
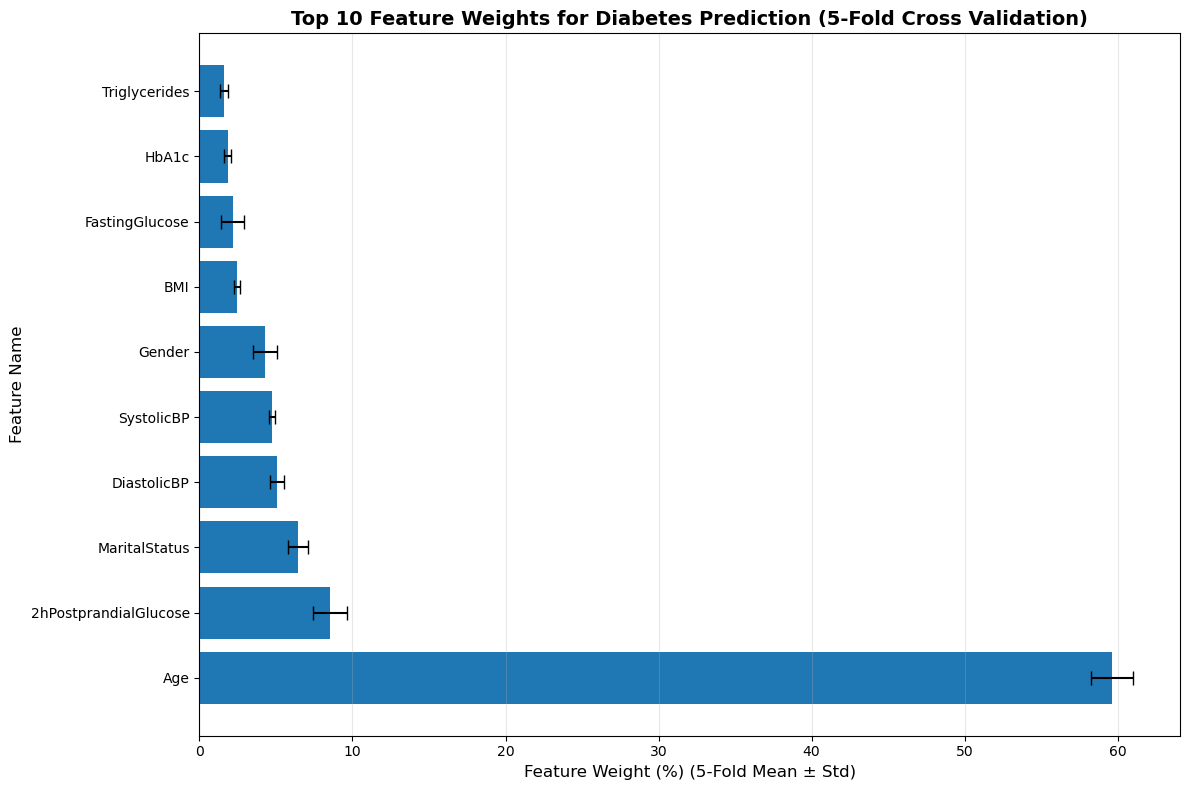
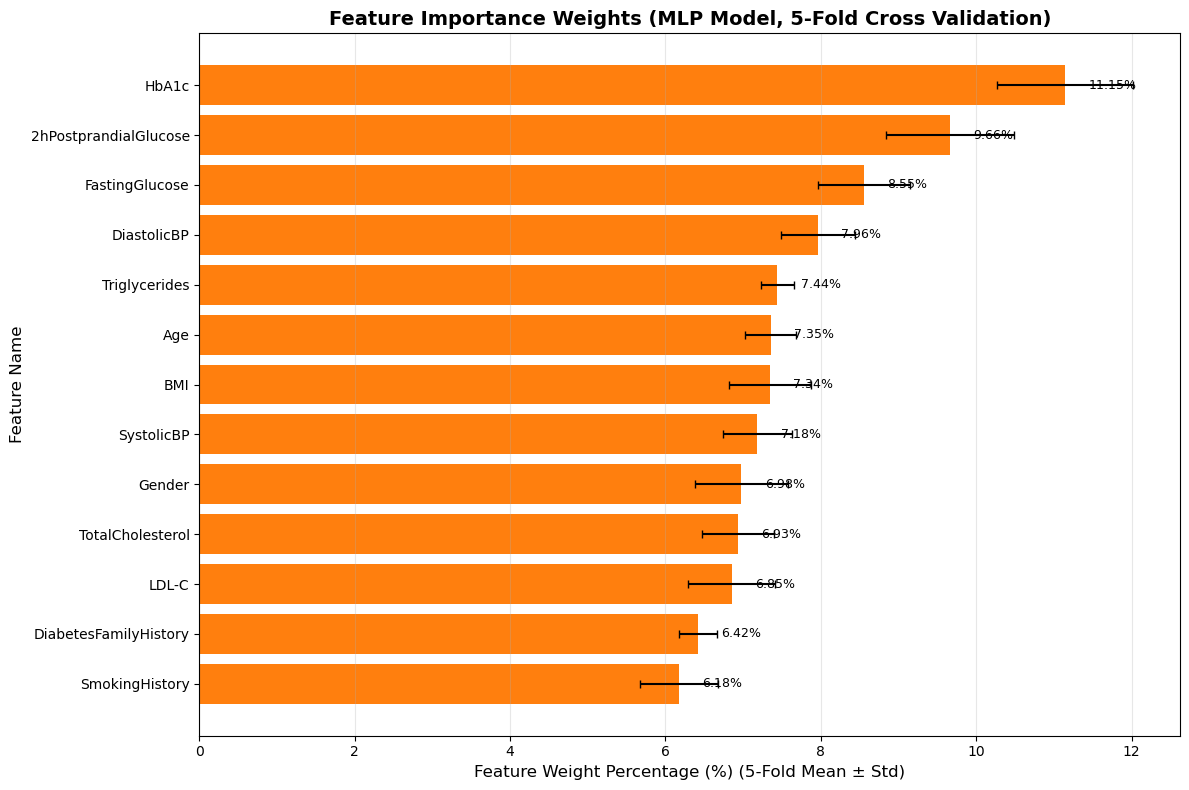
Table 1 presents the performance indicators of different models in diabetes prediction, including accuracy, precision, recall rate, F1 score, and AUC.
The evaluation is conducted by differentiating between "no diabetes" and "diabetes" samples. In terms of overall accuracy rate, the logistic regression model with feature weights is the best, achieving 98.90%. The fully connected layer model with weights comes second, with an accuracy of 98.38%. The model without weights shows a significant decline in performance, with the unweighted logistic regression reaching 95.60% and the unweighted fully connected layer only 93.16%. This highlights the crucial role that feature weights play in the model's performance. Similarly, for both the healthy and ill patients, the calculated precision, recall, F1, and AUC, as well as the weighted accuracy rates, are all higher than the average weights. The accuracy rate of the logistic regression model is higher than that of the fully connected layer model.
When assigning weights to the feature vectors in the logistic regression model and the fully connected layer model, the results showed that in Figure 2, the logistic regression model, age accounted for the highest proportion, exceeding 50%, followed by 2h postprandial glucose, accounting for approximately 9%, and finally marital status, which was about 7%. The results of the fully connected layer model in Figure 3 show that the weight of HbA1c (glycated hemoglobin) is the highest at 11.15%, followed by 2h postprandial glucose at 9.66%, and fasting glucose at 8.55%.
Overall, the logistic regression model with feature weights achieves the best comprehensive performance in the diabetes prediction task. The introduction of feature weights is of great significance in improving the classification accuracy of the model and reducing false positives and false negatives. Blood glucose concentration, glycated hemoglobin, and age are all important indicators for assessing whether someone has diabetes.
4. Conclusions
From the results of diabetes prediction accuracy, the weighted logistic regression performed the best, followed by the weighted fully connected layer, and the unweighted logistic regression came next. The unweighted fully connected layer had the lowest accuracy rate. The accuracy of the linear model (logistic regression) is superior to that of the non-linear model (fully connected layer). The main reason for this is not that the linear model is inherently "better", but rather the difference in the adaptability of the current task scenario to the model. In diabetes prediction, the core weight features have a more direct and quantifiable linear relationship with the disease status, and logistic regression combined with weights can accurately capture such relationships. Although the fully connected layer can learn complex nonlinear relationships, in this task, there is no strong nonlinear relationship to be explored. As a result, the complexity of the network increases the difficulty of weight utilization, leading to performance not meeting expectations. Therefore, feature weights significantly enhance the model's performance, and the adaptability of the model to the task's feature correlation pattern has a greater impact on the prediction effect than the model's linear or non-linear attributes. This also indicates that for clinical diabetes screening, a weighted logistic regression model can be prioritized, taking into account both accuracy and interpretability; subsequently, the weight learning mechanism of the fully connected layer can be optimized, or more extended features that require non-linear modeling can be combined to fully leverage its non-linear advantages.
References
[1]. Hasan, M. K., Alam, M. A., Das, D., Hossain, E., & Hasan, M. (2020). Diabetes prediction using ensembling of different machine learning classifiers. IEEE Access, 8, 76516-76531.
[2]. Bellazzi, R., & Abu-Hanna, A. (2009). Data mining technologies for blood glucose and diabetes management. Journal of diabetes science and technology, 3(3), 603-612.
[3]. Panwar, M., Acharyya, A., Shafik, R. A., & Biswas, D. (2016, December). K-nearest neighbor based methodology for accurate diagnosis of diabetes mellitus. In 2016 sixth international symposium on embedded computing and system design (ISED) (pp. 132-136). IEEE.
[4]. Ayon, S. I., & Islam, M. M. (2019). Diabetes prediction: a deep learning approach. International Journal of Information Engineering and Electronic Business, 10(2), 21.
[5]. Sisodia, D., & Sisodia, D. S. (2018). Prediction of diabetes using classification algorithms. Procedia computer science, 132, 1578-1585.
[6]. Varma, S., & Simon, R. (2006). Bias in error estimation when using cross-validation for model selection. BMC bioinformatics, 7(1), 91.
[7]. Prusty, S., Patnaik, S., & Dash, S. K. (2022). SKCV: Stratified K-fold cross-validation on ML classifiers for predicting cervical cancer. Frontiers in Nanotechnology, 4, 972421.
[8]. Bhatt, A. R., Ganatra, A., & Kotecha, K. (2021). Cervical cancer detection in pap smear whole slide images using convnet with transfer learning and progressive resizing. PeerJ Computer Science, 7, e348.
[9]. Marcot, B. G., & Hanea, A. M. (2021). What is an optimal value of k in k-fold cross-validation in discrete Bayesian network analysis?. Computational Statistics, 36(3), 2009-2031.
[10]. Esteva, A., Robicquet, A., Ramsundar, B., Kuleshov, V., DePristo, M., Chou, K., ... & Dean, J. (2019). A guide to deep learning in healthcare. Nature medicine, 25(1), 24-29.
Cite this article
Gao,Y. (2025). Diabetes Prediction: The Influence of the Model and Feature Weights on the Accuracy Rate. Applied and Computational Engineering,204,21-28.
Data availability
The datasets used and/or analyzed during the current study will be available from the authors upon reasonable request.
Disclaimer/Publisher's Note
The statements, opinions and data contained in all publications are solely those of the individual author(s) and contributor(s) and not of EWA Publishing and/or the editor(s). EWA Publishing and/or the editor(s) disclaim responsibility for any injury to people or property resulting from any ideas, methods, instructions or products referred to in the content.
About volume
Volume title: Proceedings of CONF-MLA 2025 Symposium: Intelligent Systems and Automation: AI Models, IoT, and Robotic Algorithms
© 2024 by the author(s). Licensee EWA Publishing, Oxford, UK. This article is an open access article distributed under the terms and
conditions of the Creative Commons Attribution (CC BY) license. Authors who
publish this series agree to the following terms:
1. Authors retain copyright and grant the series right of first publication with the work simultaneously licensed under a Creative Commons
Attribution License that allows others to share the work with an acknowledgment of the work's authorship and initial publication in this
series.
2. Authors are able to enter into separate, additional contractual arrangements for the non-exclusive distribution of the series's published
version of the work (e.g., post it to an institutional repository or publish it in a book), with an acknowledgment of its initial
publication in this series.
3. Authors are permitted and encouraged to post their work online (e.g., in institutional repositories or on their website) prior to and
during the submission process, as it can lead to productive exchanges, as well as earlier and greater citation of published work (See
Open access policy for details).
References
[1]. Hasan, M. K., Alam, M. A., Das, D., Hossain, E., & Hasan, M. (2020). Diabetes prediction using ensembling of different machine learning classifiers. IEEE Access, 8, 76516-76531.
[2]. Bellazzi, R., & Abu-Hanna, A. (2009). Data mining technologies for blood glucose and diabetes management. Journal of diabetes science and technology, 3(3), 603-612.
[3]. Panwar, M., Acharyya, A., Shafik, R. A., & Biswas, D. (2016, December). K-nearest neighbor based methodology for accurate diagnosis of diabetes mellitus. In 2016 sixth international symposium on embedded computing and system design (ISED) (pp. 132-136). IEEE.
[4]. Ayon, S. I., & Islam, M. M. (2019). Diabetes prediction: a deep learning approach. International Journal of Information Engineering and Electronic Business, 10(2), 21.
[5]. Sisodia, D., & Sisodia, D. S. (2018). Prediction of diabetes using classification algorithms. Procedia computer science, 132, 1578-1585.
[6]. Varma, S., & Simon, R. (2006). Bias in error estimation when using cross-validation for model selection. BMC bioinformatics, 7(1), 91.
[7]. Prusty, S., Patnaik, S., & Dash, S. K. (2022). SKCV: Stratified K-fold cross-validation on ML classifiers for predicting cervical cancer. Frontiers in Nanotechnology, 4, 972421.
[8]. Bhatt, A. R., Ganatra, A., & Kotecha, K. (2021). Cervical cancer detection in pap smear whole slide images using convnet with transfer learning and progressive resizing. PeerJ Computer Science, 7, e348.
[9]. Marcot, B. G., & Hanea, A. M. (2021). What is an optimal value of k in k-fold cross-validation in discrete Bayesian network analysis?. Computational Statistics, 36(3), 2009-2031.
[10]. Esteva, A., Robicquet, A., Ramsundar, B., Kuleshov, V., DePristo, M., Chou, K., ... & Dean, J. (2019). A guide to deep learning in healthcare. Nature medicine, 25(1), 24-29.