


1. Introduction
Vision-only systems degrade under low-light conditions, glare, motion blur, and texture-poor scenes. Range and dynamics sensors contribute complementary geometry, velocity, and motion cues that compensate for such failure modes. Multimodal fusion leverages these complementary strengths to increase robustness across perception and control tasks. Field performance depends on algorithms and disciplined timing, power integrity, electromagnetic compatibility, and input/output bandwidth. Previous investigations establish a basis for a methodical integration spanning across autonomous platforms and manufacturing environments [1-9].
This article consolidates peer-reviewed evidence anchored to widely reused datasets and tasks in industrial inspection and mobile robotics. Reported accuracy and robustness trends are related to system-level constraints—synchronization, calibration, electromagnetic hygiene, and data-path capacity—so that improvements observed in benchmarks can transfer to deployed systems.
Research objectives
O1. Establish the core functions and failure modes of RGB, depth, thermal, LiDAR, radar, and IMU across typical operating conditions, and summarize how these characteristics shape sensing trade-offs [2-7,9].
O2. Quantify the extent to which multimodal fusion improves task metrics (miss rate, trajectory error, 3D detection quality, bird’s-eye-view map fidelity) and characterize the associated system costs in latency, power, compute, and maintainability [1-8].
O3. Specify the timing and electrical conditions—clock synchronization, trigger design, power delivery, grounding and shielding, and link capacity—under which the reported improvements are reproducible beyond controlled laboratory settings.
2. Methods: literature synthesis
The synthesis emphasizes pivotal studies, frequently employed datasets, and integrated architectures accompanied by explicit quantitative analyses, in conjunction with fundamental research on odometry, calibration methodologies, and sensor characterization [1-8,10]. Surveying the literature shapes the nomenclature, classifications of fusion stages (nascent, intermediate, advanced), and system architecture aspects encompassing synchronization, energy consumption, and electromagnetic interference [11,12]. Because reported works employ heterogeneous metrics and evaluation protocols, values are harmonized to preserve directionality and scale while avoiding incompatible aggregations.
For KAIST multispectral pedestrian detection, normalized miss rate is used with the color-only baseline set to 100, allowing relative improvements from color–thermal fusion to be read directly. For TUM VI visual–inertial odometry, per-sequence absolute trajectory error is summarized by the median across sequences for each pipeline, which stabilizes comparison across motion patterns and illumination changes. In the context of nuScenes 3D perception, the evaluation plots illustrate relative performance gains achieved by a typical bird’s-eye-view fusion technique compared to existing state-of-the-art methods and single-modality baselines. This highlights the impact of cross-sensor features, while avoiding the mixing of absolute scores that could arise from differing training protocols [4,5,8,10].
Absolute runtime and end-to-end latency vary substantially with hardware, compilers, and thermal environments; cross-paper latency claims are therefore not pooled. Threats to validity include differences in data splits, training schedules, augmentations, and implementation details. Consequently, aggregated values are interpreted as trends rather than device-specific forecasts. Where appropriate, cautionary notes regarding metric pitfalls and reproducibility practices are added to guide deployment-oriented readers [4,5,10-13].
|
Dataset |
Modality and task |
What is extracted |
|
MVTec AD [1] |
RGB, industrial anomaly and defect |
Benchmark context |
|
KAIST [5] |
Color and thermal, pedestrian |
Miss rate reduction from fusion |
|
TUM VI [4] |
Stereo plus IMU, VIO |
Per sequence ATE to median |
|
nuScenes [3,10] |
Multi camera and LiDAR, 3D |
BEVFusion deltas for mAP, NDS, mIoU |
3. Results
3.1. KAIST multispectral pedestrian detection
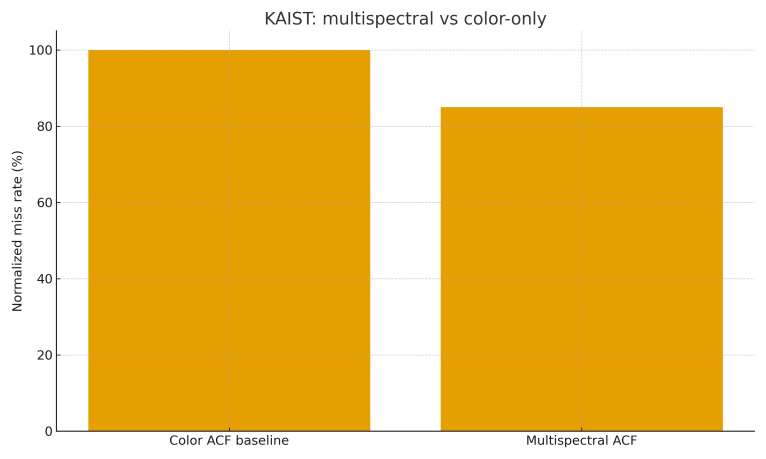
KAIST provides approximately ninety-five thousand aligned color–thermal image pairs with day- and night-time coverage. Relative to a color-only baseline, incorporating thermal cues lowers normalized miss rate by roughly fifteen percent, with the largest gains in low-illumination scenes. Figure 1 shows the normalized miss rate with the color-only baseline fixed at 100 and the multispectral variant reduced to about 85, illustrating a consistent margin attributable to cross-spectral contrast. The effect arises because thermal responses separate human targets from backgrounds that remain bright or cluttered in the visible spectrum, improving subject–background discrimination under headlight glare and weak ambient lighting. The reported enhancements rely on precise cross-modal registration and synchronized exposure. Misalignment, desynchronization, or inconsistent calibration can diminish these advantages, especially concerning slender features and partially hidden pedestrians [4].
3.2. TUM VI visual inertial odometry benchmarks
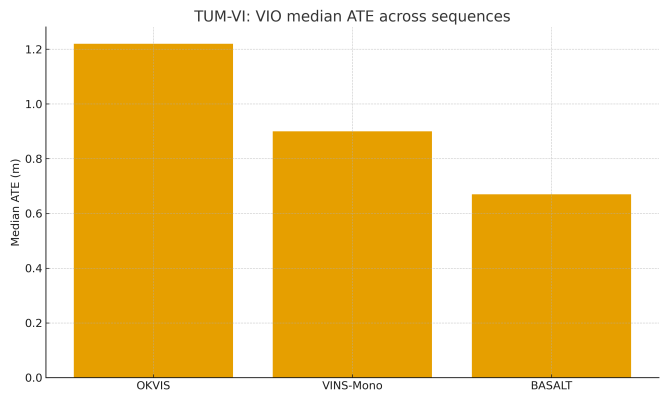
TUM VI evaluates odometry across corridors, rooms, outdoor paths, and fast-motion sequences that challenge photometric constancy and feature tracking. The benchmark reports per-sequence absolute trajectory error (ATE) for multiple pipelines. This article summarizes performance using the median ATE across sequences to stabilize comparison under varying illumination and motion patterns. Figure 2 shows the medians for OKVIS, VINS-Mono, and BASALT, revealing consistent reductions in drift for tightly coupled visual–inertial estimators relative to visual-only baselines. The variations among the three pipelines stem from decisions regarding initialization techniques, photometric modeling approaches, IMU preintegration methods, marginalization strategies, and outlier rejection algorithms. Reproducible gains depend on accurate camera–IMU temporal alignment, calibrated intrinsics and extrinsics, and consistent exposure control; misalignment or incomplete photometric calibration can inflate drift, especially during rapid rotations and low-light intervals [5,10,11].
3.3. nuScenes with BEVFusion
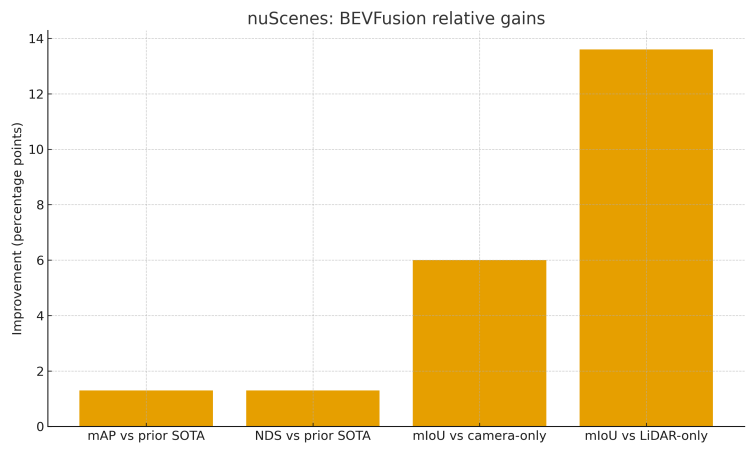
On nuScenes, camera imagery and LiDAR point clouds are fused in a bird’s-eye-view (BEV) representation that aligns heterogeneous features onto a common planar grid. A representative method, BEVFusion, reports +1.3 percentage points for both mAP and NDS over the prior state of the art for 3D detection. For BEV map segmentation, reported gains are +6 points relative to camera-only and +13.6 points relative to LiDAR-only models. Figure 3 summarizes these relative improvements as deltas to avoid mixing absolute scores produced under different training schedules and augmentation regimes. The most pronounced enhancements are consistently noted for diminutive or remote objects, as well as in nocturnal settings, where the synergistic integration of LiDAR's geometric precision and the rich semantic data from cameras effectively mitigates their respective limitations. The BEV alignment further reduces perspective mismatch across cameras and simplifies multi-task heads for detection and mapping, contributing to stable improvements when training settings are held comparable [6,8].
3.4. Industrial inspection context from MVTec AD
MVTec AD defines standardized categories and split conventions for industrial anomaly and defect detection, covering objects and textures with pixel-level annotations for localization.In standard reporting practices, image-level AUROC serves to evaluate anomaly detection, while pixel-wise AUROC or per-region-overlap (PRO) metrics are employed for segmentation tasks, facilitating standardized comparisons between different methodologies [3,13]. Although the present synthesis does not rerun models, the dataset illustrates why multimodal sensing benefits production lines. Texture-poor surfaces and specular metals often confound RGB detectors through weak gradients and glare; complementary depth or thermal cues introduce geometry and emissivity signals that help separate dents, warps, scratches, and delamination from background. Near-infrared illumination or structured light further stabilizes inspection under varying ambient conditions by reducing sensitivity to albedo changes. Consistent gains depend on controlled illumination, cross-sensor calibration, and synchronized triggering; misregistration and exposure mismatch can negate fusion advantages without these conditions. Adopting MVTec AD’s metrics and protocol when reporting factory results improves external validity and eases future replication or re-evaluation as fusion architectures evolve [1,3,13].
4. Systems considerations for reproducible gains
Reliable gains from fusion depend on engineering discipline in timing, calibration, power integrity, electromagnetic compatibility, bandwidth planning, compute determinism, and maintenance. The following practices are commonly assumed—sometimes implicitly—in benchmark reports and are necessary to recover similar performance in deployed systems [6,8,12,14].
Timing and synchronization. IEEE-1588 Precision Time Protocol or pulse-per-second hardware triggers maintain alignment among cameras, LiDAR, and IMU. Offset and jitter are logged with thresholds that raise alarms when exceeded. To mitigate transport uncertainty, time stamping is implemented proximally to the sensor. Employing deterministic trigger wiring obviates race conditions that may arise from software schedulers [12].
Calibration. Unified temporal and spatial calibration ties asynchronous clocks and extrinsic transforms into a single optimization, with routine verification after connector or mount changes. Photometric calibration (exposure, response curves, vignetting) reduces bias in visual–inertial pipelines and cross-spectral fusion. Drift in either timing or geometry is treated as a first-class fault requiring recalibration [14].
Power integrity and EMC. Clean power rails with local decoupling, proper grounding topology, and shielded cables reduce resets and packet loss. Strain-relieved, locking connectors prevent intermittent failures caused by vibration. Cable routing separates high-current lines from sensitive sensor wiring, and enclosure design mitigates radiated emissions that can corrupt high-speed links.
Bandwidth and data paths. Camera, LiDAR, and network links are provisioned with headroom and deterministic paths to avoid congestion-induced latency spikes. Drop counters and CRCs on each hop expose silent corruption. When using shared fabrics, traffic shaping and priority queues ensure that bulk transfers do not block time-critical streams (triggers, IMU).
Compute and thermal determinism. Models are compiled for the target hardware with thermal headroom so that latency remains stable across ambient variation. Real-time loops run with pinned resources and bounded memory allocations. Any adaptive clocking or power-saving feature that introduces variable latency is explicitly characterized and, if necessary, disabled.
Observability and maintenance. Calibration schedules, firmware versions, and connector changes are recorded to preserve comparability across deployments. To preemptively identify any decline in perceived quality, I meticulously record and analyze health metrics, including time-sync errors, packet loss, temperature fluctuations, and power rail noise. Replacement procedures include post-maintenance calibration checks.
Adhering to these practices aligns field conditions with those assumed by dataset leaders and fusion reports, making the improvements observed on nuScenes and related benchmarks more likely to appear in production systems [6,8,12,14].
5. Limitations and validity
This synthesis combines data from varied codebases, training setups, and evaluation methods; thus, aggregated values indicate trends, not device-specific predictions. Absolute latency and power use depend on the platform and differ by hardware, compilers, thermal conditions, and runtime settings; cross-paper runtime comparisons are not combined. Some studies use auxiliary steps like test-time augmentation or custom data splits that may inflate absolute scores; the analysis focuses on normalized deltas and median error summaries to maintain direction and scale without mixing incompatible settings. Dataset biases limit external validity—e.g., day/night ratios, scene geometry, or sensor mounting—and implementation details, which rarely match across studies. Reproducible claims need precise temporal and spatial calibration, stable exposure control, and matched preprocessing; if these aren't met, fusion gains may decrease. Future updates should add leaderboard snapshots from matched settings, confidence intervals from a single toolkit, and clear disclosure of calibration, synchronization, and augmentation steps to cut ambiguity in cross-study interpretation [4, 5,10-13].
6. Conclusion
Published evidence supports the use of complementary modalities in conditions that stress vision. On KAIST, color–thermal fusion reduces normalized miss rate in low-illumination scenes. On TUM VI, tightly coupled visual–inertial pipelines lower absolute trajectory error relative to visual-only odometry across diverse motion patterns. Integrating camera and LiDAR data in a bird's-eye view enhances 3D detection and mapping on nuScenes, particularly for small, distant, or nighttime objects. Achieving these gains requires precise timing, robust power and electromagnetic management, sufficient bandwidth with deterministic data paths, and calibrated sensors. Even without new experiments, researchers can produce reliable reports by referencing benchmark studies, normalizing heterogeneous data, and clearly stating timing, calibration, and power assumptions alongside summary figures. When deployment conditions match those described in the literature, the reported improvements transfer more reliably to production lines and field robots, providing a practical template for evidence-driven engineering and a stable foundation for format-specific polishing in subsequent drafts
References
[1]. Conference on Computer Vision and Pattern Recognition (CVPR) (pp. 9592–9600).
[2]. Geiger, A., Lenz, P., & Urtasun, R. (2012). Are we ready for autonomous driving? The KITTI Vision Benchmark Suite. In Proceedings of the IEEE/CVF Conference on Computer Vision and Pattern Recognition (CVPR).
[3]. Caesar, H., Bankiti, V., Lang, A. H., Vora, S., Liong, V. E., et al. (2020). nuScenes. In Proceedings of the IEEE/CVF Conference on Computer Vision and Pattern Recognition (CVPR).
[4]. Schubert, D., Goll, D., Demmel, N., Usenko, V., Stückler, J., & Cremers, D. (2018). The TUM VI benchmark for evaluating visual inertial odometry. In Proceedings of the IEEE/RSJ International Conference on Intelligent Robots and Systems (IROS).
[5]. Hwang, S., Park, J., Kim, N., Choi, Y., & Kweon, I. S. (2015). Multispectral pedestrian detection. In Proceedings of the IEEE/CVF Conference on Computer Vision and Pattern Recognition (CVPR) (pp. 1037–1045).
[6]. Leutenegger, S., Lynen, S., Bosse, M., Siegwart, R., & Furgale, P. (2015). Keyframe based visual inertial odometry using nonlinear optimization. International Journal of Robotics Research, 34(3), 314–334. https: //doi.org/10.1177/0278364914564364
[7]. Qin, T., Li, P., & Shen, S. (2018). VINS Mono. IEEE Transactions on Robotics, 34(4), 1004–1020. https: //doi.org/10.1109/TRO.2018.2851591
[8]. Furgale, P., Rehder, J., & Siegwart, R. (2013). Unified temporal and spatial calibration for multi sensor systems. In Proceedings of the IEEE/RSJ International Conference on Intelligent Robots and Systems (IROS).
[9]. Padilla, R., Netto, S. L., & da Silva, E. A. B. (2021). Analysis of object detection metrics and toolkit. Electronics, 10(3), 279. https: //doi.org/10.3390/electronics10030279
[10]. Liu, Z., Tang, H., Amini, A., Yang, X., Mao, H., Rus, D., & Han, S. (2022). BEVFusion. arXiv preprint arXiv: 2205.13542. ICRA 2023.
[11]. Khaleghi, B., Khamis, A., Karray, F. O., & Razavi, S. N. (2013). Multisensor data fusion. Information Fusion, 14(1), 28–44. https: //doi.org/10.1016/j.inffus.2012.07.003
[12]. Yeong, D. J., Velasco Hernández, G., Barry, J., & Walsh, J. (2021). Sensor and sensor fusion technology in autonomous vehicles. Sensors, 21(6), 2140. https: //doi.org/10.3390/s21062140
[13]. MVTec AD dataset homepage. (n.d.). Retrieved from https: //www.mvtec.com/company/research/datasets/mvtec-ad
[14]. IEEE Standards Association. (2019). IEEE 1588-2019: Precision Time Protocol.
Cite this article
Li,M. (2025). Vision–Sensor–Electrical Integration: Literature Synthesis and System Guidance. Applied and Computational Engineering,203,34-40.
Data availability
The datasets used and/or analyzed during the current study will be available from the authors upon reasonable request.
Disclaimer/Publisher's Note
The statements, opinions and data contained in all publications are solely those of the individual author(s) and contributor(s) and not of EWA Publishing and/or the editor(s). EWA Publishing and/or the editor(s) disclaim responsibility for any injury to people or property resulting from any ideas, methods, instructions or products referred to in the content.
About volume
Volume title: Proceedings of CONF-SPML 2026 Symposium: The 2nd Neural Computing and Applications Workshop 2025
© 2024 by the author(s). Licensee EWA Publishing, Oxford, UK. This article is an open access article distributed under the terms and
conditions of the Creative Commons Attribution (CC BY) license. Authors who
publish this series agree to the following terms:
1. Authors retain copyright and grant the series right of first publication with the work simultaneously licensed under a Creative Commons
Attribution License that allows others to share the work with an acknowledgment of the work's authorship and initial publication in this
series.
2. Authors are able to enter into separate, additional contractual arrangements for the non-exclusive distribution of the series's published
version of the work (e.g., post it to an institutional repository or publish it in a book), with an acknowledgment of its initial
publication in this series.
3. Authors are permitted and encouraged to post their work online (e.g., in institutional repositories or on their website) prior to and
during the submission process, as it can lead to productive exchanges, as well as earlier and greater citation of published work (See
Open access policy for details).
References
[1]. Conference on Computer Vision and Pattern Recognition (CVPR) (pp. 9592–9600).
[2]. Geiger, A., Lenz, P., & Urtasun, R. (2012). Are we ready for autonomous driving? The KITTI Vision Benchmark Suite. In Proceedings of the IEEE/CVF Conference on Computer Vision and Pattern Recognition (CVPR).
[3]. Caesar, H., Bankiti, V., Lang, A. H., Vora, S., Liong, V. E., et al. (2020). nuScenes. In Proceedings of the IEEE/CVF Conference on Computer Vision and Pattern Recognition (CVPR).
[4]. Schubert, D., Goll, D., Demmel, N., Usenko, V., Stückler, J., & Cremers, D. (2018). The TUM VI benchmark for evaluating visual inertial odometry. In Proceedings of the IEEE/RSJ International Conference on Intelligent Robots and Systems (IROS).
[5]. Hwang, S., Park, J., Kim, N., Choi, Y., & Kweon, I. S. (2015). Multispectral pedestrian detection. In Proceedings of the IEEE/CVF Conference on Computer Vision and Pattern Recognition (CVPR) (pp. 1037–1045).
[6]. Leutenegger, S., Lynen, S., Bosse, M., Siegwart, R., & Furgale, P. (2015). Keyframe based visual inertial odometry using nonlinear optimization. International Journal of Robotics Research, 34(3), 314–334. https: //doi.org/10.1177/0278364914564364
[7]. Qin, T., Li, P., & Shen, S. (2018). VINS Mono. IEEE Transactions on Robotics, 34(4), 1004–1020. https: //doi.org/10.1109/TRO.2018.2851591
[8]. Furgale, P., Rehder, J., & Siegwart, R. (2013). Unified temporal and spatial calibration for multi sensor systems. In Proceedings of the IEEE/RSJ International Conference on Intelligent Robots and Systems (IROS).
[9]. Padilla, R., Netto, S. L., & da Silva, E. A. B. (2021). Analysis of object detection metrics and toolkit. Electronics, 10(3), 279. https: //doi.org/10.3390/electronics10030279
[10]. Liu, Z., Tang, H., Amini, A., Yang, X., Mao, H., Rus, D., & Han, S. (2022). BEVFusion. arXiv preprint arXiv: 2205.13542. ICRA 2023.
[11]. Khaleghi, B., Khamis, A., Karray, F. O., & Razavi, S. N. (2013). Multisensor data fusion. Information Fusion, 14(1), 28–44. https: //doi.org/10.1016/j.inffus.2012.07.003
[12]. Yeong, D. J., Velasco Hernández, G., Barry, J., & Walsh, J. (2021). Sensor and sensor fusion technology in autonomous vehicles. Sensors, 21(6), 2140. https: //doi.org/10.3390/s21062140
[13]. MVTec AD dataset homepage. (n.d.). Retrieved from https: //www.mvtec.com/company/research/datasets/mvtec-ad
[14]. IEEE Standards Association. (2019). IEEE 1588-2019: Precision Time Protocol.