


1. Introduction
Stock market prediction is still a major challenge in financial research due to the involvement of many economic, social and psychological factors that cause the volatility of stock prices. Traditional models are mostly based on historical transaction data and technical indicators. They ignore the implicit value contained in the text public opinion and external events, so the prediction effect is not ideal [1,2].
Research shows that the emotions of stock market users have a significant impact on the fluctuations of stock prices [3,4], and there is a two-way influence phenomenon [5]. The stock market can cause changes in the emotions of investors, and these changes in turn have a reverse effect on the stock market. Therefore, studying the element of public opinion is of great significance for improving the predictive performance of the stock market. News is the easiest information to collect to reflect the public opinion of stock investors. Research shows that within twenty minutes of news release, it has a significant effect on the prediction of the stock market [6]. Therefore, this study adopts news data as a new parameter dimension to reflect public opinion and improves the prediction effect through multi-source data [7].
There are four methods for stock price prediction [8]: traditional ML, deep learning and neural networks, time series analysis, and graph-based methods. To adapt to a large amount of data, this study selects the traditional machine learning method.However, due to the chaotic complexity of the stock market, traditional neural network algorithms have poor analysis effects on it [9] and are not as accurate and stable as ML methods [10].
Therefore, this study selects large language models as the tool for filtering news sentiment. By compiling prompt words for them and inputting stock news information, relatively reliable sentiment dimension data is obtained [11,12]. Currently, there are already studies confirming the potential of large language models in the field of sentiment analysis [13], and there are even examples of developing dedicated models through fine-tuning [14].
To this end, this study proposes a "stock prediction model based on news Data", with the main innovations as follows. First, use prompt words to enable the large model to conduct professional sentiment prediction in the financial field instead of ordinary text sentiment analysis. Second, align the transaction data and news data to identify the common data they share as the prediction input. Third, build a closed-loop optimization process covering "data - annotation - modeling - evaluation" to facilitate the rapid location of problems.
2. Materials and methods
2.1. Data collection and preprocessing
The data for this study is sourced from the Polygon platform, which offers trading data, fundamental data, news data, and a complete application programming interface (API). The constructed dataset possesses comprehensive and multi-dimensional characteristics.
The data collection covers the top 20 stocks in the United States from 2021 to the present (ranked by average daily trading volume, including highly volatile stocks such as SQQQ and TQQQ). This dataset is of sufficient scale, and the selected stocks have a strong correlation with the market, demonstrating good representativeness.
Data Cleaning: In the first step, duplication and imputation for missing values of all data types were conducted.
Feature Engineering: Common technical indicators were extracted from the time-series transaction data.
Time Alignment: This step is very important. Filter out dates that have both news and stock data, which will be used as the input data.
Dataset Splitting: Finally, the data were split into training (80%) and test (20%) sets. The division maintains time series continuity to avoid look-ahead risk.
2.2. Method of labeling sentiment labels for news
The innovation of this approach is to use Business-Driven Sentiment Labeling System to feed financial domain expertise into the sentiment analysis process. Financial events are classified into three big categories by businesses.
Macroeconomic Policy Category: Monetary policy (adjustment of interest rate/RRR). Fiscal policy (tax reduction, infrastructure investment). Economic indicator.
Micro-Subject Category: Corporate performance (company's revenue/profit exceed or decline from market expectations). Corporate behavior. Industry policy (subsidy, policy tightening of an industry).
Market Category: Stock market fluctuation (circuit breaker, 5% price fluctuation, explosive volume). Exchange rate fluctuation (RMB appreciation / depreciation, USD index rise / fall).
Sentiment Processing is a multi-stage mechanism on top of the text data.
1) Default Sentiment of the Text: Giving initial classification of the text tone.
2) Negation Word Rule: Grammatical rule to reverse negative (e.g. "performance not meeting expectations" will be reversed to negative sentiment).
3) Intensifier Weight: Adjusting sentiment scores by multiplying positive/negative weight (e.g. "significantly reduce RRR" will be given positive weight * 1.5).
4) Aggregation Logic: Summarizing scores of sentences into an article level score. In the case of a tie, "negative > positive > neutral" to reflect the fact that the market is generally risk-averse.
5) Business Calibration: Expert override to correct common-sense misjudgment on macro events (e.g. even the text looks neutral/negative, it should be corrected to negative by an expert for "Fed interest rate hike").
2.3. Model selected used in this study
Pro/DeepSeek-ai/DeepSeek-V3.1.
2.4. Model architecture and evaluation methods
2.4.1. Feature engineering and prediction targets
The feature set for the final prediction model is constructed by historical stock data and extracted news sentiment data.
Stock Data Features: Stock opening price, closing price on current day (the news release day). Historical stock data of last 3 days.
News Sentiment Features: Positive, Negative, Neutral, Anxious, Angry, Joyous.
2.4.2. Evaluation indicators
The technical solution of this part is to train and evaluate the system by above regression models to choose the best one for trend prediction. The regression models we choose are: Linear Regression, Ridge Regression, Lasso Regression, Random Forest Regressor, Gradient Boosting Regressor.
The feature set is standardized, and the models are trained on the training set (80%) and evaluated on the test set (20%).
We use multiple evaluation metrics to validate the model, including: R2 (coefficient of determination, it's used to describe the explained variance of the model), RMSE (root mean squared error), MAE (mean absolute error), MAPE (mean absolute percentage error). Select the model with most R2 [4] [5].
3. Experimental results and analysis
Comparative analysis between news and without news Model, we get three conclusions about how to integrate news sentiment to.
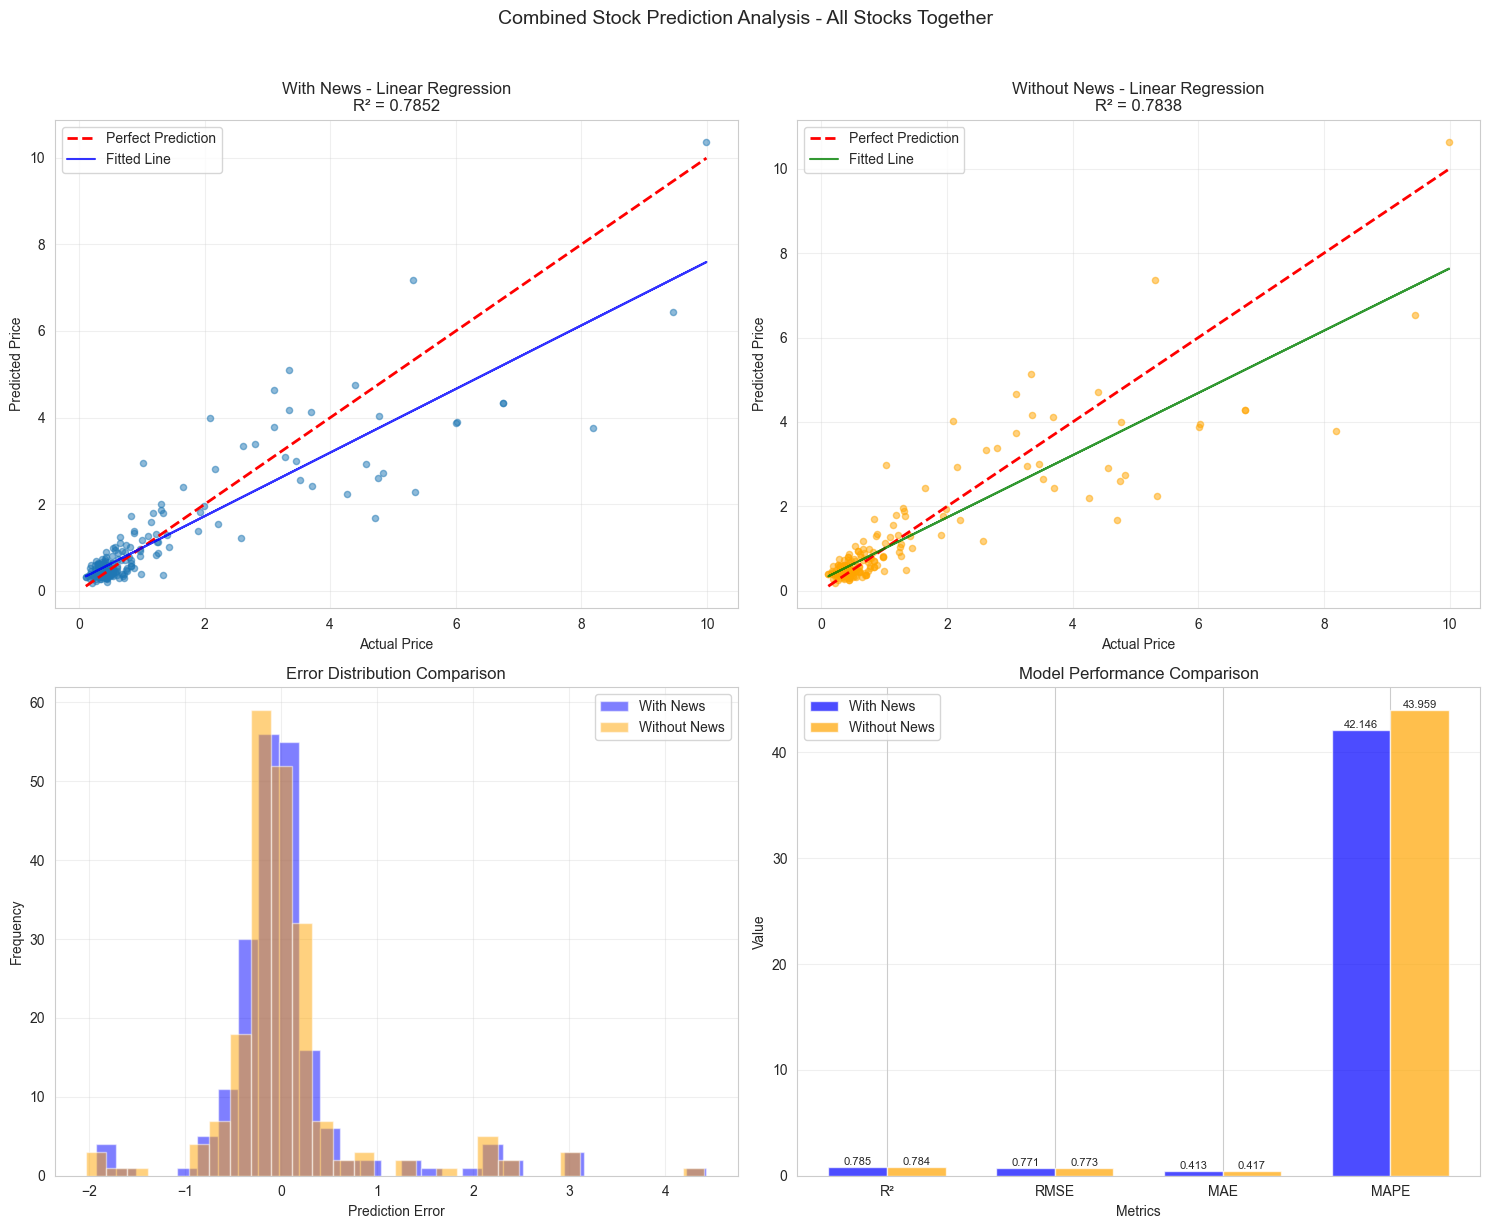
1) Sentiment Advantage: Compared with model without sentiment, model with sentiment always improves a lot in both direction accuracy and variance explained. It shows that the implicit information in financial news when they are professionally labeled, gives us very valuable information to predict stock trends, As shown in Figure 1.
2) According to Table 1, the performance improvement from feature of sentiment comes more when the scale of news data used to train is larger. It means that the ability to generalize and learn complex dependencies of the model is improved when applying a larger and more complex corpus of textual data. Among them, the sample size of SOXL is too small, and the model may not have fully learned the data features, thus resulting in poor performance. The results of XLF are speculated to be the reason for the mismatch between the selected news and its financial field.
|
Stock |
R2 |
RMSE |
MAE |
Samples |
|
SOXS |
0.8455 |
1.51 |
0.85 |
4 |
|
SQQQ |
0.8436 |
0.61 |
0.40 |
33 |
|
TQQQ |
0.6786 |
1.26 |
0.;94 |
27 |
|
SOXL |
0.2041 |
1.96 |
1.56 |
13 |
|
XLF |
-0.0740 |
0.23 |
0.17 |
126 |
3) According to Table 2, prediction of volatility is better than predicting average price change. Although the increase in R² for volatility prediction is small, when combined with financial scenarios, this improvement is still helpful for long-term trading accumulation.
|
Target |
Best Model |
R2 |
R2 Improvement |
RMSE |
RMSE Improvement |
|
Volaility |
Linear Regression |
0.7852 |
0.0014 |
0.7708 |
0.0033 |
|
Mean price |
Linear Regression |
0.9989 |
0.0000 |
0.8307 |
-0.0007 |
|
Clsoe price |
Linear Regression |
0.9970 |
0.0000 |
1.3766 |
-0.0070 |
|
Price change |
Linear Regression |
0.1301 |
-0.0056 |
3.1056 |
-0.0032 |
4. Conclusion
4.1. Research conclusions
We successfully constructed a new high performance stock trend prediction based on the integration of multidimensional financial data and business-driven news sentiment. We achieved three goals as below, which validated the effectiveness of our method.
Multi-Dimensional Data Adaptation. We achieved deep adaptation and fusion of multidimensional financial data, including transaction, fundamental and news data. The challenge is how to solve the temporal alignment problem and feature alignment problem.
Incorporate the news data into the stock prediction dataset to better utilize real-time information for market predictions, and verify the feasibility of this method by collecting open-source data.
\Large language models have been introduced as evaluation indicators for news sentiment, enabling sentiment analysis to no longer be confined to traditional algorithms. A set of effective prompt words has been summarized, which can be extended to different large language models for use
4.2. Future direction
In this study, we employed a method that combines news sentiment data with stock data to predict the market. However, from the experimental results, it can be seen that this approach does not significantly improve the algorithm's performance. We believe there are the following directions for improvement.
This evaluation of news metrics only utilized a single large model that had not undergone fine-tuning. Subsequent experiments can introduce new large models for comparison, or explore the fine-tuning direction of large models based on experimental results to achieve better prediction effects.
It can be seen from the data in Table 1 that this method works better for stocks with larger data volumes. Therefore, for companies with more frequent news predictions in the future, its accuracy may be improved. However, the situation where there are multiple news events in a day is also a scenario where we have not carried out complete work.
References
[1]. arXiv: 2412.19245 [q-fin.CP] https: //doi.org/10.48550/arXiv.2412.19245
[2]. arXiv: 2502.05186 [q-fin.ST] https: //doi.org/10.48550/arXiv.2502.05186
[3]. Allen, D. E., McAleer, M., & Singh, A. K. (2015, July). Daily market news sentiment and stock prices (Working Paper No. 1511). Instituto Complutense de Análisis Económico; Centre for Applied Financial Studies, University of South Australia; Department of Quantitative Finance, National Tsing Hua University. https: //www.ucm.es/fundamentos-analisis-economico2/documentos-de-trabajo-del-icae
[4]. Alanyali, M., Moat, H. S., & Preis, T. (2013). Quantifying the Relationship Between Financial News and the Stock Market. Scientific Reports, 3, 3578. https: //doi.org/10.1038/srep03578
[5]. Alanyali, M., Moat, H. S., & Preis, T. (2013). Quantifying the relationship between financial news and the stock market. Scientific Reports, 3(3578), 1-6. https: //doi.org/10.1038/srep03578
[6]. Gidófalvi, G. (2001, June 15). Using news articles to predict stock price movements [Working Paper]. Department of Computer Science and Engineering, University of California, San Diego.
[7]. Wu, S. T., Liu, Y. L., Zou, Z. R., & Weng, T. H. (2022). S_I_LSTM: Stock price prediction based on multiple data sources and sentiment analysis. Connection Science, 34(1), 44-62. https: //doi.org/10.1080/09540091.2021.1940101
[8]. Soni, P., Tewari, Y., & Krishnan, D. (2022). Machine Learning Approaches in Stock Price Prediction: A Systematic Review. Journal of Physics: Conference Series, 2161, 012065. https: //doi.org/10.1088/1742-6596/2161/1/012065
[9]. Singh, R., & Srivastava, S. (2016). Stock prediction using deep learning. Multimedia Tools and Applications, 76(11), 13373-13394. https: //doi.org/10.1007/s11042-016-4159-7
[10]. Obthong, M., Tantisantiwong, N., Jeamwatthanachai, W., & Wills, G. (n.d.). A Survey on Machine Learning for Stock Price Prediction: Algorithms and Techniques. Journal of Physics: Conference Series
[11]. arXiv: 2503.03612 [q-fin.ST] https: //doi.org/10.48550/arXiv.2503.03612
[12]. arXiv: 2410.07143 [q-fin.ST] https: //doi.org/10.48550/arXiv.2410.07143
[13]. Zhang, B., Yang, H. Y., Zhou, T., Babar, A., & Liu, X. Y. (2023). Enhancing financial sentiment analysis via retrieval augmented large language models. In Proceedings of the 4th ACM International Conference on AI in Finance (ICAIF 2023). arXiv: 2310.04027v2 [cs.CL].
[14]. Araci, D. (2019). FinBERT: Financial sentiment analysis with pre-trained language models [Master’s Thesis]. Faculty of Science, University of Amsterdam. arXiv: 1908.10063v1 [cs.CL].
[15]. arXiv: 2309.00618 [q-fin.TR] https: //doi.org/10.48550/arXiv.2309.00618
Cite this article
Zhang,T.;Wei,Z.;Wu,H.;Chang,Y. (2025). Experimental Research on Stock Trend Analysis Based on News Sentiment Labeling. Applied and Computational Engineering,207,61-66.
Data availability
The datasets used and/or analyzed during the current study will be available from the authors upon reasonable request.
Disclaimer/Publisher's Note
The statements, opinions and data contained in all publications are solely those of the individual author(s) and contributor(s) and not of EWA Publishing and/or the editor(s). EWA Publishing and/or the editor(s) disclaim responsibility for any injury to people or property resulting from any ideas, methods, instructions or products referred to in the content.
About volume
Volume title: Proceedings of CONF-SPML 2026 Symposium: The 2nd Neural Computing and Applications Workshop 2025
© 2024 by the author(s). Licensee EWA Publishing, Oxford, UK. This article is an open access article distributed under the terms and
conditions of the Creative Commons Attribution (CC BY) license. Authors who
publish this series agree to the following terms:
1. Authors retain copyright and grant the series right of first publication with the work simultaneously licensed under a Creative Commons
Attribution License that allows others to share the work with an acknowledgment of the work's authorship and initial publication in this
series.
2. Authors are able to enter into separate, additional contractual arrangements for the non-exclusive distribution of the series's published
version of the work (e.g., post it to an institutional repository or publish it in a book), with an acknowledgment of its initial
publication in this series.
3. Authors are permitted and encouraged to post their work online (e.g., in institutional repositories or on their website) prior to and
during the submission process, as it can lead to productive exchanges, as well as earlier and greater citation of published work (See
Open access policy for details).
References
[1]. arXiv: 2412.19245 [q-fin.CP] https: //doi.org/10.48550/arXiv.2412.19245
[2]. arXiv: 2502.05186 [q-fin.ST] https: //doi.org/10.48550/arXiv.2502.05186
[3]. Allen, D. E., McAleer, M., & Singh, A. K. (2015, July). Daily market news sentiment and stock prices (Working Paper No. 1511). Instituto Complutense de Análisis Económico; Centre for Applied Financial Studies, University of South Australia; Department of Quantitative Finance, National Tsing Hua University. https: //www.ucm.es/fundamentos-analisis-economico2/documentos-de-trabajo-del-icae
[4]. Alanyali, M., Moat, H. S., & Preis, T. (2013). Quantifying the Relationship Between Financial News and the Stock Market. Scientific Reports, 3, 3578. https: //doi.org/10.1038/srep03578
[5]. Alanyali, M., Moat, H. S., & Preis, T. (2013). Quantifying the relationship between financial news and the stock market. Scientific Reports, 3(3578), 1-6. https: //doi.org/10.1038/srep03578
[6]. Gidófalvi, G. (2001, June 15). Using news articles to predict stock price movements [Working Paper]. Department of Computer Science and Engineering, University of California, San Diego.
[7]. Wu, S. T., Liu, Y. L., Zou, Z. R., & Weng, T. H. (2022). S_I_LSTM: Stock price prediction based on multiple data sources and sentiment analysis. Connection Science, 34(1), 44-62. https: //doi.org/10.1080/09540091.2021.1940101
[8]. Soni, P., Tewari, Y., & Krishnan, D. (2022). Machine Learning Approaches in Stock Price Prediction: A Systematic Review. Journal of Physics: Conference Series, 2161, 012065. https: //doi.org/10.1088/1742-6596/2161/1/012065
[9]. Singh, R., & Srivastava, S. (2016). Stock prediction using deep learning. Multimedia Tools and Applications, 76(11), 13373-13394. https: //doi.org/10.1007/s11042-016-4159-7
[10]. Obthong, M., Tantisantiwong, N., Jeamwatthanachai, W., & Wills, G. (n.d.). A Survey on Machine Learning for Stock Price Prediction: Algorithms and Techniques. Journal of Physics: Conference Series
[11]. arXiv: 2503.03612 [q-fin.ST] https: //doi.org/10.48550/arXiv.2503.03612
[12]. arXiv: 2410.07143 [q-fin.ST] https: //doi.org/10.48550/arXiv.2410.07143
[13]. Zhang, B., Yang, H. Y., Zhou, T., Babar, A., & Liu, X. Y. (2023). Enhancing financial sentiment analysis via retrieval augmented large language models. In Proceedings of the 4th ACM International Conference on AI in Finance (ICAIF 2023). arXiv: 2310.04027v2 [cs.CL].
[14]. Araci, D. (2019). FinBERT: Financial sentiment analysis with pre-trained language models [Master’s Thesis]. Faculty of Science, University of Amsterdam. arXiv: 1908.10063v1 [cs.CL].
[15]. arXiv: 2309.00618 [q-fin.TR] https: //doi.org/10.48550/arXiv.2309.00618