


1. Introduction
Forest fires have a great impact on the ecological environment, economy and society, and are serious natural disasters. Timely and accurate monitoring and evaluation of forest fires is of great significance to fire prevention, fire extinguishing and post-disaster recovery. The development of remote sensing technology has provided strong support for the monitoring and evaluation of forest fires, and many scholars have conducted relevant research using multi-source remote sensing data and machine learning algorithms. At present, there are a variety of mature forest fire monitoring methods to choose from, such as research using satellite emotion sensor data.
Chéret and Denux [1] studied MODIS Terra images from 2000 to 2006 and analyzed its NDVI time series. The sensitivity of forest fires in the Mediterranean region was measured, and a method based on vegetation phenomenological analysis was proposed to draw vegetation status indicators for fire hazard maps. By verifying the correlation between these indicators and meteorological conditions, relevant conclusions have been drawn.Then, Wang Qiankun et al. [2] based on time series remote sensing data, used the object-oriented method to extract burned areas, and achieved the rapid extraction of forest burned areas by analyzing the spectral and texture characteristics of remote sensing data at different times. After that, Liu Yixian et al. [3] used Sentinel - 2 satellite data to explore the recognition potential of typical vegetation indices, principal component analysis, decision trees, and improved typical vegetation indices fused with red-edge bands, and random forest classification methods for burned areas, and found that NDVI and mSRreledge were the best vegetation indices for separating trees of different damage degrees in the study area. Modern researches also based on UAV remote sensing data, like Cui Zhongyao et al. [4] used the DJI Phantom 4 multispectral UAV to obtain fire scene images, combined with single-band spectral information, vegetation indices, and texture features, and used SVM and RF for comparative research. They found that among the methods for extracting the degree of damage to trees by integrating 5 single-band features, 3 vegetation indices, and 20 texture features, the RF classifier had better effects. Besides, Avazov et al. [5] proposed a forest fire detection and notification method based on the Internet of Things and artificial intelligence, used the YOLOv5 network to detect fires in real time, and combined with IoT devices to verify fires, improving the accuracy and timeliness of fire detection.
Nowadays, the popular methods of assessment of forest fire severity include those based on multispectral UAV and machine Learning, as Cui Zhongyao et al. have done in 2024. By analyzing the spectral characteristics of damaged trees, they found that NDVI and mSRreledge were the best vegetation indices for separating trees of different damage degrees in the study area. Among the methods for extracting the degree of damage to trees by integrating multiple features, the classification results of the RF classifier were significantly better than those of the SVM classifier. Moreover, through remote sensing image features, Li Mingze et al. [6], combined with DEM and forest phase map data, used indices such as the difference normalized burned ratio to establish a decision tree model to divide the overburned area in the Huzhong Forest Area of Daxing'anling into different levels of fire severity. Rao Yueming et al. [7] also combined multi-source remote sensing data to monitor the forest fire in Muli County, Sichuan Province, and used the maximum inter-class variance algorithm to determine the burned areas and areas of different degrees in steps.
To assess the losses of forest fire, including forest area loss, changes in vegetation coverage, etc., Dai Weixu [8] used multi-source remote sensing data, including Landsat, Sentinel - 2, and GF - 2. Similarly, Liu Yixian et al. by extracting the image features of multiple spectral bands, explored the method of accurately and quickly extracting the information of the degree of damage to trees after the fire, providing an important basis for the assessment of forest fire losses. While Huang Chaoyu et al. [9] employed machine learning algorithms such as the Decision Tree Classification method, Support Vector Machine, and Random Forest to classify and identify the degree of damage to trees after a forest fire, and discovered that the Decision Tree Classification method had the highest accuracy.
In conclusion, remote sensing technology plays an important role in forest fire monitoring, severity assessment, and loss assessment. The integration of multi-source remote sensing data and the application of machine learning algorithms have improved the accuracy and efficiency of forest fire monitoring and assessment. However, the current research still has some limitations, such as the timeliness of data acquisition, the accuracy and applicability of the algorithms, etc.
2. Methodology
2.1. Case study
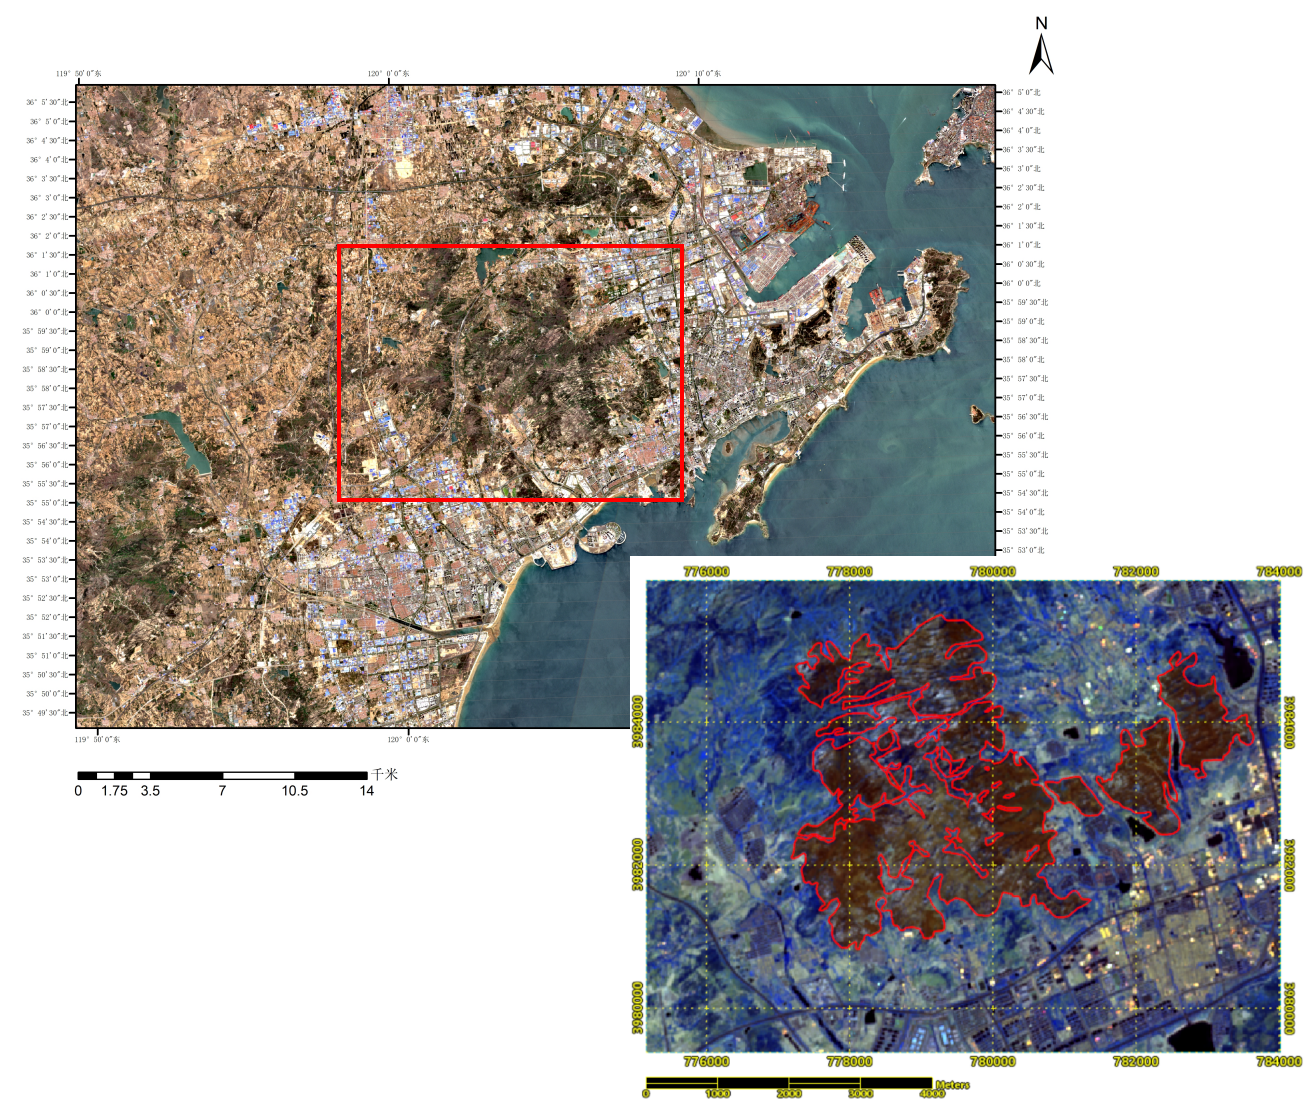
In the study, previous case studies of many cases of forest fire have been read and a typical one, Xiaozhushan Mountain, has been selected to use in the study in the dissertation. Xiaozhushan Mountain is located in the West Coast New Area of Qingdao City, Shandong Province. Its approximate latitude and longitude range is 35°92′N to 35°98′N and 120°05′E to 120°15′E. Qingdao experiences a temperate monsoon climate, moderated by the ocean. It is characterized by distinct seasons, mild temperatures year-round with small temperature differences, moderate precipitation, and frequent winds and fog in spring and summer. Xiaozhushan Mountain is an important mountain range in the central part of the West Coast New Area. With an altitude of 724.9 meters, it has a variety of vegetation and many rocky mountains [10]. While on the afternoon of April 23, 2020, a mountain fire suddenly broke out in Xiaozhushan Mountain. The area affected by the forest fire in was 1285.26 hectares (of which the damaged forest area was 86.78 hectares), reaching a damage proportion of about 2.48%. Many trees were burned in the fire, and the forest coverage rate decreased. This not only led to the direct loss of timber resources but also affected the ecological functions of the forest. The functions of trees such as carbon sequestration, oxygen release, and soil and water conservation were greatly weakened. At the same time, the mountain fire turned a large amount of vegetation into ashes, and the vegetation coverage decreased sharply. The originally dense forest became sparse. The reduction of ground vegetation made the soil directly exposed, which easily caused problems such as soil erosion. As an important landmark mountain in the local area, Xiaozhushan Mountain's beautiful natural landscape attracts many tourists and residents [11]. The mountain fire seriously damaged the originally lush forest, which greatly affected the landscape aesthetic value of Xiaozhushan Mountain and lead to damage to the local tourism resources and image.
2.2. Data source
The data used in this study is Sentinel-2 data, downloaded from ESA(European Space Agency).
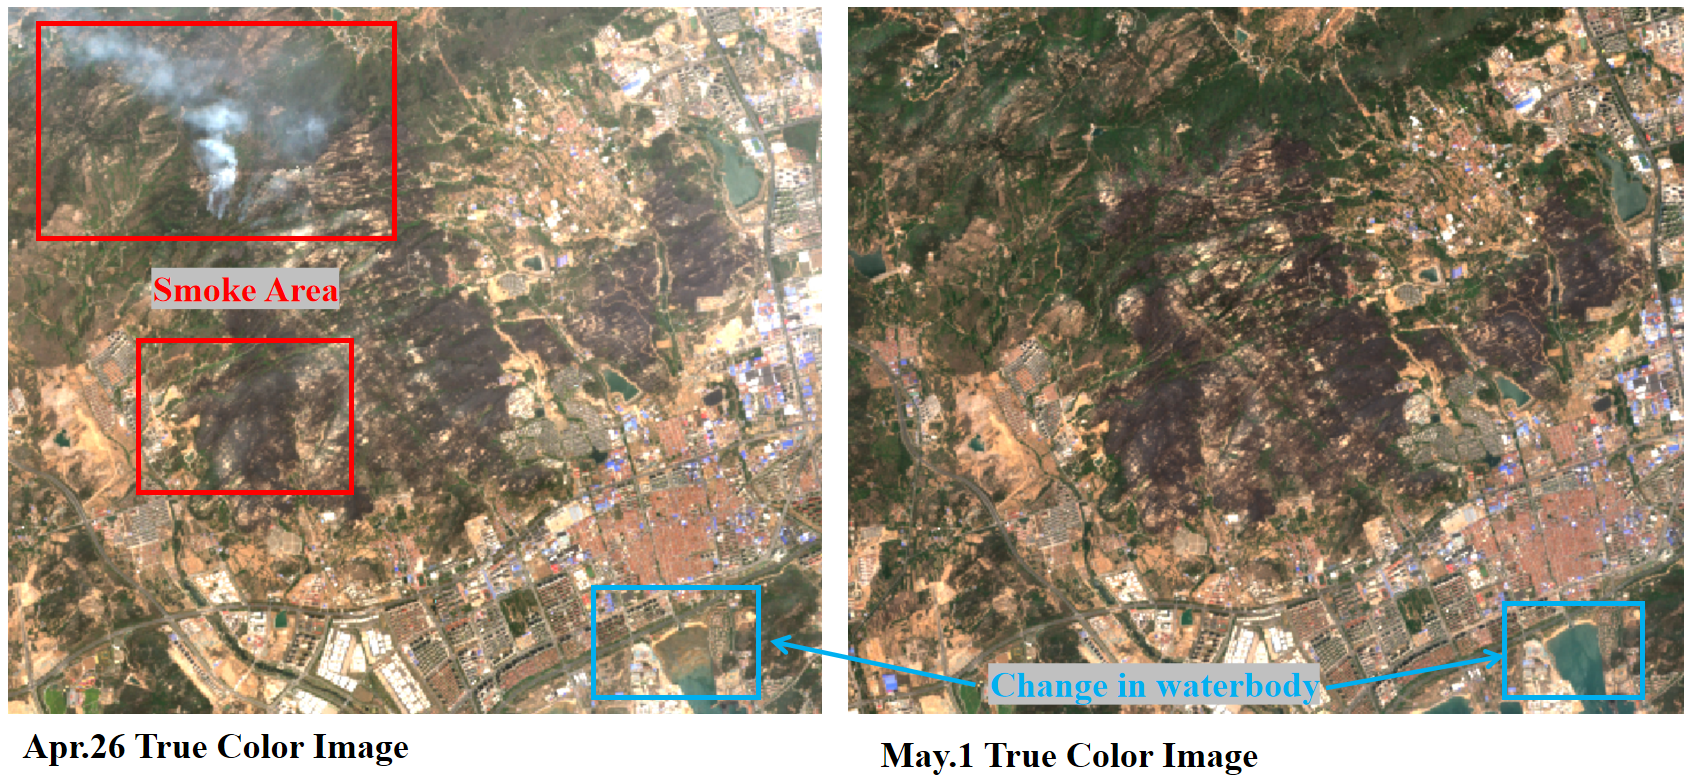
The L2A images from the ESA website(https://browser.dataspace.copernicus.eu/) have been atmospherically and radiometrically corrected. They are selected before and after the fire on April 21st, April 26th, and May 1st, respectively. Selected images are largely cloud-free within the study area. A total of 13 bands are acquired, all of which are used at 20m resolution in this study. The following is the basic information of images used in the study:
|
Date |
Product |
Description |
|
Apr.21 |
L2A,20m |
Image taken before fire |
|
Apr.26 |
L2A,20m |
Image taken after fire, with smoke area on image |
|
May.1 |
L2A,20m |
Image taken after fire, with water body change on image |
|
Sentinel-2 Bands |
Sentinel-2A |
Sentinel-2B |
|||
|
Central wavelength(nm) |
Bandwidth(nm) |
Central wavelength(nm) |
Bandwidth(nm) |
Spatial resolution |
|
|
Band1-Coastal aerosol |
442.7 |
21 |
442.2 |
21 |
60 |
|
Band2-Blue |
492.4 |
66 |
492.1 |
66 |
10 |
|
Band3-Green |
559.8 |
36 |
559.0 |
36 |
10 |
|
Band4-Red |
664.6 |
31 |
664.9 |
31 |
10 |
|
Band5-Vegetation red edge |
704.1 |
15 |
703.8 |
16 |
20 |
|
Band6-Vegetation red edge |
740.5 |
15 |
739.1 |
15 |
20 |
|
Band7-Vegetation red edge |
782.8 |
20 |
779.7 |
20 |
20 |
|
Band8-NIR |
832.8 |
106 |
832.9 |
106 |
10 |
|
Band8A-Narrow NIR |
864.7 |
21 |
864.0 |
22 |
20 |
|
Band9-Water vapour |
945.1 |
20 |
943.2 |
21 |
60 |
|
Band10-SWIR-Cirrus |
1373.5 |
31 |
1376.9 |
30 |
60 |
|
Band11-SWIR |
1613.7 |
91 |
1610.4 |
94 |
20 |
|
Band12-SWIR |
2202.4 |
175 |
2185.7 |
185 |
20 |
2.3. Data preprocessing
Due to the large coverage of the downloaded data, band synthesis and image cropping were performed. 4 bands are chosen including Band4-RED, Band8A-NarrowNIR, Band11-SWIR, Band12-SWIR
2.4. Indicators for the validation of fire trails
There are many methods to identify post-fire trails from remote sensing images, and the methods are mainly based on the changes in band reflectance before and after the disaster and the differences in band reflectance between the affected area and other areas. Because the chlorophyll content of the vegetation in the fire burned area is obviously reduced compared with the healthy vegetation, and the reduction of chlorophyll will cause significant changes in the wavelengths of the corresponding bands. Therefore, it is possible to reflect the change by the difference between the indices of the images before and after the fire.
Here are some index of sensitivity to burned areas and their formula we used in the study:
|
Indicators for the validation of fire trails |
Formula |
|
Normalized Burned Ratio [12] |
|
|
Normalized Burned Ratio2 [13] |
|
|
Normalized Difference Vegetation Index [14] |
|
|
Burned Area Index [15] |
NDVI is a typical vegetation factor that is most commonly used. It is useful for studying the health status of vegetation. As vegetation cover decreases, so does the NDVI value, Therefore, the NDVI index of vegetation after a fire is expected to decrease significantly.
The BAI index is calculated based on the distance between the pixel value of the ground object and the reference spectral value, where the reference value for the near-infrared band is 0.06, and the reference value for the reflectance of the red band is 0.1 [16]. It can be used to indicate the strength of the charcoal signal in the burn scar.
NBR and NBR2, utilizing the characteristics of spectral reflectance of burn scars in post-disaster images, which shows a decrease in the near-infrared band and an increase in the shortwave infrared band, can distinguish burn scars from other objects.
Four vegetation indices were used to extract and analyze images before and after the fire, and the difference between the vegetation indices of the before and after images was calculated. Finally, the histogram threshold method was applied to the resulting images, and the optimal segmentation threshold was selected through multiple experiments to extract the burn scars.
2.5. Supervised classification
Support Vector Machine (SVM) [17] is a binary classification model, whose basic model is a linear classifier that defines the largest margin in the feature space. The vectors closest to the optimal classification hyperplane are called Support Vectors (SVs) [18]. The fundamental idea is to solve for a separating hyperplane that can correctly divide the training dataset and has the largest geometric margin. The advantages of SVM lie in its ability to address machine learning problems with small sample sizes, without relying on the entire dataset. However, its drawbacks include relatively low efficiency when dealing with a large number of observed samples and the lack of a universal solution for nonlinear problems.
For the SVM classification model, this study selects the penalty coefficient C and the coefficient γ of the Radial Basis Function (RBF) kernel as the tuning parameters. The penalty coefficient C represents the coefficient of the slack variable, which primarily balances the relationship between model complexity and misclassification rate in the optimization function. As the penalty coefficient C increases, the loss function also increases, causing even distant outliers to be included by the algorithm, resulting in a more complex model with support vectors and hyperplanes, ultimately leading to overfitting and poorer model generalization ability. Conversely, a smaller C value results in fewer outliers being included in the model, with more samples serving as support vectors, ultimately leading to a simpler model with hyperplanes and support vectors. The coefficient γ of the RBF kernel primarily defines the influence range of a single sample on the entire classification hyperplane. When γ is small, a single sample has a relatively far-reaching influence on the entire classification hyperplane and is more likely to be selected as a support vector. In contrast, when γ is large, a single sample has a closer influence distance on the entire classification hyperplane, making it less likely to be selected as a support vector, resulting in fewer support vectors for the entire model and a more complex model.
Neural Net Classification is a machine learning technique that leverages neural networks to categorize input data into distinct classes. It operates by constructing a network architecture composed of multiple neurons, interconnected through weighted links that mimic the learning, recognition, and classification processes of the human brain. These neurons process input signals, applying activation functions to introduce non-linearity, and adjust their weights through optimization algorithms such as gradient descent to minimize a loss function that quantifies the discrepancy between the network's output and the true labels. The trained neural network can then be applied to classify unseen data, demonstrating its adaptability and generalization capabilities. However, challenges like overfitting, computational complexity, and lack of interpretability need to be addressed in practical applications.
This study tunes this method using following parameters: Training Threshold Contribution: adjusts internal node weights for better classification, avoiding overfitting with high values. Training Rate: Controls weight adjustment speed (0~1), higher values speed up training but risk oscillation. Training Momentum: A value (0~1) that stabilizes training at high rates, promoting weight changes in the same direction. Training RMS Exit Criteria: Specifies RMS error threshold to stop training early if achieved, even before max iterations. Number of Hidden Layers: Determines model complexity for linear (0) or nonlinear classification (≥1). Number of Training Iterations: Sets the maximum number of training cycles.
2.6. Extraction of the reference truth value
This study mainly focuses on the high-resolution false-color images of the fire-burned area, supplemented by Google Earth images, to visually interpret the burned area. The interpretation results are shown in the figure. The burned pixels are marked as 1, and the unburned pixels are marked as 0, thereby establishing a target variable dataset.
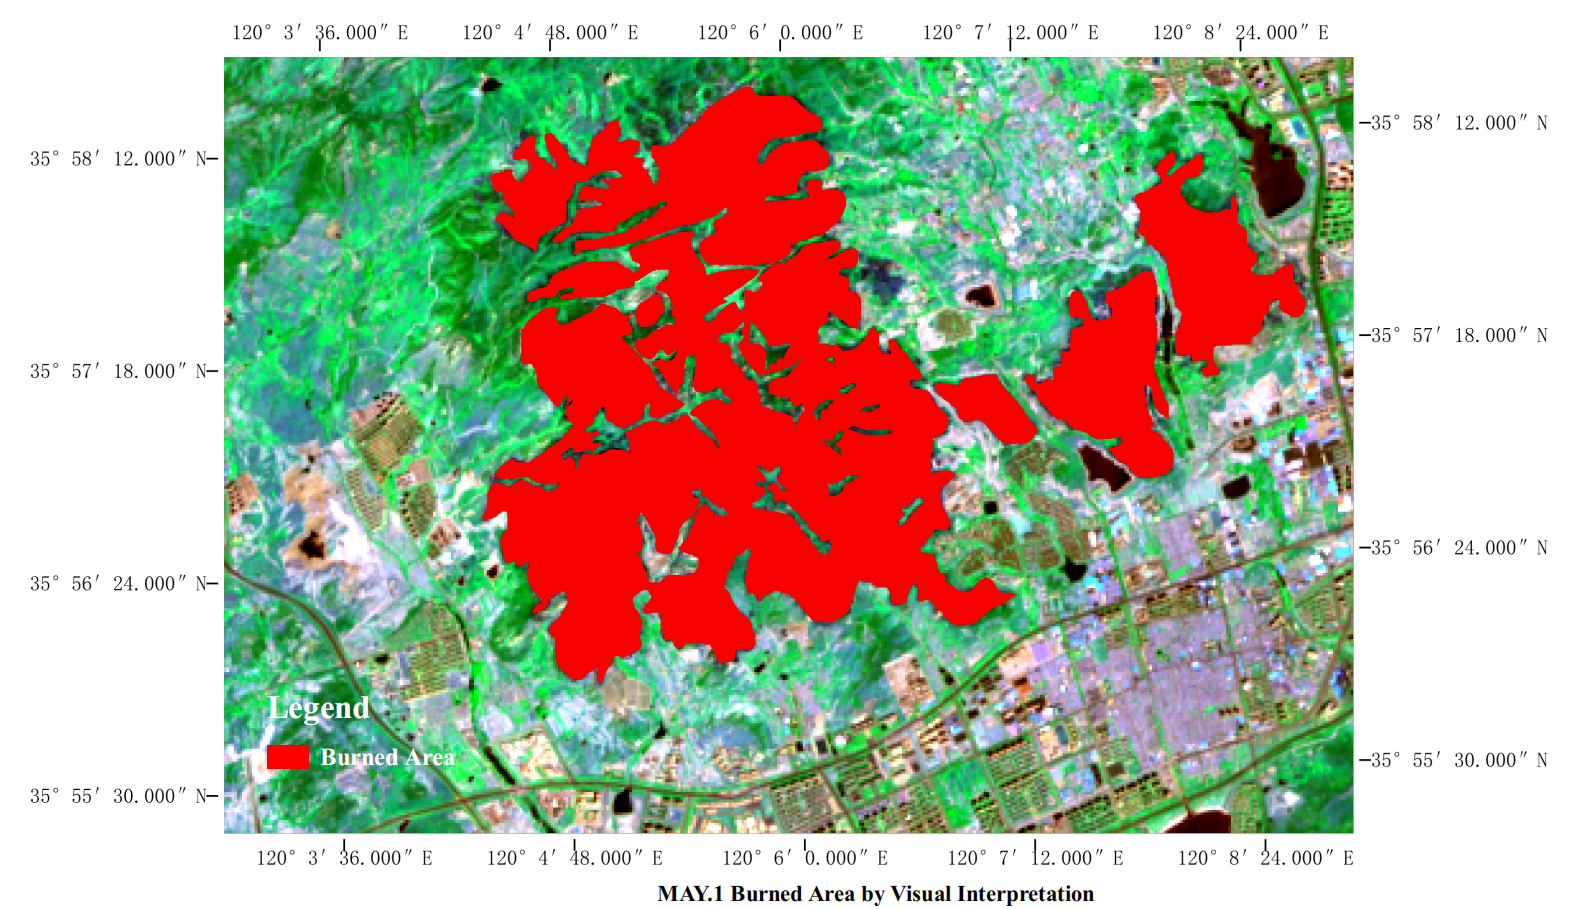
It can be seen from the figure that healthy vegetation and damaged vegetation can be quite intuitively distinguished from the image. Therefore, visual interpretation can obtain a very accurate range of the burned area, providing reference truth for the subsequent algorithm recognition and data support for the automatic identification of the burned area.
2.7. Accuracy assessment
The identified burn scars can typically be validated using ground truth data and visual interpretation results of remote sensing data. Due to the difficulty in acquiring ground truth data, this study relied on visual interpretation results as the reference truth to validate the burn scar identification results. The overall accuracy and Kappa coefficient were used to evaluate the overall identification performance of each method.
Overall Accuracy (OA) is a probabilistic statistical measure used to quantify the degree of agreement between classified results and actual types. It represents the proportion of correctly classified samples among all randomly selected samples, reflecting the accuracy of classification results.
The formula for Overall Accuracy is:
Where p_ii represents the diagonal elements in the confusion matrix, i.e., the number of samples correctly classified into class i; p_ij represents the elements in the confusion matrix, i.e., the number of samples that are actually in class i but classified as class j; n is the total number of classes. Overall Accuracy provides an intuitive measure of the accuracy of classification results.
However, Overall Accuracy can be influenced by uneven sample distribution. In cases where certain classes dominate, even if the classification accuracy for these classes is not high, Overall Accuracy may still be relatively high.
The Kappa Coefficient [19] is a metric used to quantify the accuracy of classification, based on the confusion matrix. It is commonly used for consistency testing. The Kappa Coefficient considers not only the correctness of classification but also its randomness, providing a more comprehensive assessment of classification accuracy. By comparing observed results with random results, the Kappa Coefficient offers a relatively objective measure of classification accuracy. The value of the Kappa Coefficient typically ranges from 0 to 1, allowing for the classification accuracy to be graded into different levels, such as very low consistency, fair consistency, moderate consistency, high consistency, and almost perfect consistency. Normally, when 0.60≤K≤0.80, the accuracy is high and when 0.80≤K≤1.00, the accuracy is very high(near complete agreement)
The formula for the Kappa Coefficient can be expressed as:
In the formula, K represents the Kappa Coefficient, r is the number of rows in the confusion matrix, X_ii is the value on the i-th row and i-th column (main diagonal), X_i+ and X_+i are respectively the sum of the i-th row and the i-th column, and N is the total number of samples. The calculation of pe typically involves some normalization of the product sum of the true and predicted sample counts for each class.
It should be stressed that the staple difference between the Kappa coefficient and the overall accuracy is that the overall accuracy only considers the number of pixels located on the diagonal, while the Kappa coefficient considers not only the pixels correctly classified on the diagonal, but also various missing points and mismarking errors that are not on the diagonal.
3. Analysis of results

|
Method |
Apr.26 |
May.1 |
||
|
Overall Accuracy |
Kappa |
Overall Accuracy |
Kappa |
|
|
NDVI |
88.9048% |
0.6553 |
90.9262% |
0.7011 |
|
BAI |
90.8810% |
0.7133 |
95.1043% |
0.8552 |
|
NBR1 |
92.1417% |
0.7546 |
94.6720% |
0.8333 |
|
NBR2 |
94.5270% |
0.8383 |
94.9887% |
0.8487 |
|
Support Vector Machine |
91.2196% |
0.7152 |
94.5673% |
0.8303 |
|
Neural Net Classification |
90.7244% |
0.6923 |
93.5625% |
0.7896 |
In our research, we mainly use Overall Accuracy (OA) and kappa Coefficient(K) to assess the accuracy of results.
Overall accuracy (OA) refers to the proportion of the number of correct classifications to the total number of samples. The higher OA is, the better the model works.
Kappa coefficient is also an index to measure classification accuracy, which is used to evaluate whether the model prediction is consistent with the actual category.
We can notice that the accuracy of May.1 is pretty satisfying, as most of methods are high in two index, while the accuracy of Apr.26 is a bit lower. We analyze the difference between images of these two days, finding that more clouds and fog are in the image of Apr.26, greatly influence the accuracy. What's more, there is also tide water found in this area which tide rose on Apr.26 and fell on Mar.1. As water interference classification, it also causes inaccuracy. However, though such factors, the accuracy of NBR2 only fluctuate within a small range between two days and it works well in anti-jamming. And BAI works well as well, though its accuracy fluctuates a little bit wider than NBR2's, it is satisfying enough comparing others. The order traditional methods (NDVI NBR) are all work not so good as NBR2 and BAI and the accuracy of NDVI method is the lowest one in both two days. And when it comes to the methods of machine learning (SVM and NNC), surprisingly, they don't show any superiority against traditional methods which may be related to data set.
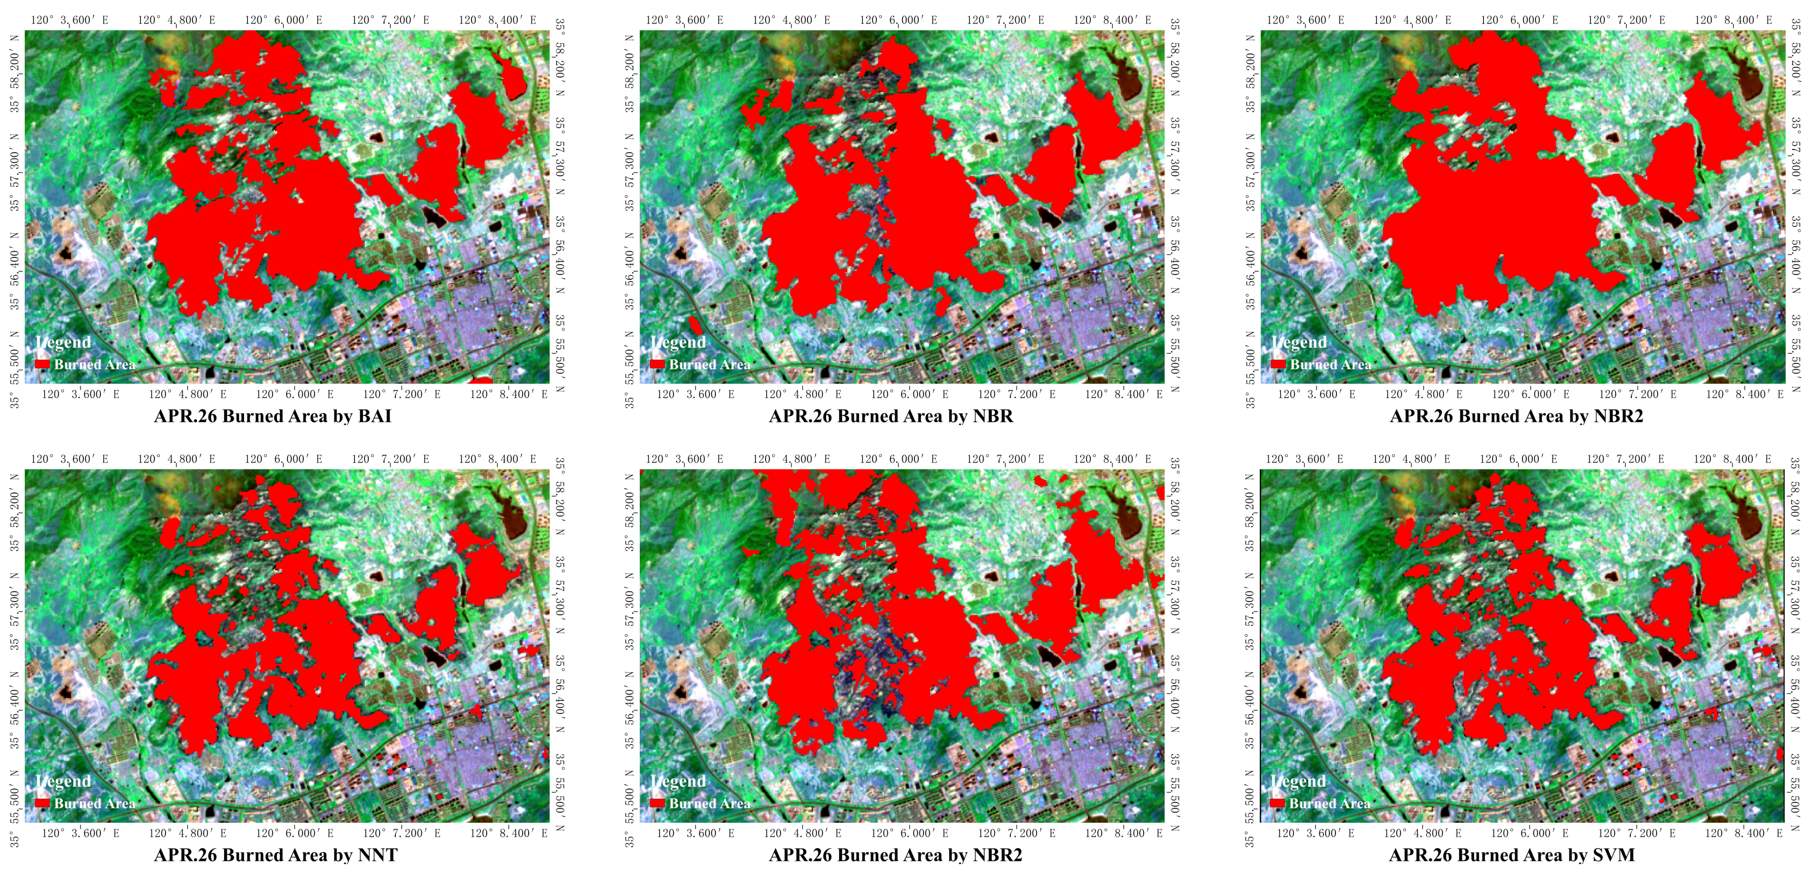
The result of identification map sheet also confirms the accuracy analyze, the result of BAI and NBR2 obviously resemble the map of visual interpretation while others show difference big or small.
4. Conclusion
In the realm of remote sensing and environmental monitoring, the Normalized Burn Ratio 2 (NBR2) has emerged as a robust indicator, demonstrating high accuracy in distinguishing fire-affected areas. Its classification consistency is commendable, ensuring reliable and repeatable results across different time frames. One of its key advantages lies in its resilience to interference from smoke, which can often obfuscate other indices and compromise their accuracy. In contrast, the Normalized Difference Vegetation Index (NDVI), while widely used, performs significantly poorer under smoky conditions, underscoring the limitations it faces in certain environments. The accuracy of NDVI is also affected by the growth of plants.
When comparing traditional vegetation index analysis methods with supervised classification techniques, both approaches exhibit comparable levels of accuracy in classifying land cover types. However, a closer inspection reveals that while the accuracy is similar, the consistency of supervised classification, especially when dealing with complex or variable landscapes, tends to be slightly inferior. This is due to the fact that supervised classification relies heavily on a training dataset that may not fully capture the intricacies and variations of the entire study area.
A notable observation is that the outcomes of traditional vegetation index analysis methods are inherently influenced by changes in water area, as these changes will cause fluctuations in the spectral information received by the sensor.. This sensitivity to water dynamics can lead to inaccuracies or misclassifications, especially in regions experiencing significant fluctuations in water levels or extent. In this study, the difference between a low tide and a high tide caused inaccuracies. In contrast, supervised classification proves to be impervious to such changes, offering a more stable and reliable classification performance.
Within the realm of supervised classification, the Support Vector Machine (SVM) has shown to outperform neural network-based approaches. SVM's ability to handle high-dimensional data, combined with its robustness to outliers and noise, makes it an ideal choice for complex classification tasks. Additionally, SVM's kernel functions enable it to capture nonlinear relationships between features, leading to more accurate and nuanced classifications. In contrast, neural networks, while powerful, can be prone to overfitting and require larger datasets and more computational resources to achieve comparable results.
Acknowledgement
Zhiyuan Zhao, Yiting Liu, Wenyang Li and Zhiyao Wu contributed equally to this work and should be considered co-first authors.
References
[1]. Chéret, V. and Denux, J.-P. (2011) 'Analysis of MODIS NDVI Time Series to Calculate Indicators of Mediterranean Forest Fire Susceptibility’, GIScience & Remote Sensing, 48(2), pp. 171–194. doi: 10.2747/1548-1603.48.2.171.
[2]. WANG Qiankun, YU Xinfang, and SHU Qingtai. (2017). Forest burned scars area extraction using time series remote sensing data. Journal of Natural Disasters, 26(1), 1 - 10. (in Chinese)
[3]. Liu, Y.X., Zhang, J., Tang, Y., et al. (2023) 'Comparative Study of Rapid Extraction Methods of Burned Area Based on Sentinel-2 Images’, Forest Inventory and Planning, 48(6), pp.1-6. doi: 10. 3969/ j. issn. 1671-3168. 2023. 06. 001
[4]. Cui, Z.Y., Zhao, F.J., Zhao, S. et al. 'Research on information extraction of forest fire damage based on multispectral UAV and machine learning', Journal of Natural Disasters, 2024, 33(01): 99-108.DOI: 10.13577/j.jnd.2024.0109.
[5]. Avazov, K., Hyun, A. E., Sami, S. A. A., Khaitov, A., Abdusalomov, A. B., & Cho, Y. I. (2023). Forest Fire Detection and Notification Method Based on AI and IoT Approaches. Future Internet, 15(2), 61. https: //doi.org/10.3390/fi15020061.
[6]. LI, M. Z., KANG, X. R., & FAN, W. Y. (2017). Burned area extraction in Huzhong forests based on remote sensing and the spatial analysis of the burned severity. Scientia Silvae Sinicae, 53(3), 163–174.
[7]. Rao, Y. M. (2020). Research on Forest Fire Monitoring and Canopy Water Content Inversion Method of Burned Area Based on Multi-source Remote Sensing Data [D/OL]. Beijing Forestry University.
[8]. Dai, W. X., Zhu, T., Wu, T., Zhu, Y. J., & Chen, K. W. (2024). Forest Fire Loss Assessment Based on Multi-Source Remote Sensing Data. Technology Innovation and Application, 24, 10 - 14.
[9]. Huang, C.Y. (2023) 'Burned Area Mapping and Fire Severity Analyse of Muli Forest Fire Based on Remote Sensing Images and Multiple Machine Learning Algorithms’, doi: 0.27345/d.cnki.gsnyu.2023.000873
[10]. Zhao Shumei, Zheng Xilai, ** Lingling and Zhang Xiaohui, 2006. Study on the Water Environmental Capacity of Xiaozhushan Reservoir in Qingdao. Journal of Ocean University of China: Natural Science Edition, 36(6), pp. 971 - 974.
[11]. Wang Yao. (2016). Yingke Center of Vanke Xiaozhushan in Qingdao. Architecture Technique, 8, 58 - 63. DOI: 10.3969/j.issn.1674 - 6635.2016.08.009.
[12]. Key, C. H., & Benson, N. C. (1999). The normalized burn ratio (NBR): A landsat TM radiometric measure of burn severity. Bozeman, MT: United States Geological Survey, Northern Rocky Mountain Science Center.
[13]. Lutes, D. C., Keane, R. E., Caratti, J. F., et al. (2006). FIREMON: Fire effects monitoring and inventory system. Colorado: US Department of Agriculture, Forest Service, Rocky Mountain Research Station.
[14]. Stroppiana, D., Boschetti, M., Zaffaroni, P., et al. “Analysis and interpretation of spectral indices for soft multicriteria burned-area mapping in Mediterranean regions.” IEEE Geoscience Remote Sensing Letters, vol. 6, 2009, pp. 499–503.
[15]. Chuvieco, E., Martín, M. (1998). 'Cartografía de grandes incendios forestales en la Península Ibérica a partir de imágenes NOAA-AVHRR’, Serie Geográfica, 7, pp.109–128.
[16]. Chuvieco, E., Martín, M.P. and Palacios, A. (2002) 'Assessment of different spectral indices in the red-near-infrared spectral domain for burned land discrimination’, International Journal of Remote Sensing, 23(23), pp. 5103–5110. doi: 10.1080/01431160210153129.
[17]. Joachims T. SVMLight: Support Vector Machine [J]. 1999. .
[18]. Jiang, X., Lu, W. X., Yang, Q. C., et al. Evaluation of soil environmental quality by applying support vector machine [J]. China Environmental Science, 2014, 34(5): 1229-1235.
[19]. Kraemer, H.C. (2015) 'Kappa coefficient’, Wiley StatsRef: Statistics Reference Online, pp. 1–4. doi: 10.1002/9781118445112.stat00365.pub2.
Cite this article
Zhao,Z.;Liu,Y.;Li,W.;Wu,Z. (2025). Extraction of Forest Fire Scars Based on Sentinel-2 Data — Take Xiaozhushan Mountain Fire Apr.23 2020 as an Example. Applied and Computational Engineering,208,69-79.
Data availability
The datasets used and/or analyzed during the current study will be available from the authors upon reasonable request.
Disclaimer/Publisher's Note
The statements, opinions and data contained in all publications are solely those of the individual author(s) and contributor(s) and not of EWA Publishing and/or the editor(s). EWA Publishing and/or the editor(s) disclaim responsibility for any injury to people or property resulting from any ideas, methods, instructions or products referred to in the content.
About volume
Volume title: Proceedings of the 5th International Conference on Materials Chemistry and Environmental Engineering
© 2024 by the author(s). Licensee EWA Publishing, Oxford, UK. This article is an open access article distributed under the terms and
conditions of the Creative Commons Attribution (CC BY) license. Authors who
publish this series agree to the following terms:
1. Authors retain copyright and grant the series right of first publication with the work simultaneously licensed under a Creative Commons
Attribution License that allows others to share the work with an acknowledgment of the work's authorship and initial publication in this
series.
2. Authors are able to enter into separate, additional contractual arrangements for the non-exclusive distribution of the series's published
version of the work (e.g., post it to an institutional repository or publish it in a book), with an acknowledgment of its initial
publication in this series.
3. Authors are permitted and encouraged to post their work online (e.g., in institutional repositories or on their website) prior to and
during the submission process, as it can lead to productive exchanges, as well as earlier and greater citation of published work (See
Open access policy for details).
References
[1]. Chéret, V. and Denux, J.-P. (2011) 'Analysis of MODIS NDVI Time Series to Calculate Indicators of Mediterranean Forest Fire Susceptibility’, GIScience & Remote Sensing, 48(2), pp. 171–194. doi: 10.2747/1548-1603.48.2.171.
[2]. WANG Qiankun, YU Xinfang, and SHU Qingtai. (2017). Forest burned scars area extraction using time series remote sensing data. Journal of Natural Disasters, 26(1), 1 - 10. (in Chinese)
[3]. Liu, Y.X., Zhang, J., Tang, Y., et al. (2023) 'Comparative Study of Rapid Extraction Methods of Burned Area Based on Sentinel-2 Images’, Forest Inventory and Planning, 48(6), pp.1-6. doi: 10. 3969/ j. issn. 1671-3168. 2023. 06. 001
[4]. Cui, Z.Y., Zhao, F.J., Zhao, S. et al. 'Research on information extraction of forest fire damage based on multispectral UAV and machine learning', Journal of Natural Disasters, 2024, 33(01): 99-108.DOI: 10.13577/j.jnd.2024.0109.
[5]. Avazov, K., Hyun, A. E., Sami, S. A. A., Khaitov, A., Abdusalomov, A. B., & Cho, Y. I. (2023). Forest Fire Detection and Notification Method Based on AI and IoT Approaches. Future Internet, 15(2), 61. https: //doi.org/10.3390/fi15020061.
[6]. LI, M. Z., KANG, X. R., & FAN, W. Y. (2017). Burned area extraction in Huzhong forests based on remote sensing and the spatial analysis of the burned severity. Scientia Silvae Sinicae, 53(3), 163–174.
[7]. Rao, Y. M. (2020). Research on Forest Fire Monitoring and Canopy Water Content Inversion Method of Burned Area Based on Multi-source Remote Sensing Data [D/OL]. Beijing Forestry University.
[8]. Dai, W. X., Zhu, T., Wu, T., Zhu, Y. J., & Chen, K. W. (2024). Forest Fire Loss Assessment Based on Multi-Source Remote Sensing Data. Technology Innovation and Application, 24, 10 - 14.
[9]. Huang, C.Y. (2023) 'Burned Area Mapping and Fire Severity Analyse of Muli Forest Fire Based on Remote Sensing Images and Multiple Machine Learning Algorithms’, doi: 0.27345/d.cnki.gsnyu.2023.000873
[10]. Zhao Shumei, Zheng Xilai, ** Lingling and Zhang Xiaohui, 2006. Study on the Water Environmental Capacity of Xiaozhushan Reservoir in Qingdao. Journal of Ocean University of China: Natural Science Edition, 36(6), pp. 971 - 974.
[11]. Wang Yao. (2016). Yingke Center of Vanke Xiaozhushan in Qingdao. Architecture Technique, 8, 58 - 63. DOI: 10.3969/j.issn.1674 - 6635.2016.08.009.
[12]. Key, C. H., & Benson, N. C. (1999). The normalized burn ratio (NBR): A landsat TM radiometric measure of burn severity. Bozeman, MT: United States Geological Survey, Northern Rocky Mountain Science Center.
[13]. Lutes, D. C., Keane, R. E., Caratti, J. F., et al. (2006). FIREMON: Fire effects monitoring and inventory system. Colorado: US Department of Agriculture, Forest Service, Rocky Mountain Research Station.
[14]. Stroppiana, D., Boschetti, M., Zaffaroni, P., et al. “Analysis and interpretation of spectral indices for soft multicriteria burned-area mapping in Mediterranean regions.” IEEE Geoscience Remote Sensing Letters, vol. 6, 2009, pp. 499–503.
[15]. Chuvieco, E., Martín, M. (1998). 'Cartografía de grandes incendios forestales en la Península Ibérica a partir de imágenes NOAA-AVHRR’, Serie Geográfica, 7, pp.109–128.
[16]. Chuvieco, E., Martín, M.P. and Palacios, A. (2002) 'Assessment of different spectral indices in the red-near-infrared spectral domain for burned land discrimination’, International Journal of Remote Sensing, 23(23), pp. 5103–5110. doi: 10.1080/01431160210153129.
[17]. Joachims T. SVMLight: Support Vector Machine [J]. 1999. .
[18]. Jiang, X., Lu, W. X., Yang, Q. C., et al. Evaluation of soil environmental quality by applying support vector machine [J]. China Environmental Science, 2014, 34(5): 1229-1235.
[19]. Kraemer, H.C. (2015) 'Kappa coefficient’, Wiley StatsRef: Statistics Reference Online, pp. 1–4. doi: 10.1002/9781118445112.stat00365.pub2.