


1. Introduction
At present, global warming has become a significant issue. The rising temperature is affecting each part of the earth, even the coldest place, the poles. Scientists have done a lot of research on temperature variation in Antarctica. The Antarctic Surface Air Temperature (SAT) trends are characterized by fast warming over West Antarctica but mild cooling over East Antarctica [1]. Stammerjohn et al. [2] found that the temperature on the Antarctic Peninsula has shown a rising trend since 1950. The inter-annual temperature variability of winter is the largest, and the annual mean temperature anomalies are dominated by winter temperatures [3]. An assessment that compared the data of ERA5 with the data from 41 weather stations shows a cooling trend in East Antarctica. Also, the south annular mode (SAM) trend had a statistically significant cooling effect in East Antarctica [4,5].
Antarctica is a very complex region, there are many factors that affect the temperature in this region. Although its continental area is not large, large amount of ice cover brought by the extreme low temperature and the complex terrain, which makes different regions of Antarctica show different temperature trends. Different research methods and variables for the same region may produce different results. Scientists are also trying to study the factors that may influence temperature in Antarctica. Some researchers have studied the sea ice, and find that Sea ice and temperature are significantly and negatively correlated [6,7]. Turner and others investigate the background of the extreme temperature, suggesting the relationship between the Foehn effect and the sea ice [8]. Some studies involve air pressure, and researchers have found the pressure is partially related to the temperature trend [9,10]. There are more studies of the relation between radiation and temperature carried out by Ångström [11], King [12] and T. Zhang et al. [13]. Moreover, Van Den Broeke and Van Lipzig [14] revealed the impact of the Antarctic Oscillation Index (AAOI) on different regions of Antarctica. Bitz and Polvani [15] investigate the impact of stratospheric ozone depletion on the Antarctic climate.
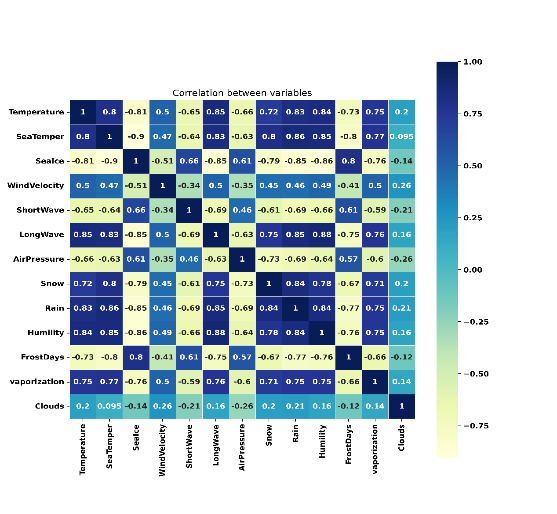
This paper chooses radiation and air pressure to do the research and uses Spearman's rho to analyze the correlation of the factors that are listed on the ECMWF as having an impact on Antarctica's climate. The correlation table suggests that the highest correlation is the longwave, while the shortwave and the air pressure are negative to the temperature, so from these factors, we choose these two to conduct the analysis.
This paper also generates different temperature trend graphs based on ERA5, which indicates the temperature of different parts of Antarctica and describes the temperature trend, concentrating on the East Antarctic, with longitude from 30°W to 170°E and latitude from 60°S to 90°S. And some sorts of statistical analysis method have been done and conduct the analysis of the factors affecting the temperature. This paper provides some ideas and views for studying the relationship between temperature, radiation and air pressure in East Antarctica.
2. Data and methods
2.1. Data
This paper uses data from ERA5 and EBAF from CERES. ERA5 is the fifth generation ECMWF atmospheric reanalysis of the global climate covering the period from 1940 to the present. The data covers the Earth on a 31km grid and resolves the atmosphere using 137 levels from the surface up to a height of 80km. CERES provides satellite-based observations of earth radiation budget (ERB) and clouds. The data provides direct measurements of reflected solar radiation and emission of thermal infrared radiation to space across all wavelengths between the ultraviolet and far-infrared.
This paper uses the annual average air pressure at mean sea level from 2001-2022 for the air pressure analysis. As for the radiation analysis, we choose the longwave and shortwave data under the condition of all sky. Considering that ERA5 is the reanalysis dataset of different data sources instead of the directly observed data, this paper uses the data from CERES to analyze radiation.
2.2. Spearman's rho
There are many factors that impact temperature. This paper uses Spearman's rho, a nonparametric statistic used to measure the monotonic relationship between two variables, to generate the correlation table of these factors listed on the ECMWF.
Calculation formula:
(
2.2.1. The latitude-weighted averaging method
In data processing, the latitude-weighted averaging method is used in this paper, considering the averaging method at different latitudes. This method consists of three steps and it can be used to obtain a more reasonable and accurate average.
Calculation formula:
1.calculate weights:
2.weighted summation:
3.normalization:
2.2.2. Linear regression model
To generate the trend of the processed data, this paper uses a linear regression model, implemented through the linregress function. This function calculates the slope, intercept, correlation coefficient (R), p-value, and standard error. The model is divided into two parts: the regression model, used for trend analysis, and the correlation model, used for significance testing and correlation analysis. The slope (m) and intercept (b) of the regression line are calculated, with the Pearson correlation coefficient measuring the linear relationship between variables like temperature, radiation, or pressure. The t-statistic and p-value are then used to assess the significance of the regression coefficient, determining if the observed trend between variables and time is statistically significant.
The Pearson correlation coefficients (R) measures the strength of the linear relationship between the variables and is given by:
3. Result
3.1. The temporal and spatial trend
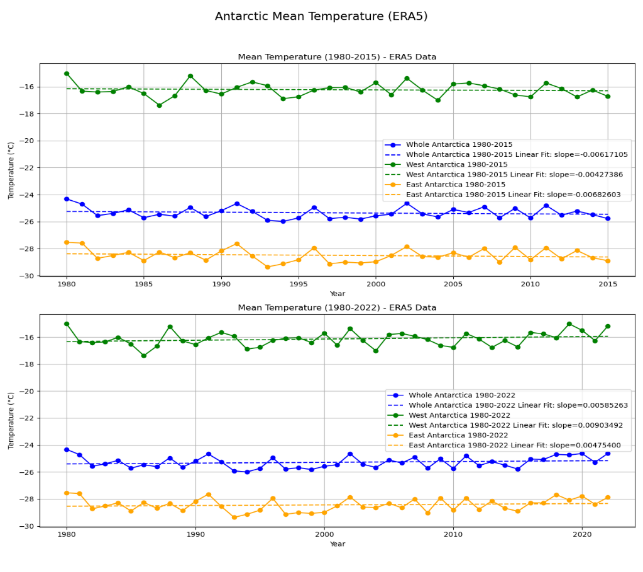
This paper depicts the monthly and annual temperature trends from 1980 to 2022 using ERA5 data. The annual plot indicates a consistent upward trend in Antarctica's temperature, aligning with the findings on global warming and conclusions drawn from previous literature reviewed in this study. The plot also displays the mean temperature and its trend in three different regions. The result suggests that the mean temperature of the west is much higher than that of the east, which may be because of the radiation budget between the snow surface and the cloud, and also the altitude [16]. The trend of the monthly mean temperature is consistent with the basic temperature pattern in the southern hemisphere, so this paper does not elaborate on this plot.
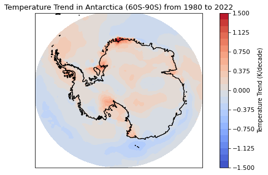
From this spatial temperature trend, it is showed that the overall temperature is upward, and the most obvious parts is mainly in the edge of the Antarctic continental. On the whole of the east Antarctica, the temperature trend is rising, this spatial graph shows the trend of the mean temperature from 1980-2022 more directly.
3.2. The factors that influence temperature
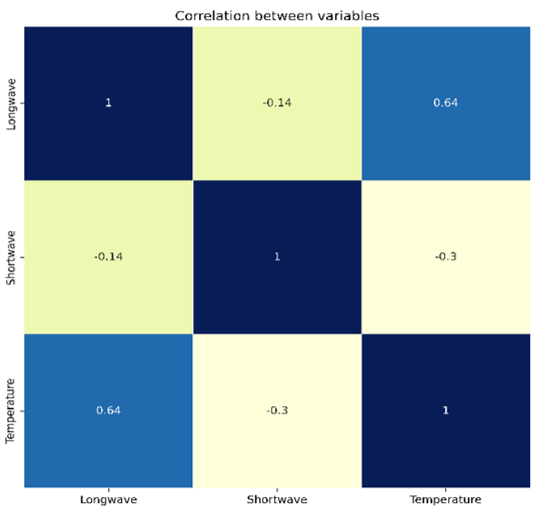
In the correlation table, the longwave (LW) shows the strongest positive correlation, while in the other part of the radiation, the shortwave (SW) shows a negative correlation. The katabatic wind has been proven to be the reason for the forcing of seasonal changes in surface pressure over Antarctica [17]. So, this paper chooses the LW, SW, and air pressure to conduct the analysis.
3.2.1. Radiation
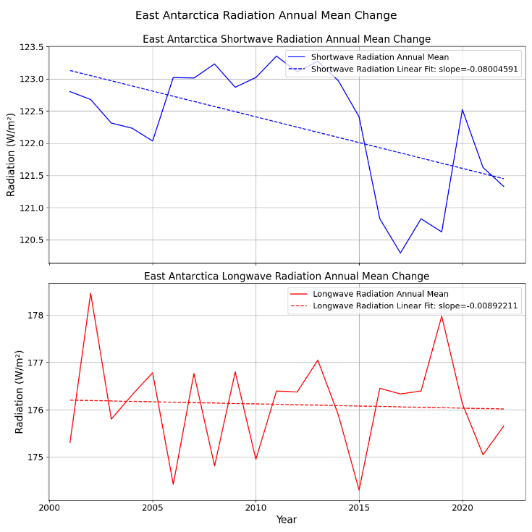
This paper generates a plot of the all-sky annual radiation mean change from 2001-2022 using the data from CERES. The plot shows the longwave and the shortwave present a downward trend. In this plot, the longwave is declining mildly at a rate of 0.009W/
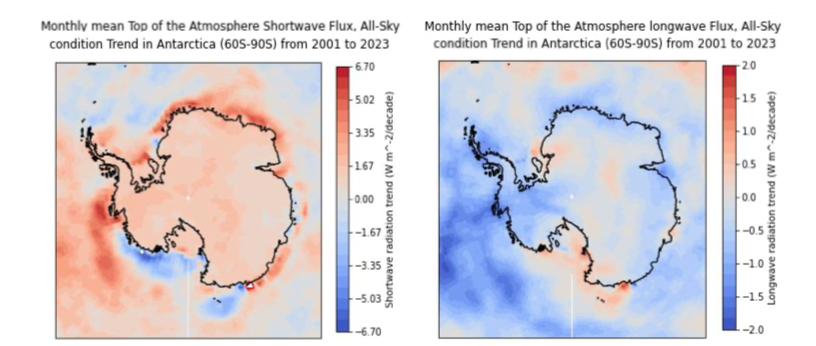
This paper also generates the spatial graph of radiation based on the same data from the CERES (Figure 5). The graph of the shortwave shows a decline trend from the whole perspective which is similar to the plot we generate while the interesting thing is the longwave shows a rising trend on account of the most part of the spatial graph is red, and this result is totally different with the trend plot showed above. The reason is really thought-provoking, this paper here speculates on the mathematical difference in data processing.
3.2.2. Air pressure
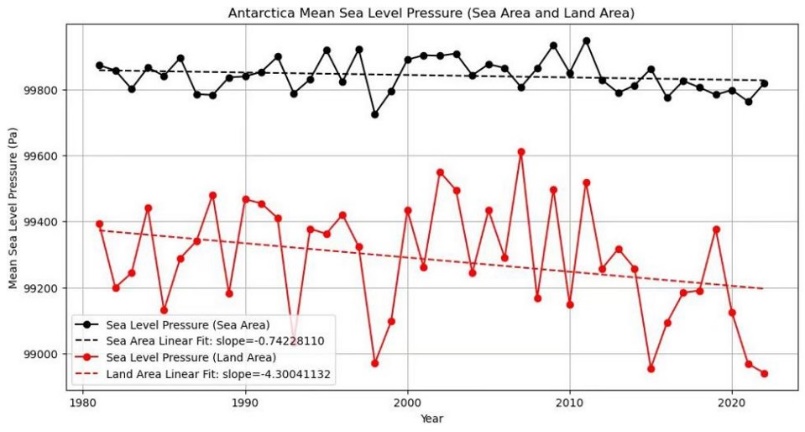
This paper generates a plot of the Antarctica annual mean sea level pressure of land and sea area from 2001-2022, using the data from ERA5. From the plot, the air pressure present a downward trend. In this plot, the rate of the sea level is 0.74Pa per year while the rate on land is 4.3Pa per year. In addition, the interannual rate on land is much higher, which means the interannual variation of air pressure on land is much more extreme than that in the sea. The reason may be attributed to katabatic wind caused by the topographic structure of the Antarctica continent [17].
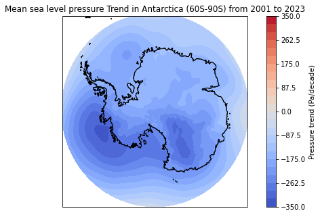
From the spatial graph of the air pressure, it is show that the whole air pressure of the Antarctica is declining as the temperature rising, both on the land and sea area. However, the plot generated from the data of three station, respectively Amundsen Scott, Vostok, and Mawson in east Antarctica shows that the air pressure is positive to the temperature.
3.3. The correlation analysis
Both linear correlation analysis and nonlinear correlation analysis are included in the paper. This paper uses Pearson Correlation Coefficient (
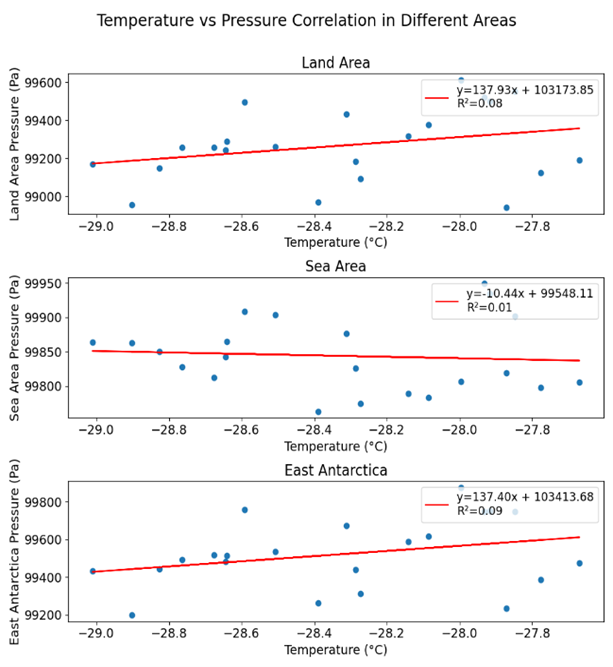
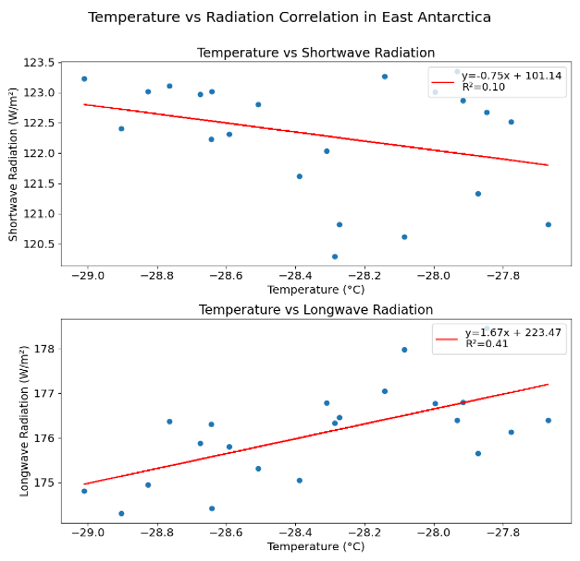
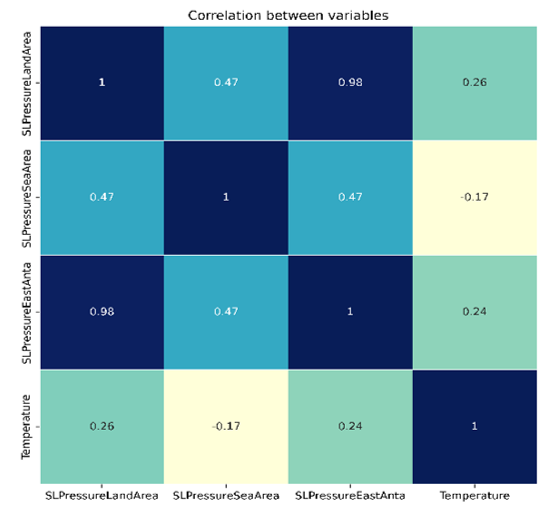
The figures below (figure 8 and figure 10) show the correlation between sea level pressure and temperature. The Pearson Correlation Coefficient (
The Pearson Correlation Coefficient of shortwave radiation and temperature is -0.3143, while the longwave is 0.6396. It means that the longwave radiation has a positive correlation with temperature, although it is not a strong correlation. And the result on correlation table can also prove the correlation.
3.4. The significance test
|
Variable name |
Trend P-Value |
Conclusion |
|
Longwave (All Sky) |
0.80674286 |
not statistically significant |
|
Shortwave (All Sky) |
0.00852615 |
statistically significant |
|
Pressure (Sea Area) |
0.34267202 |
not statistically significant |
|
Pressure (Land Area) |
0.06185942 |
not statistically significant |
|
Pressure (East) |
0.00233032 |
statistically significant |
|
Temperature (East) |
0.16885613 |
not statistically significant |
|
Temperature (Whole) |
0.10178369 |
not statistically significant |
|
Temperature (West) |
0.10918935 |
not statistically significant |
According to the results of the significance test shown in table 1, different variables have different statistical significance relating to time. Short-wave radiation and sea level pressure of East Antarctica show significant long-term trends, while other variables (e.g., long-wave radiation, pressure of sea area, pressure of land area, temperature of East, West and whole Antarctica) do not show significant long-term changes. This suggests that changes in some meteorological variables over time are statistically significant, while changes in others may be due to random variation.
4. Discussion and conclusion
The temperature has a slightly increasing trend in Antarctica. Among the different parts of Antarctica, the temperature of East Antarctica increases the slowest, which is only 0.0048°C per year.
As figure 3 has shown, many other factors affect temperature changes. This paper includes two factors: radiation and pressure. The radiation is divided into longwave radiation and shortwave radiation. Radiation and pressure all have a declining trend.
In the correlation analysis, the changing trend of most factors has almost no correlation with the temperature trend, only the longwave radiation has a positive but not so strong correlation with the temperature.
It is worth noting that in the correlation analysis, the longwave (LW) has positive correlation to the temperature(T). However, the plots generated show a different trend that longwave radiation is decreasing when the temperature trend is increasing. One possible reason is the data range of the temperature starts from 1980 to 2022, while longwave radiation is recorded from 2001. Some mechanisms may be related and affect each other, but that doesn't mean that this particular mechanism governs the overall trend. So there may be a relationship in inter-annual variability, but then the decadal change, the longer-term trends, may not be related. Also, it can be found in the results of the significance test that the temperature data are all not statistically significant, which means the response of temperature to the time changes is not significant and sensitive. Moreover, there can be other reasons like the ocean circulation.
Katabatic wind is an important factor that influences air pressure changes. The continent's ice and snow-covered land creates an unusual condition where near-surface air is cooler than the air above. The near-surface cold air mass descends and the higher warm air mass rises, which makes the cold air accumulate near the surface. This creates a fast flow of air down from a higher place like the edge of the Antarctic Plateau to a lower surface, which is called katabatic wind [16]. Parish and Bromwich [19] found that katabatic wind can contribute to the decline of surface pressure as it accelerates the mass transport and leads to the redistribution of air pressure during an incident of four-day pressure decreasing in 1988.
This research finds the two factors: radiation and pressure, are not highly correlated with temperature. The problem of how the various factors affecting temperature change in East Antarctica still exist and needs more research that consider a broader range of influences in future, including oceanic and atmospheric interactions.
References
[1]. Xin, M., Li, X., Stammerjohn, S. E., Cai, W., Zhu, J., Turner, J., Clem, K. R., Song, C., Wang, W., & Hou, Y. (2023). A broadscale shift in antarctic temperature trends. Climate Dynamics, 61(9–10), 4623–4641. https: //doi.org/10.1007/s00382-023-06825-4
[2]. Stammerjohn, S. E., Martinson, D. G., Smith, R. C., & Iannuzzi, R. A. (2008). Sea ice in the western Antarctic Peninsula region: Spatio-temporal variability from ecological and climate change perspectives. Deep Sea Research Part II: Topical Studies in Oceanography, 55(18–19), 2041–2058. https: //doi.org/10.1016/j.dsr2.2008.04.026
[3]. Turner, J., Marshall, G. J., Clem, K., Colwell, S., Phillips, T., & Lu, H. (2020). Antarctic temperature variability and change from station data. International Journal of Climatology, 40(6), 2986–3007.https: //doi.org/10.1002/joc.6378
[4]. Nicolas, J. P., & Bromwich, D. H. (2014). New Reconstruction of Antarctic Near-Surface Temperatures: Multidecadal Trends and Reliability of Global Reanalyses*, +. Journal of Climate, 27(21), 8070–8093.https: //doi.org/10.1175/JCLI-D-13-00733.1
[5]. Zhu, J., Xie, A., Qin, X., Wang, Y., Xu, B., & Wang, Y. (2021). An Assessment of ERA5 Reanalysis for Antarctic Near-Surface Air Temperature. Atmosphere, 12(2), 217.https: //doi.org/10.3390/atmos12020217
[6]. Mokhov, I. I., & Parfenova, M. R. (2021). Relationship of the Extent of Antarctic and Arctic Ice with Temperature Changes, 1979–2020. Doklady Earth Sciences, 496(1), 66–71.https: //doi.org/10.1134/S1028334X21010153
[7]. Smith, R. C., & Stammerjohn, S. E. (2001). Variations of surface air temperature and sea-ice extent in the western Antarctic Peninsula region. Annals of Glaciology, 33, 493–500. https: //doi.org/10.3189/172756401781818662
[8]. Turner, J., Lu, H., King, J., Marshall, G. J., Phillips, T., Bannister, D., & Colwell, S. (2021). Extreme Temperatures in the Antarctic. Journal of Climate, 34(7), 2653–2668.https: //doi.org/10.1175/JCLI-D-20-0538.1
[9]. Ma, Y., Bian, L., Xiao, C., Allison, I., & Zhou, X. (2010). Near surface climate of the traverse route from Zhongshan Station to Dome A, East Antarctica. Antarctic Science, 22(4), 443–459.https: //doi.org/10.1017/S0954102010000209
[10]. Turner, J., Colwell, S. R., Marshall, G. J., Lachlan-Cope, T. A., Carleton, A. M., Jones, P. D., Lagun, V., Reid, P. A., & Iagovkina, S. (2005). Antarctic climate change during the last 50 years. International Journal of Climatology, 25(3), 279–294. https: //doi.org/10.1002/joc.1130
[11]. Ångström, A. (1925). On Radiation and Climate. Geografiska Annaler, 7(1–2), 122–142. https: //doi.org/10.1080/20014422.1925.11881110
[12]. King, J. C. (1996). Longwave atmospheric radiation over Antarctica. Antarctic Science, 8(1), 105–109.https: //doi.org/10.1017/S0954102096000132
[13]. Zhang, T., Zhou, C., & Zheng, L. (2019). Analysis of the temporal–spatial changes in surface radiation budget over the Antarctic sea ice region. Science of The Total Environment, 666, 1134–1150.https: //doi.org/10.1016/j.scitotenv.2019.02.264
[14]. Van Den Broeke, M. R., & Van Lipzig, N. P. M. (2004). Changes in Antarctic temperature, wind and precipitation in response to the Antarctic Oscillation. Annals of Glaciology, 39, 119–126.https: //doi.org/10.3189/172756404781814654
[15]. Bitz, C. M., & Polvani, L. M. (2012). Antarctic climate response to stratospheric ozone depletion in a fine resolution ocean climate model. Geophysical Research Letters, 39(20), 2012GL053393.https: //doi.org/10.1029/2012GL053393
[16]. Scambos, T. A., Campbell, G. G., Pope, A., Haran, T., Muto, A., Lazzara, M., Reijmer, C. H., & Van Den Broeke, M. R. (2018). Ultralow Surface Temperatures in East Antarctica From Satellite Thermal Infrared Mapping: The Coldest Places on Earth. Geophysical Research Letters, 45(12), 6124–6133.https: //doi.org/10.1029/2018GL078133
[17]. Parish, T. R., & Bromwich, D. H. (1997). On the forcing of seasonal changes in surface pressure over Antarctica. Journal of Geophysical Research: Atmospheres, 102(D12), 13785–13792.https: //doi.org/10.1029/96JD02959
[18]. Zhang, C., & Li, S. (2023). Causes of the record-low Antarctic sea-ice in austral summer 2022. Atmospheric and Oceanic Science Letters, 16(6), 100353. https: //doi.org/10.1016/j.aosl.2023.100353
[19]. Parish, T. R., & Bromwich, D. H. (1998). A Case Study of Antarctic Katabatic Wind Interaction with Large-Scale Forcing. Monthly Weather Review, 126(1), 199–209. https: //doi.org/10.1175/1520-0493(1998)126< 0199: ACSOAK> 2.0.CO; 2
Cite this article
Zeng,S.;Rong,J.;Fang,L.;Liu,J. (2025). Study of Temperature Variation in East Antarctica. Applied and Computational Engineering,208,1-12.
Data availability
The datasets used and/or analyzed during the current study will be available from the authors upon reasonable request.
Disclaimer/Publisher's Note
The statements, opinions and data contained in all publications are solely those of the individual author(s) and contributor(s) and not of EWA Publishing and/or the editor(s). EWA Publishing and/or the editor(s) disclaim responsibility for any injury to people or property resulting from any ideas, methods, instructions or products referred to in the content.
About volume
Volume title: Proceedings of the 5th International Conference on Materials Chemistry and Environmental Engineering
© 2024 by the author(s). Licensee EWA Publishing, Oxford, UK. This article is an open access article distributed under the terms and
conditions of the Creative Commons Attribution (CC BY) license. Authors who
publish this series agree to the following terms:
1. Authors retain copyright and grant the series right of first publication with the work simultaneously licensed under a Creative Commons
Attribution License that allows others to share the work with an acknowledgment of the work's authorship and initial publication in this
series.
2. Authors are able to enter into separate, additional contractual arrangements for the non-exclusive distribution of the series's published
version of the work (e.g., post it to an institutional repository or publish it in a book), with an acknowledgment of its initial
publication in this series.
3. Authors are permitted and encouraged to post their work online (e.g., in institutional repositories or on their website) prior to and
during the submission process, as it can lead to productive exchanges, as well as earlier and greater citation of published work (See
Open access policy for details).
References
[1]. Xin, M., Li, X., Stammerjohn, S. E., Cai, W., Zhu, J., Turner, J., Clem, K. R., Song, C., Wang, W., & Hou, Y. (2023). A broadscale shift in antarctic temperature trends. Climate Dynamics, 61(9–10), 4623–4641. https: //doi.org/10.1007/s00382-023-06825-4
[2]. Stammerjohn, S. E., Martinson, D. G., Smith, R. C., & Iannuzzi, R. A. (2008). Sea ice in the western Antarctic Peninsula region: Spatio-temporal variability from ecological and climate change perspectives. Deep Sea Research Part II: Topical Studies in Oceanography, 55(18–19), 2041–2058. https: //doi.org/10.1016/j.dsr2.2008.04.026
[3]. Turner, J., Marshall, G. J., Clem, K., Colwell, S., Phillips, T., & Lu, H. (2020). Antarctic temperature variability and change from station data. International Journal of Climatology, 40(6), 2986–3007.https: //doi.org/10.1002/joc.6378
[4]. Nicolas, J. P., & Bromwich, D. H. (2014). New Reconstruction of Antarctic Near-Surface Temperatures: Multidecadal Trends and Reliability of Global Reanalyses*, +. Journal of Climate, 27(21), 8070–8093.https: //doi.org/10.1175/JCLI-D-13-00733.1
[5]. Zhu, J., Xie, A., Qin, X., Wang, Y., Xu, B., & Wang, Y. (2021). An Assessment of ERA5 Reanalysis for Antarctic Near-Surface Air Temperature. Atmosphere, 12(2), 217.https: //doi.org/10.3390/atmos12020217
[6]. Mokhov, I. I., & Parfenova, M. R. (2021). Relationship of the Extent of Antarctic and Arctic Ice with Temperature Changes, 1979–2020. Doklady Earth Sciences, 496(1), 66–71.https: //doi.org/10.1134/S1028334X21010153
[7]. Smith, R. C., & Stammerjohn, S. E. (2001). Variations of surface air temperature and sea-ice extent in the western Antarctic Peninsula region. Annals of Glaciology, 33, 493–500. https: //doi.org/10.3189/172756401781818662
[8]. Turner, J., Lu, H., King, J., Marshall, G. J., Phillips, T., Bannister, D., & Colwell, S. (2021). Extreme Temperatures in the Antarctic. Journal of Climate, 34(7), 2653–2668.https: //doi.org/10.1175/JCLI-D-20-0538.1
[9]. Ma, Y., Bian, L., Xiao, C., Allison, I., & Zhou, X. (2010). Near surface climate of the traverse route from Zhongshan Station to Dome A, East Antarctica. Antarctic Science, 22(4), 443–459.https: //doi.org/10.1017/S0954102010000209
[10]. Turner, J., Colwell, S. R., Marshall, G. J., Lachlan-Cope, T. A., Carleton, A. M., Jones, P. D., Lagun, V., Reid, P. A., & Iagovkina, S. (2005). Antarctic climate change during the last 50 years. International Journal of Climatology, 25(3), 279–294. https: //doi.org/10.1002/joc.1130
[11]. Ångström, A. (1925). On Radiation and Climate. Geografiska Annaler, 7(1–2), 122–142. https: //doi.org/10.1080/20014422.1925.11881110
[12]. King, J. C. (1996). Longwave atmospheric radiation over Antarctica. Antarctic Science, 8(1), 105–109.https: //doi.org/10.1017/S0954102096000132
[13]. Zhang, T., Zhou, C., & Zheng, L. (2019). Analysis of the temporal–spatial changes in surface radiation budget over the Antarctic sea ice region. Science of The Total Environment, 666, 1134–1150.https: //doi.org/10.1016/j.scitotenv.2019.02.264
[14]. Van Den Broeke, M. R., & Van Lipzig, N. P. M. (2004). Changes in Antarctic temperature, wind and precipitation in response to the Antarctic Oscillation. Annals of Glaciology, 39, 119–126.https: //doi.org/10.3189/172756404781814654
[15]. Bitz, C. M., & Polvani, L. M. (2012). Antarctic climate response to stratospheric ozone depletion in a fine resolution ocean climate model. Geophysical Research Letters, 39(20), 2012GL053393.https: //doi.org/10.1029/2012GL053393
[16]. Scambos, T. A., Campbell, G. G., Pope, A., Haran, T., Muto, A., Lazzara, M., Reijmer, C. H., & Van Den Broeke, M. R. (2018). Ultralow Surface Temperatures in East Antarctica From Satellite Thermal Infrared Mapping: The Coldest Places on Earth. Geophysical Research Letters, 45(12), 6124–6133.https: //doi.org/10.1029/2018GL078133
[17]. Parish, T. R., & Bromwich, D. H. (1997). On the forcing of seasonal changes in surface pressure over Antarctica. Journal of Geophysical Research: Atmospheres, 102(D12), 13785–13792.https: //doi.org/10.1029/96JD02959
[18]. Zhang, C., & Li, S. (2023). Causes of the record-low Antarctic sea-ice in austral summer 2022. Atmospheric and Oceanic Science Letters, 16(6), 100353. https: //doi.org/10.1016/j.aosl.2023.100353
[19]. Parish, T. R., & Bromwich, D. H. (1998). A Case Study of Antarctic Katabatic Wind Interaction with Large-Scale Forcing. Monthly Weather Review, 126(1), 199–209. https: //doi.org/10.1175/1520-0493(1998)126< 0199: ACSOAK> 2.0.CO; 2