


1. Introduction
Invoice is a tool commonly used in business operations and people's daily lives. In the process of use, in order to avoid duplicate reimbursement of invoices, staff need to write down the invoice number. With the increase of invoice numbers day by day, the workload of electronic archiving is more cumbersome. In order to process invoices more conveniently and efficiently, invoice text detection technology based on optical character recognition (OCR) has developed rapidly, which can assist staff in extracting key information of invoices and reduce manual entry during online reimbursement.
As a key technology for invoice text detection, OCR's framework can generally be divided into three stages: pre-processing stage, text detection stage and text recognition stage. Image preprocessing is usually corrected for image imaging problems. Text detection detects the position and range of text and its layout, usually including layout analysis and text row detection. Text recognition is the foundation of text detection, which recognizes the content of text and converts text. Traditional ORC methods need strong expertise and precise tuning parameters to get good results, and the methods are usually not universal and have poor robustness.
Text detection based on deep learning can also be divided into three directions: candidate box, segmentation and hybrid. Scene text detection based on segmentation has gradually become the first choice. Because of its pixel-level prediction, it can correctly detect text of many shapes. Its disadvantage is that it always needs complex follow-up processing and consumes a lot of computing resources and takes a lot of time. Although previous efforts have improved the accuracy of invoice text detection, most of them ignored the huge improvement of preprocessing to improve detection accuracy and generalization ability. At present, in the application of invoice recognition, ocr does not effectively process the background and oblique pictures in the preprocessing stage, and directly performs binary processing on the pictures. In the text detection part, when the background of the picture is exposed or tilted, a large area of the picture is covered by black shadows. To this end, the valid information is covered by the invalid seal and the valid information part of the picture is lost, casuing a invalid text detection.
In this study, we first select the widely used DBNet [1] with good text detection as the basis of the study and reveal the great potential of preprocessing strategies in improving OCR accuracy. DBNet is a segmentation-based text detection, which can accurately classify the each pixel. DBNet improves and proposes a differentiable binary threshold in the feature extraction of traditional deep learning, so that errors in learning can be quickly corrected, and the speed and accuracy of network learning are also improved. Further, in order to suppress the influence of background noise on detection results, we introduce color segmentation and local adaptive threshold to improve the preprocessing process.
2. Related work
Invoice text detection belongs to scenario text detection, which is roughly divided into two categories: regression-based methods and segmentation-based methods.
The regression-based method is mainly based on the backbone convolutional network, and the text box is improved by adding the convolution layer.For example, SSD [2] mainly used the feature maps of different convolutional layers for synthesis. Direct prediction of bounding boxes and box offsets increased speed meanwhile maintaining accuracy. TextBoxes [3] modified the aspect ratio of the default boxes and increased the vertical offset based on SSD. However, TextBoxes++ [4] adopted the same strategy, changing the convolutional kernel of the last layer and adding the output form of the network for better understanding. Besides, EAST [5] proposed a text detection method based on two-stage, the two stages are FCN and NMS, eliminating some redundant stages in the middle and predicting the text directly. Also, there is Seglink [6], which split the global problems of text detection into local detectable elements: segments and links. Different from SSD, it is a bottom-up detection method. Generally, regression-based methods have been able to achieve the double guarantee of speed and accuracy in ordinary environments. But they can not do well for scene text with unpredictable shapes and sizes.
The advantage of the segmentation-based methods is the ability to make predictions at the pixel level to better describe text in different shapes in natural scenes. The fundament of such methods is the post-processing of binary map and different methods made different degrees of improvements to this process. For instance, due to the addition of the Mask network, Mask RCNN integrated two functions: object detection and instance segmentation. The use of ROIAlign technology solved the problem of previously unable to align pixels and ensured the accuracy of image semantic segmentation. Pixel-link determined the corresponding text area by pixel segmentation and then used link to connect or separate the text areas. Similar to Seglink, it is also a bottom-up detection method. Besides, PSENet [7], as an advanced method, it is a purely segmented text detection method. The model proposed a progressive scale-scaling algorithm to achieve the effect of positioning arbitrary-shaped text, but the disadvantage was that the speed was too slow. PANet is a network model for top-down and bottom-up bidirectional fusion. There are two modules of adaptive feature pooling and full connection fusion, the former guarantees feature integrity and diversity while the latter is in order to get more accurate predictions.
Conversely, our method is not just based on the segmentation-based method and has made corresponding improvements to the traditional methods that need to set the threshold for binary post-processing, resulting in slow speed and high power consumption.
3. Method
3.1. DBNet
Traditional segmentation-based text recognition methods need to set a fixed threshold to judge the foreground and background,Threshold is a constant so it is not differentiable.This often causes the threshold setting to become extremely important. The DBNet network proposed in 2019 has improved the binary operation, it allows adaptive threshold change during binarization operation, and the differential binarization formula is differentiable.
|
Figure 1. DBNet network structure [1]. |
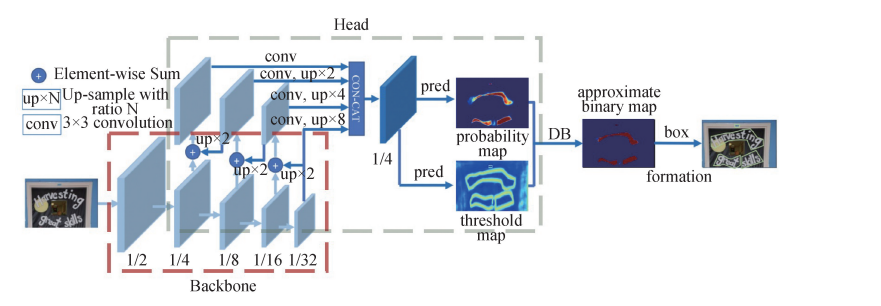
The overall network structure of DBNet is shown in the figure above.After the image passes through the FPN network, four feature maps are obtained. Finally,the feature map F is obtained by up sampling and concat operation。Then, the probability map P and threshold map T are obtained by making prediction through F. Finally, the text box results are obtained through binary map \( \hat{B} \) . The standard binarization operation is done by the formula (1):
\( {B_{i,j}}=\begin{cases} \begin{array}{c} 1 if {P_{i,j}}≥t \\ 0 otherwise \end{array} \end{cases} \) (1)
By the above formula, the binary map can be obtained. Obviously, this formula cannot be done through gradient descent, it should be noted that \( t \) is a preset threshold. To solve the problem of non-differentiable, DBNet network proposed Differentiable Binarization, By combining probability map and threshold map, an adaptive threshold of binarization is obtained. The formula (2) is as follows:
\( {\hat{B}_{i,j}}=\frac{1}{1+{e^{-k({P_{i,j}}-{T_{i,j}})}}} \) (2)
In the above formula, T represents the value of the target position in the threshold map, \( P \) represents the value of the target position in the probability map, where \( k \) is the amplification factor, which is generally set to 50. The output \( {\hat{B}_{i,j}} \) represents an approximate binary map. To explain the performance improvement,we can consider \( ({P_{i,j}}-{T_{i,j}}) \) as input \( x \) , The original formula (3) and can be regarded as:
\( {\hat{B}_{i,j}}=\frac{1}{1+{e^{-kx}}} \) (3)
In the network, the positive sample text area is binary to 1, and the background area is binary to 0, using CELoss formula (4) is as follows:
\( CELoss=-ylog(f(x))-(1-y)log{(1-f(x))} \) (4)
Where x= \( {P_{i,j}}-{T_{i,j}} \) , for positive samples, \( {lossl_{+}} \) =-log \( \frac{1}{1+{e^{-kx}}} \) . For negative samples, \( {lossl_{-}}=-log{(1-\frac{1}{1+{e^{-kx}}})} \) . The partial derivatives of the two losses with respect to x can be obtained through formula (5) and (6).
\( \frac{∂{l_{+}}}{∂x} \) = \( -kf(x){e^{-kx}} \) (5)
\( \frac{∂{l_{-}}}{∂x} \) = \( kf(x) \) (6)
|
Figure 2. Image of loss function. |
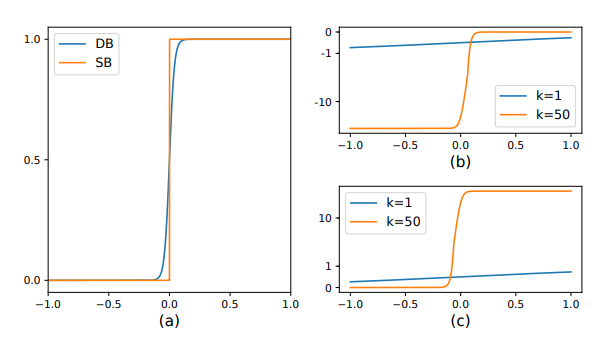
From the partial derivative and the two derivative curves on the right, we can draw the following conclusions: (1) When k is 50, the gradient is greatly enlarged. (2) When the prediction is wrong (x<0 area in b, x>0 area in c), the loss is greatly amplified, so that the model can be better optimized for better prediction results. So far, we have obtained the approximate binary map \( {\hat{B}_{i,j}} \) and the reason for its effect. Finally, the final output can be obtained by labeling and approximate binary graph labeling on the original map. In this study, we have used three methods to process invoices.
3.2. The method of color segmentation to remove the red seal-based on RGB
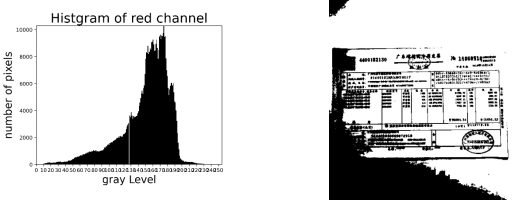
This method is mainly to separate different color channels so that the picture can be displayed in different color reading methods, so that the impact of the seal on valid information can be minimized.First of all, read the original image A, then extract the red channel of the image, get the grayscale value of the red channel, calculate the statistical histogram C of B, determine the best threshold threshold threshold, bind B according to the threshold, and get the final picture D. In the experiment, we found that the best removal effect is the red channel grayscale picture B. Although D can also remove the seal, at the same time, the picture will also become blurred, causing the effective information to be lost. The determination of the optimal threshold has a great impact on the results of subsequent image processing, so it is easy to have large differences between different images. So we decided to select the red channel gray value image as the final result.
|
|
Figure 3. RGB processed image. |
3.3. The method of color segmentation to remove red seal-based on HSV
In the most common color space RGB, the colors are described in three components: red, green and blue.HSV[8] and HSL [9] are descriptions of hue/saturation and brightness/brightness, which are particularly useful for recognizing the contrast of images. We are here to identify invoice stamps.
HSV can be described as a cylindrical color space in three-dimensional space. The color or tone is modeled as the angle size rotated around the central vertical axis, which represents the value channel. The value is dark from the bottom (the bottom value is 0) to the top is bright. The third axis is saturation, which defines the shade shadow from the minimum saturation on the vertical axis to the maximum saturation farthest from the center.
|
Figure 4. HSV color distribution map. |
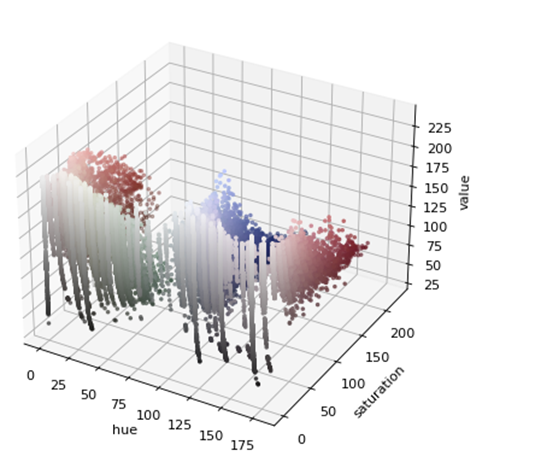
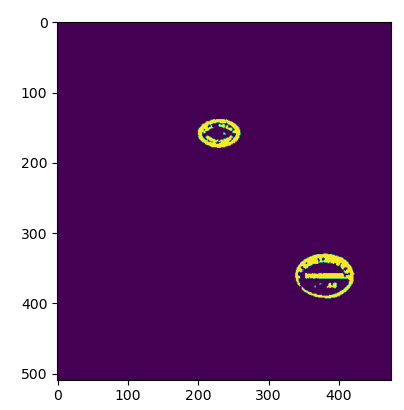
Our screening threshold can be determined through the HSV color distribution map. Once we get the right color range, we can try to set the Nemo threshold with cv2.inRange(). InRange() returns the binary mask (1 and 0) of the size of the ndarray image, where the value 1 represents the value in the range and the value 0 represents the value outside the range. The results are shown in Figure 5.
|
|
Figure 5. HSV remove stamp. | |
3.4. Local adaptive thresholding to improve image background and inclination
The Adaptive Threshold Algorithm Uses The Concept Of Integral Image, A Fast And Effective Algorithm For Calculating The Rectangular Subregions Of The Mesh. The values of any point (x, y) in the integral graph are the sum of all values from the upper left corner of the graph to the rectangular area formed by that point. The adaptive threshold method can better separate the image itself from the background in different situations, without setting appropriate thresholds for different images, which greatly reduces the workload and increases the feasibility.
The main idea of the adaptive threshold algorithm is to set a sliding window with a size of \( s×s \) with a pixel as the center. The sliding window sweeps through the whole image. Each scan, the pixel in the window is averaged and the mean is taken as the local threshold. If a pixel value in the window is lower than the local threshold t/100, the assignment is 0; higher than the local threshold t/100, the assignment is 255. Because it involves adding and calculating overlapping windows multiple times, the use of the integral graph can effectively reduce the complexity and number of operations. In order to calculate the integral graph, we store the sum of all \( f(x, y) \) values on the left and above each location. This step will be completed in a linear time:
\( I(x, y)= f(x, y)+I(x-1, y)+I(x, y-1)-I(x-1, y-1) \) (7)
Once the integral graph is obtained, the sum of values in any rectangle from the upper left corner ( \( {x_{1}} \) , \( {y_{1}} \) ) to the lower right corner ( \( {x_{2}} \) , \( {y_{2}} \) ) can be calculated using the following formula:
\( \sum _{x={x_{1}}}^{{x_{2}}}\sum _{y={y_{1}}}^{{y_{2}}}f(x,y)=I({x_{2}},{y_{2}})-I({x_{2}},{y_{1}}-1)-I({x_{1}}-1,{y_{2}})+I({x_{1}}-1,{y_{1}}-1) \) (8)
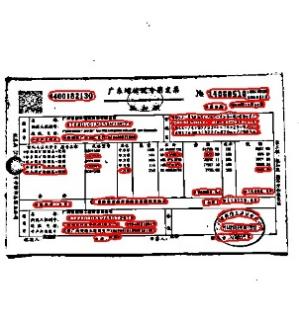
The process scans the whole picture twice. The first scan obtains the integral graph intImg, and the second scan calculates the average (100-t)/100 of the pixels in each scan window according to the above formula, and takes the calculation results as a local threshold. If the value of a pixel in the window is multiplied by the window size greater than the threshold, the corresponding output is 255, and vice versa output is 0. The results are shown in Figure 6.
|
|
Figure 6. Local adaptive threshold processing invoice results. | |
4. Experiment
4.1. Datasets
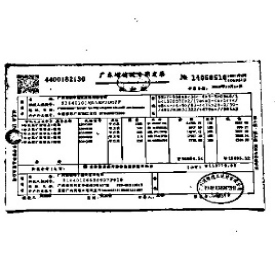
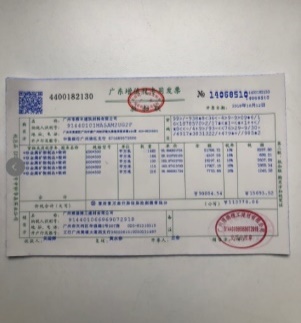
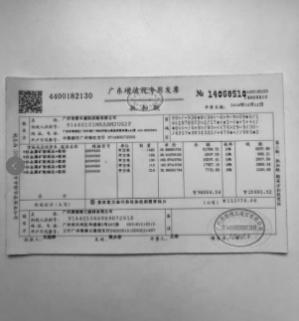
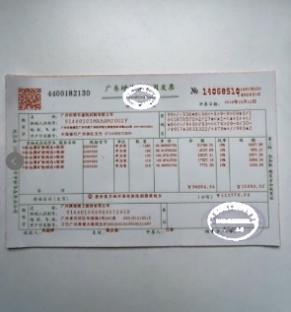
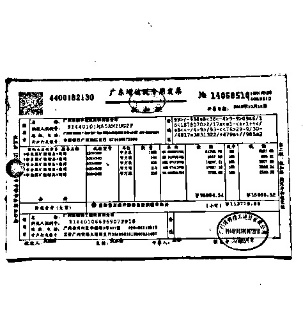
Training Datasets: ICDAR 2015 dataset [10]. The dataset consists of 1000 training images and 500 test images and each picture is provided with a quad word label. Each image has a corresponding txt file for annotation, the first eight numbers in the txt file correspond to the four vertex coordinates of the quad and the last column corresponds to the content of the text. In our study, 1,000 training images from this dataset are selected as training sets.
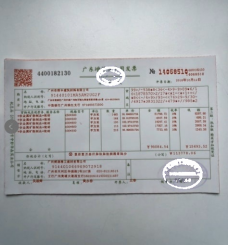
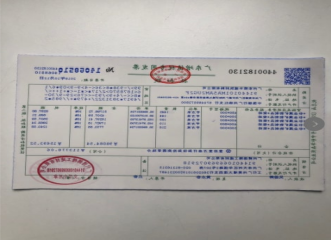
The test dataset is a dataset of 9 original invoice images which are independently queried by our team and labeled by the Labelme labeling tool. In order to match the format of the training datasets, we converted the json files generated by the annotation into txt files in the corresponding format.
4.2. Evaluation indicators
The performance indicators we used in this paper are Recall, Precision, F1-score, etc. Recall represents the ratio of the text box with both the correct predicted recall rate and all the actual text boxes. Precision represents the proportion of correctly predicted text boxes to all predicted text areas. F1-score takes into account both the precision and the recall, and is obtained by taking the harmonic average of the first two indicators. The formula is as follows:
\( Recall=\frac{TP}{TP+FN} \) (8)
\( Precision=\frac{TP}{FP+TP} \) (9)
\( F1-score=\frac{2·Precision·Recall}{Precision+Recall}=\frac{TP}{TP+\frac{1}{2}(FP+FN)} \) (10)
TP is the number of text areas that are actually text areas, FN is the number of text areas determined as non text areas, FP denotes the number of non-text areas to be determined as text areas; Precision evaluates the prediction accuracy of the text area predicted by the model. Precision and recall are often incompatible and contradict each other. F1 score is poor when recall and precision are both poor. Only when precision and recall are good can F1-score be high. F1 score is a good method for comparing classification tasks. It is often used as an indicator of OCR model performance evaluation.
4.3. Result analysis
To verify the effectiveness of the method, we trained the model on the ICDR2015 dataset, and carry out the prediction test on the pictures after different processing of the invoice. The results between them were compared in Tabel 1. We have adopted three image processing methods: extracting RED-RGB channel images, HSV based seal removal and adaptive threshold background removal. The validity of the three processing methods is tested by benchmarking the performance evaluation indicators Recall, Precision and F1 Core.
Table 1. Results of different settings.
Original Map | RGB Channel | Seal Removal | Background Removal | |
Recall | 0.09 | 0.13 | 0.13 | 0.25 |
Precision | 0.67 | 0.75 | 0.75 | 0.73 |
F1-Score | 0.159 | 0.23 | 0.23 | 0.372 |
The test results are shown in the Table 1 above. Without any processing of the original photo, the prediction result is poor, especially the recall indicator. After analysis, we believe that it is mainly because there is no text detection sample for invoices in the training samples, resulting in poor direct prediction results for invoices. In addition, the detection result is poor due to the low definition of the detection sample itself. After RGB channel extraction and seal removal, all indicators have been significantly improved Recall increased from 0.09 to 0.13. Precision increased from 0.67 to 0.75, F1 Core increased from 0.159 to 0.23. Background removal results in the greatest improvement among the three methods, Recall 0.25, Precision 0.73, F1-Score 0.372. It is not difficult to find that the processing of this paper can improve the detection of invoice text.
|
|
|
|
Original Map | RGB Channel | Seal Removal | Background Removal |
Figure 7. Visualization of results with different settings. | |||
|
|
|
|
Original Map | RGB Channel | Seal Removal | Background Removal |
Figure 8. Visualization of detection results with different settings. | |||
As the Figure 7 and 8 shown, the result of original photo detection is poor. Many text areas are not detected, but the detected part has a high accuracy. After RGB channel extraction, the number of detection boxes increased significantly and the detection accuracy also improved. The seller information on the lower left side is clearly detected. From the original only one to four all detected. At the same time, the lower case numbers above the red seal on the lower right side can also be detected, which shows that our method of handling seals is effective. Finally, look at the detection results under the background removal method, results show that the number of detections has been greatly increased, at the same time, the text information of the seal itself can be detected. Commodity details can be detected in large quantities to illustrate the significant relationship and good results with our background interference removal.
4.4. Limitation
There are some limitations to our baseline method. The method cannot handle the "text in text" situation, especially for natural scenes, such problems are easy to arise, but the invoice dataset we chose rarely had these kinds of problems, causing us to overlook this limitation. Besides, in the preprocessing stage of this experiment, we cannot guarantee the integrity of the stamp covering part resulting in unnecessary loss of image information. Finally, because the processing of the original image is bound to lead to the loss of image information, especially when the original image is clear and there is no excessive background interference, processing the original image tends to result in a situation where the loss is greater than the improvement.
5. Conclusion
In this article, we used the DBNet network model as the research basis and added two methods of color segmentation and background removal in the preprocessing stage, proposing improvements for the detection of invoice texts. Through experiments, results show that after the process of color segmentation or background removal, the detection results have been obviously improved. Also, the two different methods have a good performance in the improvement of recall and precision performance indicators. This study mainly contributes greatly to the improvement of invoice text detection based on traditional OCR methods in the preprocessing stage. It provides convenience for the reimbursement and verification of invoices in people's daily lives while also ensures the accuracy. For invoice, unlike the text detection of other natural scenes, considering the impact of text overlay and background, in the case of separating the background, we will conduct more in-depth research on how to reduce the loss of image quality in the future. At the same time, we can separate the pictures with less background interference from more pictures, and strive to maintain the original image for less interference pictures, and use background separation for pictures with more interference.
References
[1]. Liao, M., Wan, Z. Yao, C., Chen, K., & Bai, X. (2019). Real-time scene text detection with differentiable binarization.
[2]. Liu, W.; Anguelov, D.; Erhan, D.; Szegedy, C.; and Reed, S. E. 2016. SSD: single shot multibox detector. In Proc. ECCV.
[3]. Liao, M.; Shi, B.; Bai, X.; Wang, X.; and Liu, W. 2017. Textboxes: A fast text detector with a single deep neural network. In Proc. AAAI.
[4]. Liao, M.; Shi, B.; and Bai, X. 2018. Textboxes++: A singleshot oriented scene text detector. IEEE Trans. Image Processing 27(8):3676–3690.
[5]. Zhou, X.; Yao, C.; Wen, H.; Wang, Y.; Zhou, S.; He, W.; and Liang, J. 2017. EAST: an efficient and accurate scene text detector. In Proc. CVPR.
[6]. Shi, B.; Bai, X.; and Belongie, S. J. 2017. Detecting oriented text in natural images by linking segments. In Proc. CVPR.
[7]. Wang, W.; Xie, E.; Li, X.; Hou, W.; Lu, T.; Yu, G.; and Shao, S. 2019a. Shape robust text detection with progressive scale expansion network. In Proc. CVPR, 9336–9345.
[8]. Hong Mengxia, Liang Shaohua. Color image segmentation based on RGB color space [J]. Computer Knowledge and Technology, 2020,16(34):225-227.
[9]. Wang Tao. Research on Invoice Recognition and Self-Correction System Based on Color Segmentation [J]. Information Technology and Network Security, 2021,40(5):80-85. DOI:10.19358/j.issn.2096-5133.2021.05.014.
[10]. Karatzas, D.; Gomez-Bigorda, L.; Nicolaou, A.; Ghosh, S. K.; Bagdanov, A. D.; Iwamura, M.; Matas, J.; Neumann, L.; Chandrasekhar, V. R.; Lu, S.; Shafait, F.; Uchida, S.; and Valveny, E. 2015. ICDAR 2015 competition on robust reading. In Proc. ICDAR.
Cite this article
Liang,F.;Wu,Y.;Yang,J. (2023). Unveiling the potential of pre-processing and differentiable binarization thresholds for invoice text detection. Applied and Computational Engineering,6,1245-1254.
Data availability
The datasets used and/or analyzed during the current study will be available from the authors upon reasonable request.
Disclaimer/Publisher's Note
The statements, opinions and data contained in all publications are solely those of the individual author(s) and contributor(s) and not of EWA Publishing and/or the editor(s). EWA Publishing and/or the editor(s) disclaim responsibility for any injury to people or property resulting from any ideas, methods, instructions or products referred to in the content.
About volume
Volume title: Proceedings of the 3rd International Conference on Signal Processing and Machine Learning
© 2024 by the author(s). Licensee EWA Publishing, Oxford, UK. This article is an open access article distributed under the terms and
conditions of the Creative Commons Attribution (CC BY) license. Authors who
publish this series agree to the following terms:
1. Authors retain copyright and grant the series right of first publication with the work simultaneously licensed under a Creative Commons
Attribution License that allows others to share the work with an acknowledgment of the work's authorship and initial publication in this
series.
2. Authors are able to enter into separate, additional contractual arrangements for the non-exclusive distribution of the series's published
version of the work (e.g., post it to an institutional repository or publish it in a book), with an acknowledgment of its initial
publication in this series.
3. Authors are permitted and encouraged to post their work online (e.g., in institutional repositories or on their website) prior to and
during the submission process, as it can lead to productive exchanges, as well as earlier and greater citation of published work (See
Open access policy for details).
References
[1]. Liao, M., Wan, Z. Yao, C., Chen, K., & Bai, X. (2019). Real-time scene text detection with differentiable binarization.
[2]. Liu, W.; Anguelov, D.; Erhan, D.; Szegedy, C.; and Reed, S. E. 2016. SSD: single shot multibox detector. In Proc. ECCV.
[3]. Liao, M.; Shi, B.; Bai, X.; Wang, X.; and Liu, W. 2017. Textboxes: A fast text detector with a single deep neural network. In Proc. AAAI.
[4]. Liao, M.; Shi, B.; and Bai, X. 2018. Textboxes++: A singleshot oriented scene text detector. IEEE Trans. Image Processing 27(8):3676–3690.
[5]. Zhou, X.; Yao, C.; Wen, H.; Wang, Y.; Zhou, S.; He, W.; and Liang, J. 2017. EAST: an efficient and accurate scene text detector. In Proc. CVPR.
[6]. Shi, B.; Bai, X.; and Belongie, S. J. 2017. Detecting oriented text in natural images by linking segments. In Proc. CVPR.
[7]. Wang, W.; Xie, E.; Li, X.; Hou, W.; Lu, T.; Yu, G.; and Shao, S. 2019a. Shape robust text detection with progressive scale expansion network. In Proc. CVPR, 9336–9345.
[8]. Hong Mengxia, Liang Shaohua. Color image segmentation based on RGB color space [J]. Computer Knowledge and Technology, 2020,16(34):225-227.
[9]. Wang Tao. Research on Invoice Recognition and Self-Correction System Based on Color Segmentation [J]. Information Technology and Network Security, 2021,40(5):80-85. DOI:10.19358/j.issn.2096-5133.2021.05.014.
[10]. Karatzas, D.; Gomez-Bigorda, L.; Nicolaou, A.; Ghosh, S. K.; Bagdanov, A. D.; Iwamura, M.; Matas, J.; Neumann, L.; Chandrasekhar, V. R.; Lu, S.; Shafait, F.; Uchida, S.; and Valveny, E. 2015. ICDAR 2015 competition on robust reading. In Proc. ICDAR.