


1. Introduction
Plant diseases and insect pests have always been a severe challenge to all countries in the world. Every year, a large number of crops are reduced due to diseases and insect pests, resulting in huge agricultural economic losses and famine disasters. Among them, rice is the main food crop in East Asia and Southeast Asia, and nearly half of the world's population takes rice as their staple food, far exceeding wheat and corn. The stability of crop yield is of great significance to the world food security.
From this point of view, the pest control and leaf disease of rice and other crops will become a very important issue. If effective measures can be taken at the early stage of rice growth to reduce the incidence of pests and diseases, it will have a great impact on agricultural production. However, the traditional way to guide agricultural production by artificially observing the growth state of crops, such as the shape, size, color and disease spots of leaves, requires professionalism and time, and the overall efficiency is not high. With the rapid development of computer science and technology, the concepts of artificial intelligence, machine learning and computer vision appear. How to create a fast, efficient and high-precision network identification model to detect the state of crop leaves has become an urgent point. These technologies can help people complete the detection of crop diseases and insect pests in a very short time, which greatly liberates manpower.
Extracting the characteristics of early plant leaves mainly depends on manual classification to distinguish some abnormal situations. Mohan et al. [1] used k-nearest neighbor (KNN) and support vector machine (SVM) to identify crop disease types, which can achieve 91% and 93% accuracy respectively. Waghmare et al. [2] proposed an automatic detection system for grape diseases using the extracted color local binary pattern (LBP) features, and then used multi class SVM to classify the extracted texture patterns. Mohammadpoor et al. [3] used the fuzzy c-means algorithm (FCM) to highlight the unhealthy part of each leaf, and then fed it back to the support vector machine, so that the accuracy reached more than 98%. Atanassova et al. [4] proposed a classification model based on spectral data to predict the probability of plant diseases and insect pests, with an accuracy rate close to 80%. At present, vision-based detection of crop diseases and pests has been developed, which is to identify and detect diseases by extracting the image features of leaves and using models. Zhu et al. [5] used image analysis and back-propagation neural network (BPNN) to identify grape diseases and achieved high disease classification accuracy.
The use of new equipment and technology in agriculture, as well as new algorithms for deep learning, are the keys to smart agriculture. Deep learning is widely used to solve complex problems, such as feature extraction, pattern analysis and image classification. Many researchers apply deep learning to crop disease diagnosis. Ferrentinos et al. [6] trained several different model architectures on large open plant data sets, and the results showed that the convolutional neural network model was very suitable for plant disease identification. Subsequently, Atabay et al. [7] constructed a new CNN architecture after slightly adjusting the weight in the pre training model, which has good advantages in accuracy and time consumption compared with the original model.
The object detection technology based on CNN has become one of the current research hotspots. This technology can identify, locate and classify objects in images or videos by locating and predicting the positions of objects, classifying and defining the categories of objects. Object detection algorithms are mainly divided into two categories (ResNet, GoogLeNet and Faster-RCNN) and single-stage (such as SSD, YOLO, etc.). Although the detection method based on candidate regions has relatively high accuracy, this method is limited by the large amount of computation and low real-time performance. Therefore, a single-stage object detection algorithm is further proposed to achieve fast and efficient detection.
With the emergence of single-stage object algorithm, to some extent, it meets the requirements of fast and efficient detection. Liu et al. [8] put forward the Single Shot MultiBox Detector (SSD) model. This network structure adapts to different sizes of objects by combining feature maps with various resolutions, which improves the detection accuracy and makes the training simpler. RetinaNet and YOLO series, both have good prospects in object detection and recognition. Currently, grapes [5], tomatoes [9], corn [6] and so on have achieved good application results. Since the appearance of YOLO series, it has been very popular. For example, some new improvement ideas have been applied on the basis of YOLOv4, then YOLOv5 model has been proposed. YOLOv5 is faster, more accurate. YOLOv5 greatly reduces the memory occupation of the model while improving the running speed and accuracy of the model [8], meeting the needs of this study. The purpose of this study is to evaluate the recognition effect of YOLOv5 on the crop disease dataset, and to compare the effects of different network parameters (i.e. different pre-trained models) on the recognition of this study.
The rest of the article is organized as follows. The second session explains the source and production process of the used data set, the adopted methods and evaluation indexes, and the used hardware and software equipment. The experimental results will be in the third session, and the performance will be discussed in the fourth session. Finally, it is the conclusion and future research.
2. Materials and Methods
2.1. Datasets
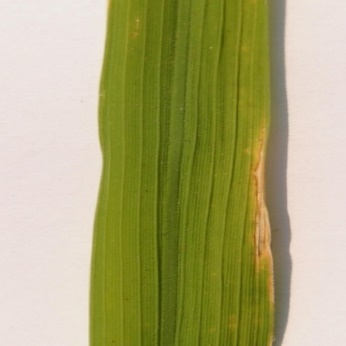
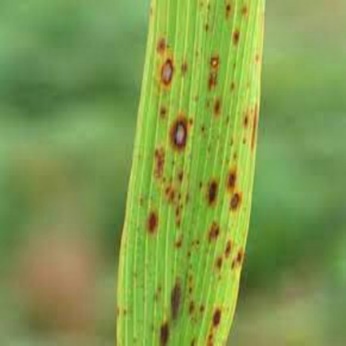
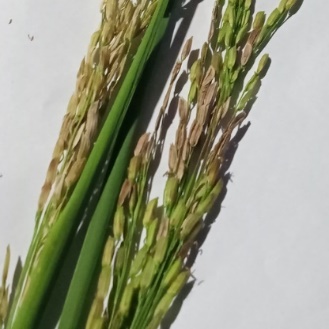
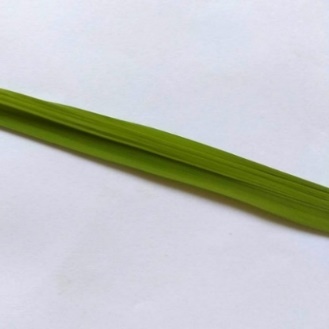
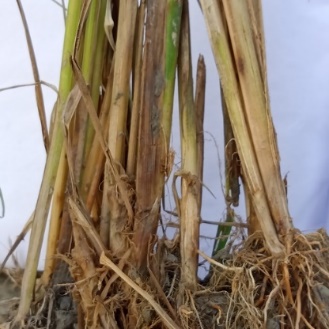
The data set used in our research comes from Kaggle [10-11], which is a free data set website. Nine kinds of pictures of crop diseases, including healthy crop pictures, were selected, and each kind contained a considerable number of images. In order to evaluate the performance of the proposed classification method based on YOLOv5 in crop disease classification, 2000 randomly selected labelled crop images were used as training data sets, which were divided into five categories. In this new data set, the image ratio of training set and testing set is 7: 1. Five categories of image data sets are shown in Fig.1, which are Bacterial leaf blight, Brown spot, Healthy, Apex blast, Gudi rotten. These image samples are extracted from the data set, which is understandable and helpful to improve the segmentation and classification results. The original resolution of the data set is 1600x1600. In order to better meet the limitation of research equipment, we adjusted the resolution to 512 x 512 pixels.
LabelImg [12] annotation tool is used to manually mark the diseased areas of leaves. The LabelImg tool is written in python, which is an open-source tool. It is very convenient for image calibration and labeling. This tool can be used to annotate images in various formats to obtain xml and txt files of training set and test set images, including image name, image size, object category name, object frame position and other data information. Transform image data into data information, modify data configuration files and model configuration files, and facilitate the test of self-made image data sets of crop diseases and insect pests.
(a) (b)
(c) (e) (d)
Figure 1. Four crop diseases and healthy crop leaves (Bacterial leaf blight (a), Brown spot (b), Healthy (c), Apex blast (d), Gudi rotten (e)).
2.2. The proposed algorithm for crop disease classification
At present, there are many algorithms or models about object detection, including Faster R-CNN [13], SSD [14] and YOLO [15-17]. In this article, YOLOv5 will be used as the object detection algorithm to conduct relevant experiments.
2.2.1. Overview of the framework
YOLOv5 network is considered to have the advantages of high detection accuracy, lightweight attributes and fast recognition speed. The application of YOLOv5-based model in the process of crop disease identification can be summarized as follows: As the input image, the image of crop disease will first pass through the focus module, and the image will be sliced. CSPDarknet is used as the backbone to extract rich information features from the input image. Then it will go through the structure of FPN+PAN to obtain stronger semantic features and location information. The final output results will include bounding box, classification and confidence level. The network structure of YOLOv5 can be divided into four parts: input, backbone, neck and prediction, as shown in the Fig.2 below.
The input end includes mosaic data enhancement, image size processing and adaptive anchor box calculation. Mosaic is a reference method for CutMix data enhancement proposed at the end of 2019, but CutMix only uses two images for stitching, while Mosaic data enhancement uses four images. In YOLO algorithm, for different data sets, there will be anchor frames with initial set length and width. In each training, the best anchor box is adaptively calculated according to the name of the dataset, and it is uniformly scaled to the standard size. In YOLOv5, the Focus module slices the picture before it enters the backbone, and obtains the double down-sampling feature map without information loss.
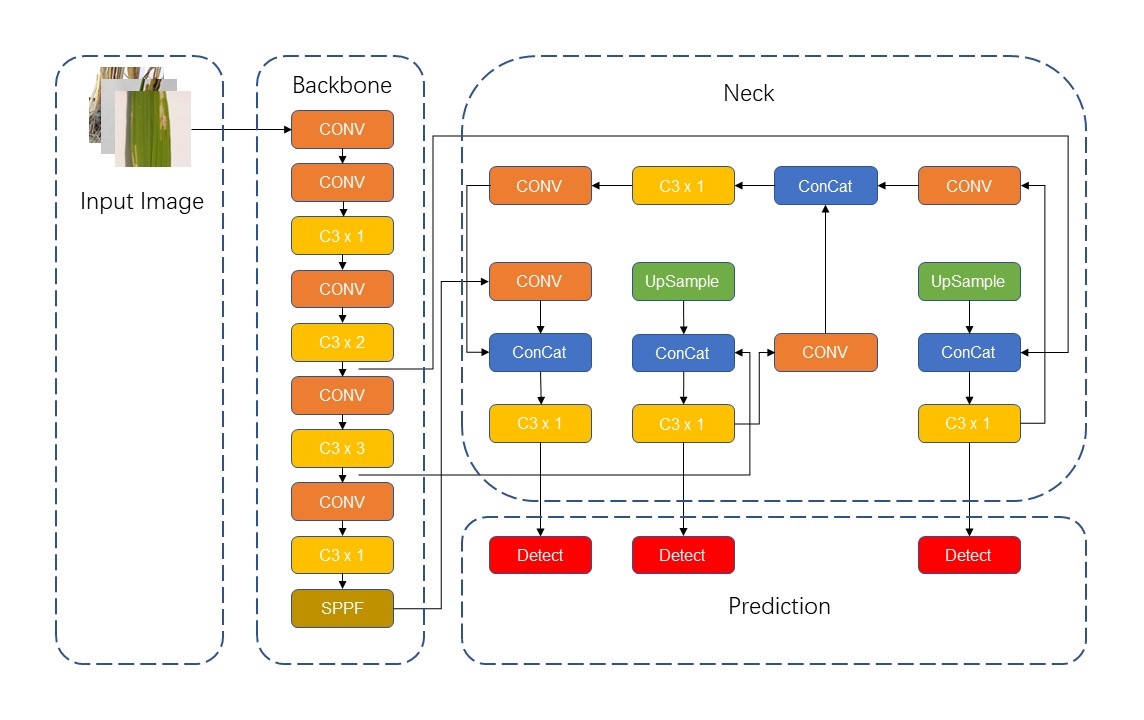
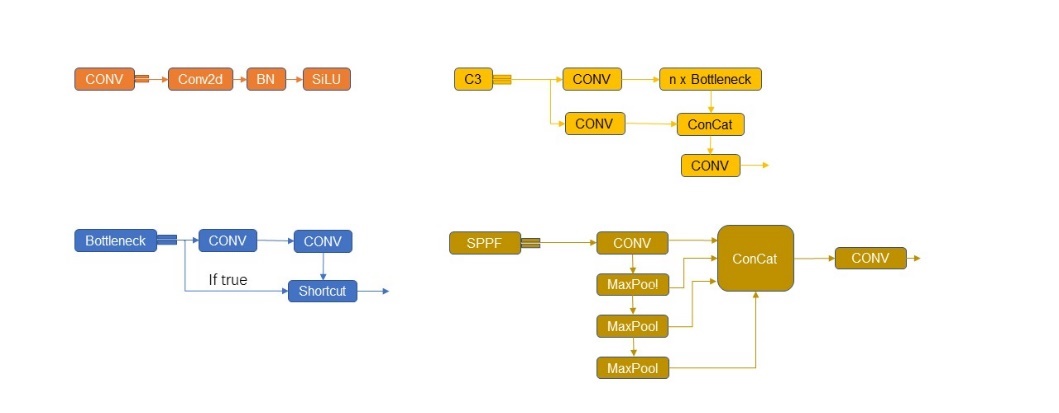
Figure 2. Structure of YOLOv5 network.
2.2.2. Backbone layer
Backbone layer: YOLOv5 uses CSPDarknet as the Backbone to extract rich information features from the input image. CSPDarknet solves the problem of repeated gradient information of network optimization in other large convolutional neural network framework Backbone, and integrates the gradient changes into the feature graph from beginning to end, thus reducing the parameters and FLOPS values of the model, ensuring the reasoning speed and accuracy, and reducing the size of the model. CSPDarknet53 contains five CSP modules, and swish activation function is used in the Backbone. CSP structure, its original intention is to reduce the amount of calculation and enhance the performance of gradient. The main idea of CSP_1 module is: before entering the block, the input is divided into two parts, one of which is calculated by the block, and the other part is directly concatenate by a shortcut. This structure can enhance CNN's learning ability, keep its accuracy while reducing its weight, reduce the bottleneck of calculation and reduce the memory cost.
2.2.3. Neck layer
Neck layer: The neck layer of YOLOv5 adopts SPP module and FPN+PAN structure [18]. FPN is like this, the top-down pattern, which passes down the high-level features. FPN is to transfer the deep semantic features to the shallow ones, so as to enhance the semantic expression on multiple scales. PAN, on the other hand, transmits the positioning information from the shallow layer to the deep layer, and enhances the positioning ability on multiple scales. SPP can improve the receptive field of the network by converting any feature map into a fixed size feature vector [19]. Compared with CSP_1, CSP_2 module removes the residual error and uses the original CBS, which is mainly used in the neck stage to strengthen the ability of network feature fusion.
2.2.4. Prediction layer
Prediction layer: YOLOv5 loss functions include classification loss, localization loss and confidence loss. CIOU Loss is used as the loss of bounding box regression. CIOU_LOSS is improved on the basis of IOU_LOSS, GIOU_LOSS and DIOU_Loss. GIOU_Loss increases the intersection scale, which introduces the minimum circumscribed rectangle and the difference set between circumscribed rectangle and union [20]. CIOU_Loss uses the weighted NMS method to screen the target box, which has a better classification effect for the occluded overlapping objects.
2.3. Evaluation metrics
2.3.1. Accuracy
The accuracy of classification is calculated by dividing the number of correct predictions by the total number of accurate predictions. The classification results given by the algorithm usually include four cases: T, F, P, N. TP represents the number of positive samples that are correctly identified, and FP is the number of false positive negative samples. TN is the number of negative samples correctly identified, while FN is the number of positive samples missed.
Accuracy=TP+TNTP+TN+FP+FN×100% (1)
2.3.2. Precision
Precision describes the inconsistency found when using the same instrument, which is characterized by the ratio of the number of correct objects detected to the number of correct objects in the sample.
Precision=TPTP+FP×100% (2)
2.3.3. Recall
The recall rate (R) is another important index, which refers to the ratio of the number of correct objects detected to the number of objects in the sample.
Recall=TPTP+FN×100% (3)
2.3.4. F1 score
Therefore, it is necessary to balance the relationship among accuracy, precision and recall when optimizing the algorithm. In order to comprehensively evaluate the performance of the algorithm, F1 value is introduced. F1 value is a well-known index that combines precision and recall, called F1 score, which is defined as:
F1=2(Precision×Recall)Precision+Recall×100% (4)
When the value of F1 is high, this test method is more effective.
2.4. Experimental setup
The framework of deep learning is PyTorch 1.7.0. The experiment was run on AutoDL's cloud server, with an Intel (R) Xeon (R) Platinum 8255C CPU with a basic frequency of 2.5 GHz, 30 GB RAM, Nvidia GeForce RTX 3090 graphics card and CUDA 11.0.
3. Results and discussion
3.1. The model training
This paper will use pre-trained models with different parameters. According to the depth and width of the network structure, YOLOv5 has four main pre-trained models: Yolov5s, Yolov5m, Yolov5l and Yolov5x. This paper had carried out relevant experiments based on four pre-trained models of YOLOv5, and warm-up was used to train the learning rate of all experiments in this paper, which can avoid model oscillation caused by high initial learning rate during model training. The batch size for training was 16, the epoch was 500, the learning rate was 0.01. According to the final experimental results, conclusions can be drawn: with the increase of the number of epoch iterations, the accuracy of training will gradually rise, and tend to be stable and convergent, finally reaching about 99% accuracy. YOLOv5 model used SGD algorithm to optimize the model. An important parameter of SGD algorithm is the learning rate. The goal of this algorithm is to search the global minimum of the objective function. In practical operation, it is necessary to gradually reduce the learning rate over time.
The training process of each YOLO model was carried out by using the configuration provided. In order to verify the performance of the four YOLOv5 pre-trained models, precision, recall, Mean Average Precision (mAP), average detection processing time, FLOPs and model size are taken as measurement indicators. The best results of the mAP values of the four YOLOv5 models all reach or approach the level of about 99.0%, which means the discrimination in the training set used is not obvious.
3.2. Analysis of testing results
This section mainly analyzes the experimental results from two aspects: quantitative analysis and qualitative analysis.
3.2.1. Quantitative analysis
The trend of mAP of the four pre-trained models is roughly the same. In the first 100 epochs, the accuracy rate rises rapidly with great ups and downs, and the curve oscillation gradually decreases at 200-300 epochs, and then tends to be stable after 350 epochs, reaching convergence. It can be found from Fig.3 that the upward trend of Yolov5x is more obvious and rapid, and it converges faster than the other three pre-trained models. Correspondingly, the rising trend of Yolov5m is slow, with obvious oscillation in the first 100 epochs, and the convergence time is the slowest among the four models. The Yolov5s and Yolov5l models show similar curves and convergence times. According to the size and the number of test parameters of the four models, the results show that with the increase of model size, the training time becomes longer and the convergence time becomes later, but the accuracy of the results increases.
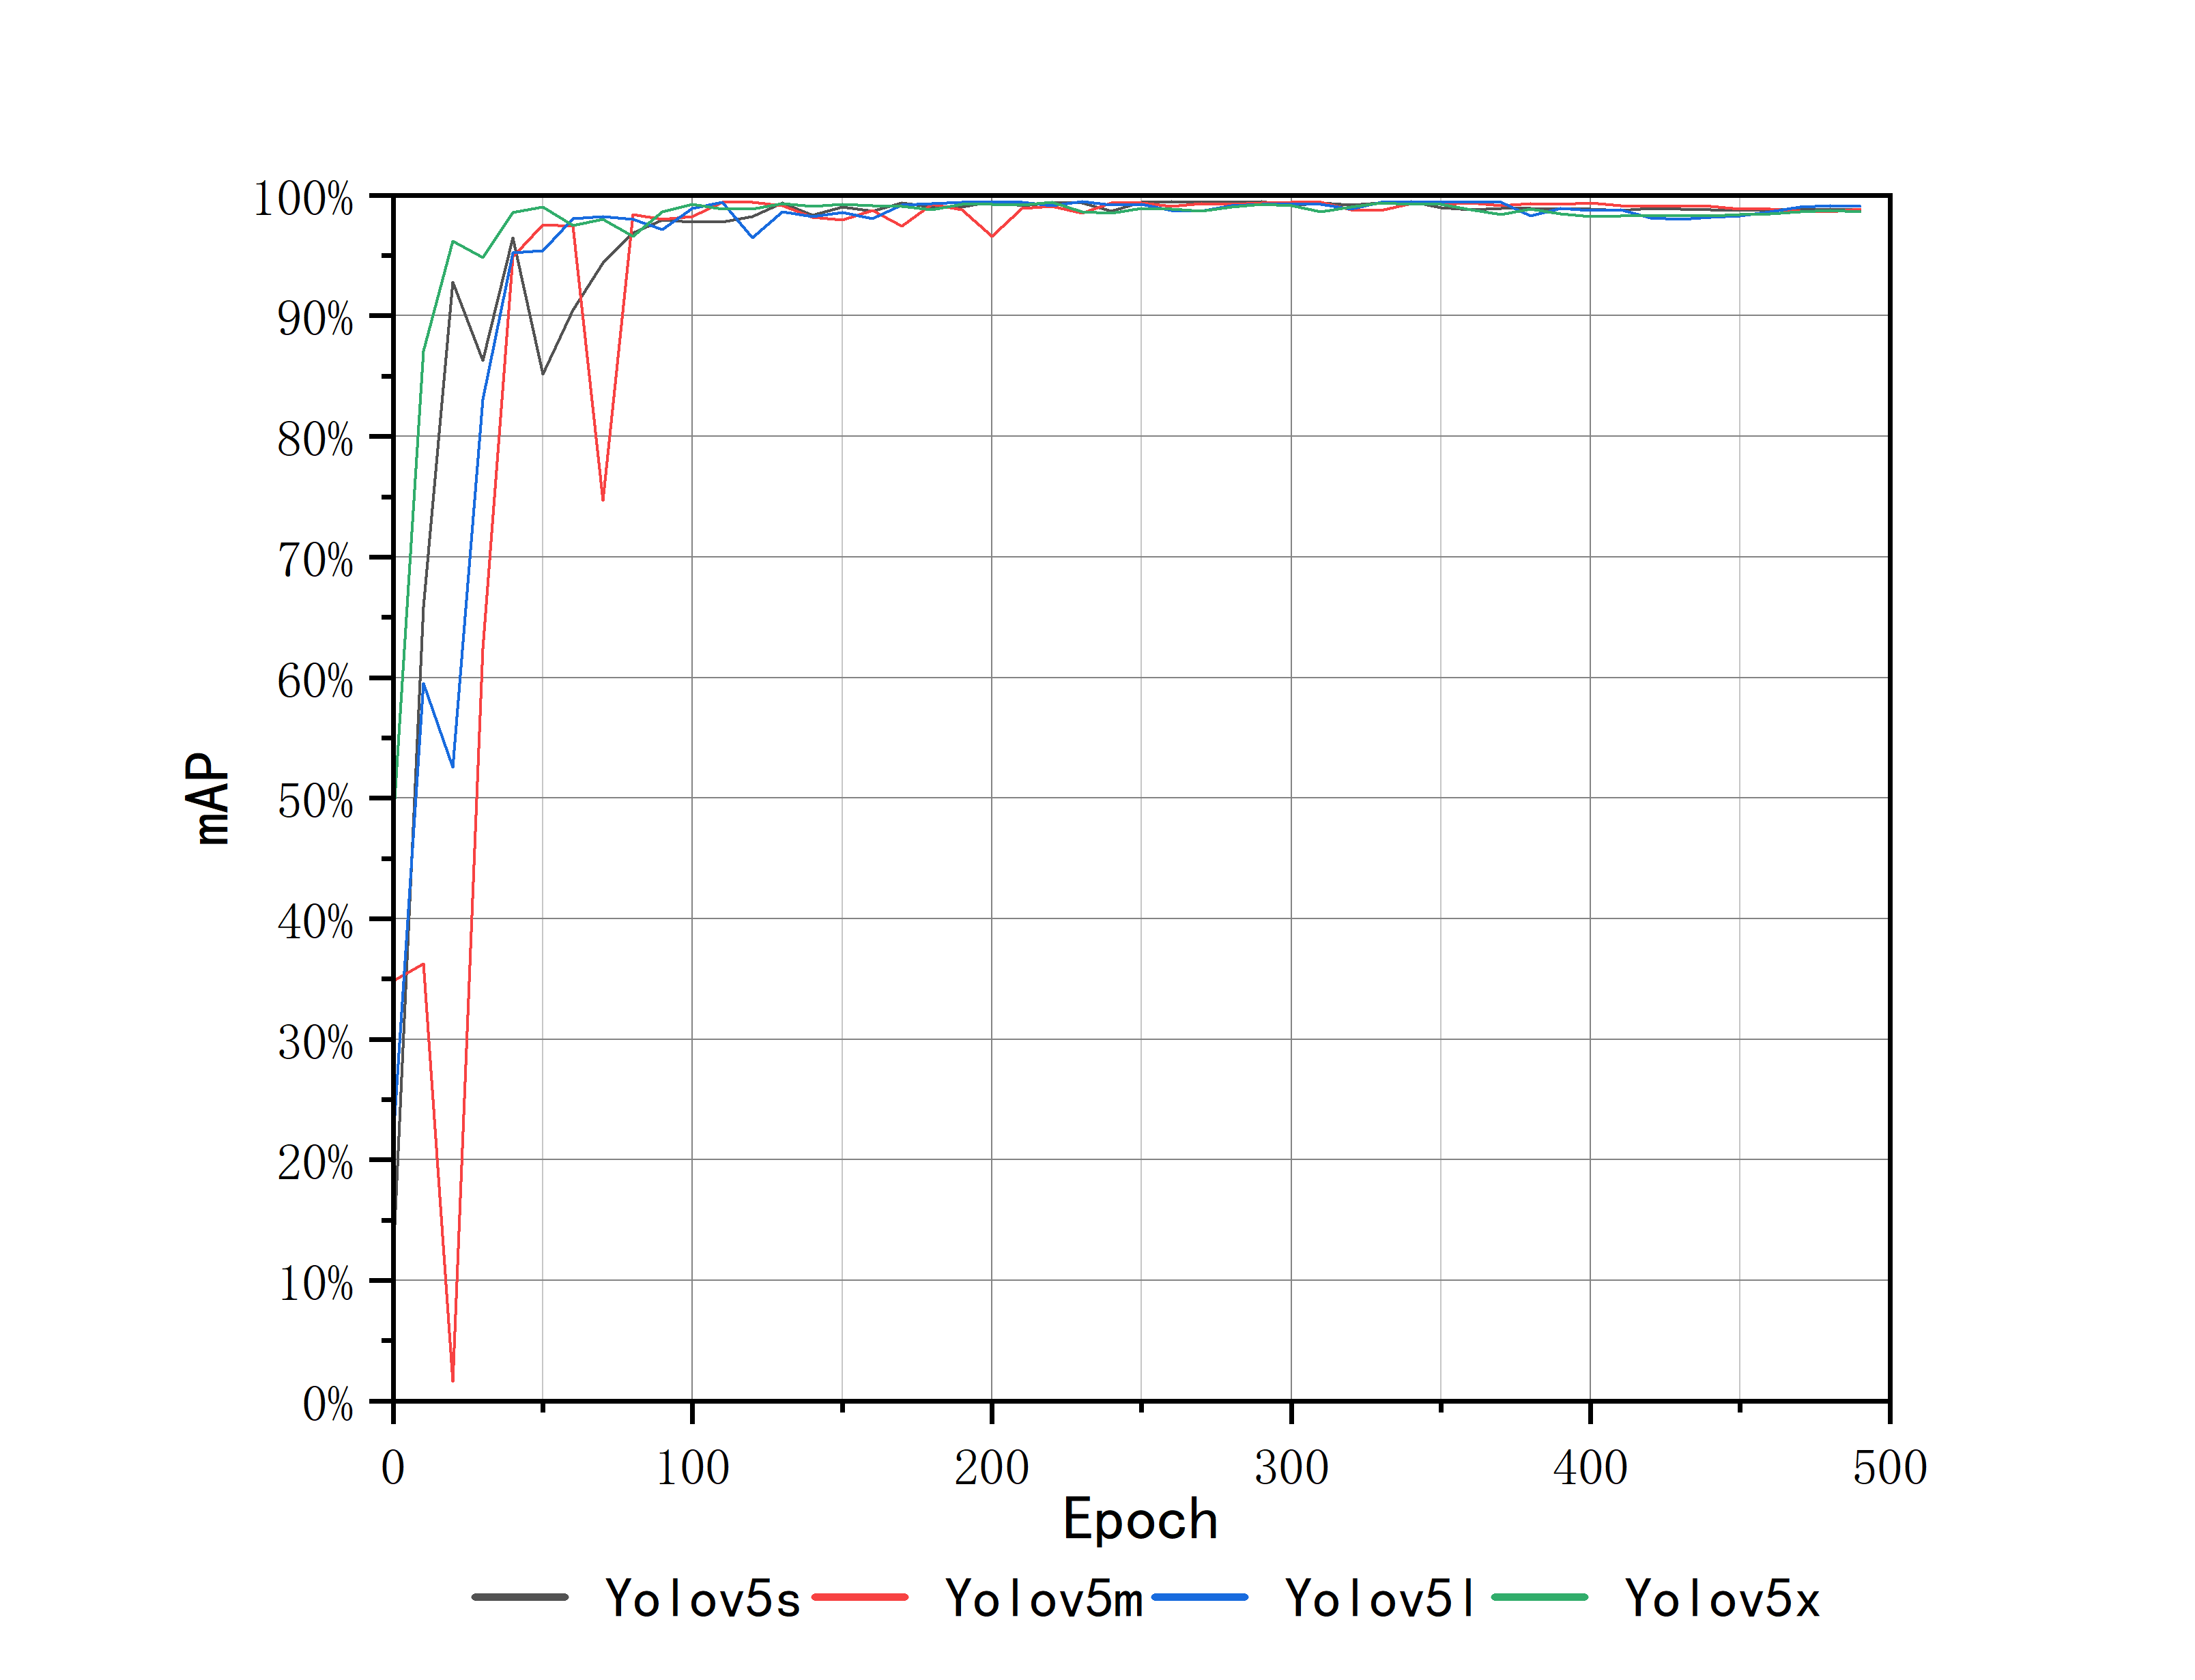
Figure 3. mAP during the training process.
The test results are shown in Fig.4. The performance of YOLOv5 model is evaluated by comparing operation time, loss function, precision (P), recall (R), F1 score (F1) and other indicators. The results are shown in Table 1.

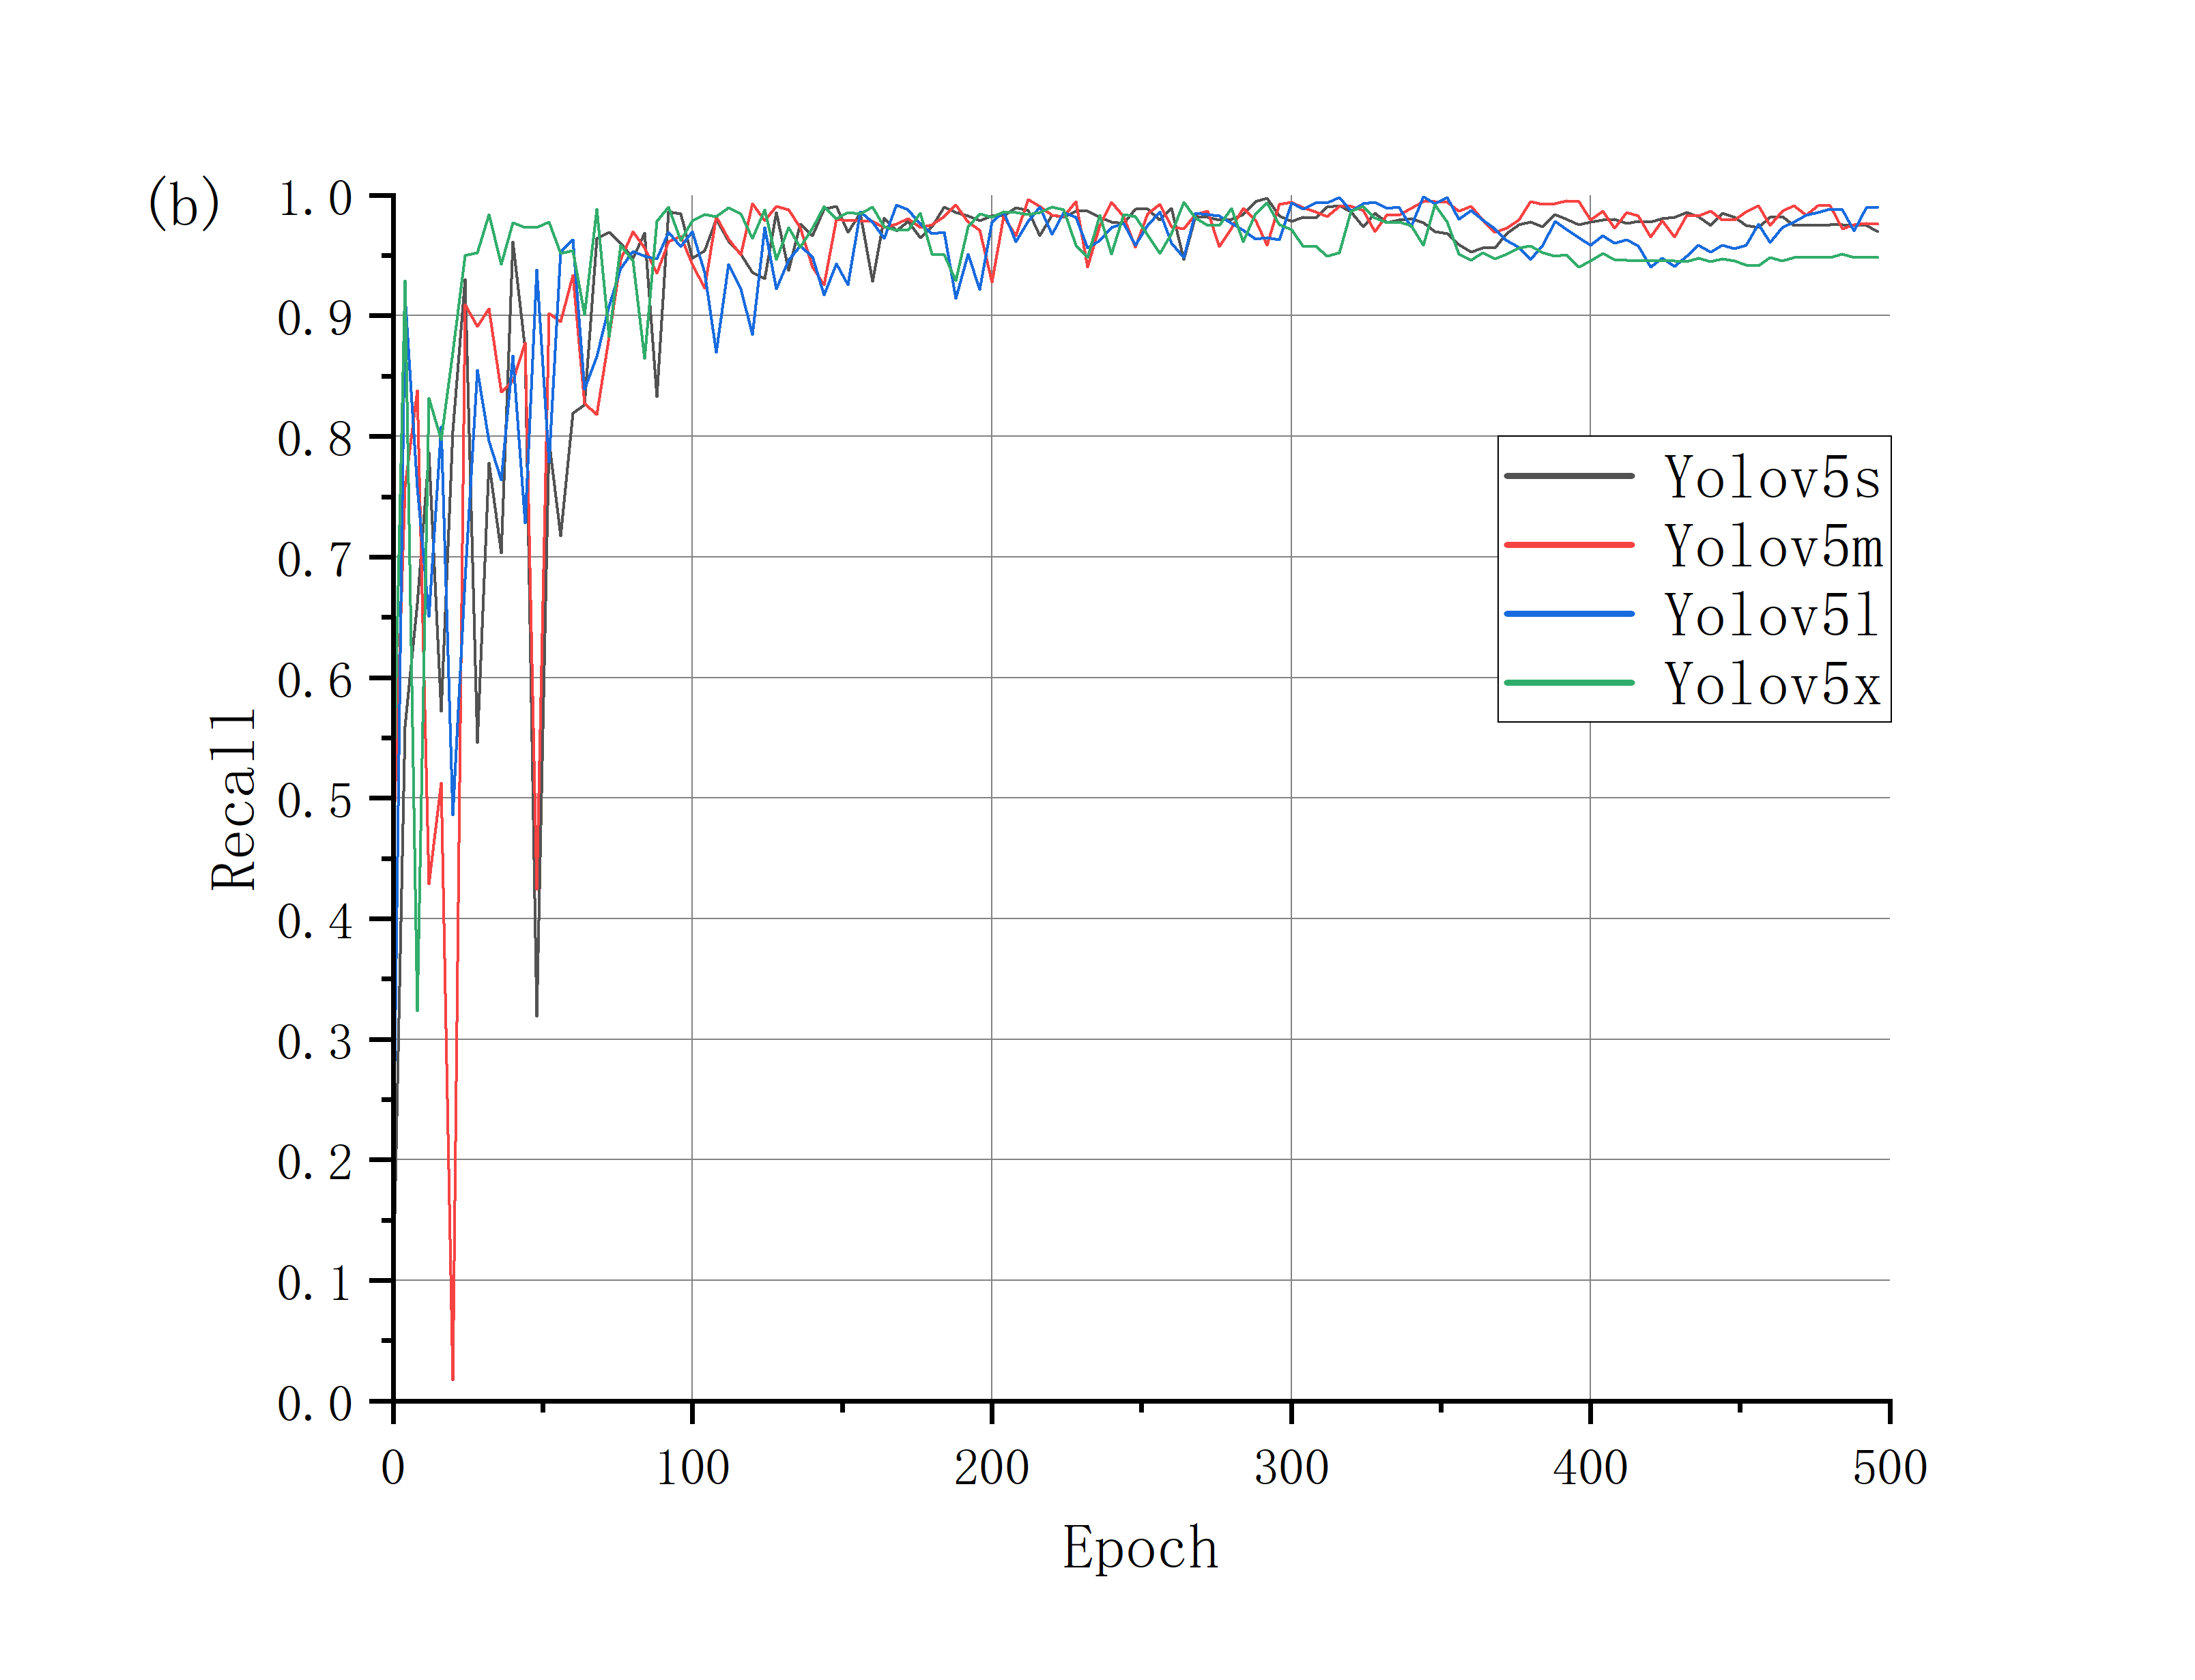
Figure 4. Precision curve and recall curve of four models.
Table 1. Quantitative results of the testing process.
Models | Training Time (h) | mAP | Precision | Recall | F1-Score |
Yolov5s | 2.733 | 98.80% | 0.921 | 0.954 | 0.937 |
Yolov5m | 4.305 | 98.80% | 0.939 | 0.946 | 0.942 |
Yolov5l | 7.003 | 99.00% | 0.945 | 0.955 | 0.950 |
Yolov5x | 14.306 | 98.60% | 0.952 | 0.975 | 0.963 |
Taking Yolov5s and Yolov5x models as examples, it can be found that the training time of ylov5s is 2.7h, which is the fastest, and the precision, recall rate and F1 value are 0.921, 0.954 and 0.937, respectively. The precision has stabilized at 92%, which is an ideal result. The four indexes of Yolov5x are 14.3h, 0.952, 0.975 and 0.963. When the training time is twice that of Yolov5l, it is not obviously ahead of the key indicators, and the final accuracy is almost the same as Yolov5s.
Table 2. Model related parameters.
Models | FLOPs | Parameters | Modelsize |
Yolov5s | 16.0G | 7033114 | 13.8MB |
Yolov5m | 48.3G | 20887482 | 40.3MB |
Yolov5l | 108.3G | 46159834 | 88.6MB |
Yolov5x | 204.7G | 86244730 | 165.3MB |
It can be seen from Table 2 that when comparing Yolov5s network structure with Yolov5x, the average detection processing time of the former significantly decreases, and the number of FLOPs and model parameters decreases by 92.2% and 91.8%. However, the accuracy of the model decreased by 3.1%. After using Yolov5s model, the average detection processing time is slightly reduced. Compared with Yolov5l, the number of FLOPs and model parameters are increased by 89.0% and 86.8% respectively. However, the model accuracy is reduced by 0.7%.
In contrast, the average detection processing time of Yolov5m increased slightly, and the number of FLOPs and parameters decreased respectively compared with Yolov5l, but the accuracy of the model did not decline dramatically, only 0.6%. Although the average model detection processing time is slightly increased compared with Yolov5s, and the model accuracy is improved by 1.8% compared with Yolov5s.
From the above comparison results, Yolov5s model can achieve high recognition accuracy in a short time, and has a wide application prospect. While other models have different trade-offs in time and accuracy, which can be determined according to the actual use. From the analysis results, some facts can be found: (1) The size of the optimized lightweight model is 13.8 MB, indicating that the optimized model greatly saves memory usage. (2) The average operation time of images under Yolov5s model is 9 milliseconds, 57.14% faster than other Yolov5x models, indicating that the lightweight model improves the operation speed. (3) The precision, recall rate and FI score of Yolov5x model used for disease classification were 95.2%, 97.5% and 96.3% respectively, which were 3.1%, 2.1% and 2.8% higher than the original Yolov5s model, respectively. This shows that Yolov5x model has better classification ability and has obvious advantages in accuracy, which can meet the needs of crop disease detection and classification.
Yolov5s model is the smallest one and the detection speed is the fastest; Yolov5x detects the most parameters and has the best accuracy. These models have high recognition accuracy and reasoning speed. Moreover, the weight file of YOLOv5 object detection network model is very small, nearly 90% smaller than YOLOv4, which indicates that YOLOv5 model is suitable for deploying to embedded devices to realize instantaneous detection.
3.2.2. Qualitative analysis
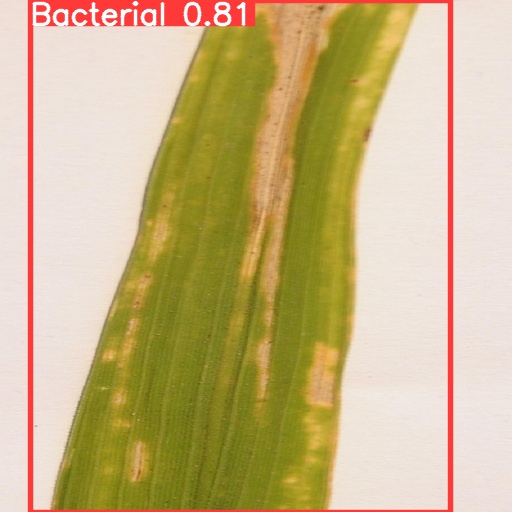
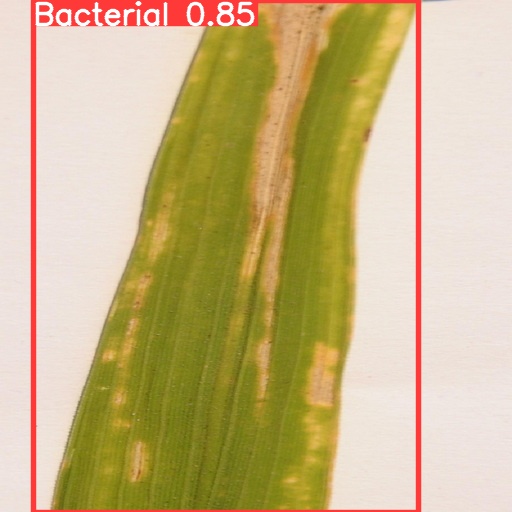
In order to show the results of recognition and classification more clearly, this paper visualizes the differences between different training models and compares the results. At the same time, the recognition effects of different types of crop diseases were visualized and compared. As shown in Fig.5, the four models have achieved high degree of confidence and precision, and the difference is not particularly large. It can be found from the results that the degree of confidence of Yolov5s is the lowest, only 0.73; Yolov5x has the highest degree of confidence, reaching 0.85, which indicates to some extent that with the increase of image complexity, Yolov5x, a model with more training parameters, has greater advantages.


(a) (b)
(c) (d)
Figure 5. Comparison of recognition results of four models for the same image: (a) Yolov5s, (b) Yolov5m, (c) Yolov5l, (d) Yolov5x.
In the following two tables (Table 3 and Table 4), it can be found that both Yolov5s and Yolov5x models have achieved high recognition accuracy of 99.2% and 99.6% respectively. The confidences of five categories show that Yolov5 model has the best performance in the identification of two diseases, Bacial leaf blight and Gudi rotten, and the lowest confidence in the health category. Similar results are also obtained in other models. Through the analysis of the detected images, the reasons for this are as follows: the detected images are highly similar to other categories, and there are some differences with other images in this category. In other words, under the current learning mode of YOLOv5, there will still be some images that cannot be recognized accurately, which may require more detailed classification and longer training period. But for some images with large discrimination, Yolov5s as a small model can efficiently identify, which can maintain high accuracy and achieve faster recognition speed.
Table 3. Confidence of Yolov5s models for the five categories.
[0.95,1] | [0.90,0.94] | [0.85,0.89] | [0.80,0.84] | [0,0.79] | Error | |
Bacterial | 25 | 18 | 4 | 0 | 3 | 0 |
Brown spot | 7 | 18 | 6 | 7 | 10 | 2 |
Health | 0 | 10 | 6 | 6 | 28 | 0 |
Apex blast | 0 | 7 | 17 | 10 | 16 | 0 |
Gudi rotten | 48 | 2 | 0 | 0 | 0 | 0 |
Table 4. Confidence of Yolov5x models for the five categories.
[0.95,1] | [0.90,0.94] | [0.85,0.89] | [0.80,0.84] | [0,0.79] | Error | |
Bacterial | 31 | 16 | 1 | 2 | 0 | 0 |
Brown spot | 11 | 15 | 8 | 7 | 8 | 1 |
Health | 0 | 12 | 7 | 7 | 24 | 0 |
Apex blast | 0 | 21 | 6 | 6 | 17 | 0 |
Gudi rotten | 42 | 8 | 0 | 0 | 0 | 0 |
However, some weaknesses occurred based on the experimental results: Firstly, a method need to be developed that can improve the recognition rate of crop images with complex background; Secondly, future research should consider more factors, such as crop varieties and different growth stages; The third point is that the perspective of the image acquisition. Therefore, images from different perspectives will be used for evaluation in future research.
Images in the same category will have subtle differences, but there will be some errors based on the existing models. For this case, it is recommended to use the attention mechanism [21] and integrate it into YOLOv5. Attention mechanism can help the model to give different weights to each part of the input, extract more critical and important information, and make the model make more accurate judgments. At the same time, it will not bring more overhead to the calculation and storage of the model, which is why attention mechanism is widely used.
4. Conclusion
Object detection represents that the application of deep learning in the agricultural field is very promising and can solve many problems in the agricultural field, including the identification of diseases and the estimation of crop yield. In this study, four versions of YOLOv5 model were trained and evaluated for detection in crop leaves. YOLOv5 network model is optimized by learning the mechanism of human visual attention [21], which can effectively extract the key features of detection objects. Observing the structural deformation of leaf images is usually an important basis for judging crop disease detection. The training model used in this paper firstly detects leaf regions by locating them using segmentation methods. Similarly, the data set used in this paper also adopts several representative types of crop diseases, which have certain representativeness.
According to the existing experimental results, with the increase of the training epoch, the final convergence value of the mAP will be basically stable at a value, and the four models are 0.988, 0.989, 0.990 and 0.986 respectively. Although there is no obvious difference, it shows that YOLOv5 algorithm can basically identify accurately under the data set used in this paper. There are only 1 or 2 recognition errors for the four models in the test set, which is very satisfactory. Yolov5s model is the smallest of the four detection models in this paper, which can achieve nearly 90% accuracy in a relatively short training time, and is a good choice for many simple object detections.
In the future, this kind of research will be extended to multiple disease detection, disease location and disease severity estimation of other crops. You can also develop real-time monitoring systems based on the Internet of Things, develop websites and launch mobile applications. Due to the development, popularity and convenience of mobile devices, future work will consider lightweight models and implant them into mobile devices (even including some robots).
References
[1]. Jagan K, Balasubramanian M, Palanivel S.: Detection and Recognition of Diseases from Paddy Plant Leaf Images[J]. International Journal of Computer Applications, 144(12):34-41(2016).
[2]. H. Waghmare, R. Kokare, Y. Dandawate, Detection and classification of diseases of Grape plant using opposite colour Local Binary Pattern feature and machine learning for automated Decision Support System, 2016 3rd International Conference on Signal Processing and Integrated Networks (SPIN), pp. 513-518(2016).
[3]. Mohammadpoor M, Nooghabi M G, Ahmedi Z. An Intelligent Technique for Grape Fanleaf Virus Detection[J]. International Journal of Interactive Multimedia and Artificial Intelligence, InPress(InPress):1(2020).
[4]. Atanassova S, Nikolov P, Valchev N, et al. Early detection of powdery mildew (Podosphaera xanthii) on cucumber leaves based on visible and near-infrared spectroscopy[C]// 10th Jubilee International Conference of the Balkan Physical Union (2019).
[5]. Zhu J, Wu A, Wang X, et al. Identification of grape diseases using image analysis and BP neural networks[J]. Multimedia Tools and Applications (2019).
[6]. K. P. Ferentinos, Deep learning models for plant disease detection and diagnosis, Computers and Electronics in Agriculture, vol. 145, pp. 311318 (2018).
[7]. H. A. Atabay, Deep residual learning for tomato plant leaf disease identification, Journal of Theoretical & Applied Information Technology, vol. 95(24) (2017).
[8]. Liu, W. Anguelov, D.; Erhan, D.; Szegedy, C.; Reed, S.; Cheng-Yang, F.; Berg, A.C. SSD: Single Shot MulfiBox Detector. In European Conference on Computer Vision; pp. 21–37. Springer: Cham, Switzerland (2016).
[9]. Wang, H.; Shang, S.; Wang, D.; He, X.; Feng, K.; Zhu, H. Plant Disease Detection and Classification Method Based on the Optimized Lightweight YOLOv5 Model. Agriculture 2022, 12, 931 (2022).
[10]. Kaggle web, https://www.kaggle.com/datasets/nurnob101/rice-disease,last accessed 2022/09/14
[11]. Kaggle web, https://www.kaggle.com/datasets/adefiqri12/riceleafsv3, last accessed 2022/09/14
[12]. labelImg web, https://github.com/heartexlabs/labelImg, last accessed 2022/08/14
[13]. Ren S, He K, Girshick R, et al. Faster r-cnn: Towards real-time object detection with region proposal networks[J]. Advances in neural information processing systems, 28 (2015).
[14]. Wei L, Dragomir A, Dumitru E, et al. SSD: Single Shot MultiBox Detector[J]. Springer, Cham (2016).
[15]. J. Redmon, S. Divvala, R. Girshick and A. Farhadi, You Only Look Once: Unified, Real-Time Object Detection, 2016 IEEE Conference on Computer Vision and Pattern Recognition (CVPR), pp. 779-788 (2016).
[16]. J. Redmon and A. Farhadi, "YOLO9000: Better, Faster, Stronger," 2017 IEEE Conference on Computer Vision and Pattern Recognition (CVPR), pp. 6517-6525 (2017).
[17]. Redmon J, Farhadi A. Yolov3: An incremental improvement. arXiv: 1804.02767 (2018).
[18]. Liu S, Qi L, Qin H, et al. Path Aggregation Network for Instance Segmentation[C]// 2018 IEEE/CVF Conference on Computer Vision and Pattern Recognition (CVPR). IEEE (2018).
[19]. Dong-Yan Zhang, Han-Sen Luo, Dao-Yong Wang, Xin-Gen Zhou, Wei-Feng Li, Chun-Yan Gu, Gan Zhang, Fang-Ming He, Assessment of the levels of damage caused by Fusarium head blight in wheat using an improved YoloV5 method, Computers and Electronics in Agriculture, Vol. 198 (2022).
[20]. Jiangtao Qi, Xiangnan Liu, Kai Liu, Farong Xu, Hui Guo, Xinliang Tian, Mao Li, Zhiyuan Bao, Yang Li, An improved YOLOv5 model based on visual attention mechanism: Application to recognition of tomato virus disease, Computers and Electronics in Agriculture, Vol. 194 (2022).
[21]. Bahdanau, D., Cho, K., & Bengio, Y. Neural machine translation by jointly learning to align and translate. Computer Science (2014).
Cite this article
Ding,Q. (2023). Crop disease recognition based on the YOLOv5 and transfer learning. Applied and Computational Engineering,13,46-57.
Data availability
The datasets used and/or analyzed during the current study will be available from the authors upon reasonable request.
Disclaimer/Publisher's Note
The statements, opinions and data contained in all publications are solely those of the individual author(s) and contributor(s) and not of EWA Publishing and/or the editor(s). EWA Publishing and/or the editor(s) disclaim responsibility for any injury to people or property resulting from any ideas, methods, instructions or products referred to in the content.
About volume
Volume title: Proceedings of the 5th International Conference on Computing and Data Science
© 2024 by the author(s). Licensee EWA Publishing, Oxford, UK. This article is an open access article distributed under the terms and
conditions of the Creative Commons Attribution (CC BY) license. Authors who
publish this series agree to the following terms:
1. Authors retain copyright and grant the series right of first publication with the work simultaneously licensed under a Creative Commons
Attribution License that allows others to share the work with an acknowledgment of the work's authorship and initial publication in this
series.
2. Authors are able to enter into separate, additional contractual arrangements for the non-exclusive distribution of the series's published
version of the work (e.g., post it to an institutional repository or publish it in a book), with an acknowledgment of its initial
publication in this series.
3. Authors are permitted and encouraged to post their work online (e.g., in institutional repositories or on their website) prior to and
during the submission process, as it can lead to productive exchanges, as well as earlier and greater citation of published work (See
Open access policy for details).
References
[1]. Jagan K, Balasubramanian M, Palanivel S.: Detection and Recognition of Diseases from Paddy Plant Leaf Images[J]. International Journal of Computer Applications, 144(12):34-41(2016).
[2]. H. Waghmare, R. Kokare, Y. Dandawate, Detection and classification of diseases of Grape plant using opposite colour Local Binary Pattern feature and machine learning for automated Decision Support System, 2016 3rd International Conference on Signal Processing and Integrated Networks (SPIN), pp. 513-518(2016).
[3]. Mohammadpoor M, Nooghabi M G, Ahmedi Z. An Intelligent Technique for Grape Fanleaf Virus Detection[J]. International Journal of Interactive Multimedia and Artificial Intelligence, InPress(InPress):1(2020).
[4]. Atanassova S, Nikolov P, Valchev N, et al. Early detection of powdery mildew (Podosphaera xanthii) on cucumber leaves based on visible and near-infrared spectroscopy[C]// 10th Jubilee International Conference of the Balkan Physical Union (2019).
[5]. Zhu J, Wu A, Wang X, et al. Identification of grape diseases using image analysis and BP neural networks[J]. Multimedia Tools and Applications (2019).
[6]. K. P. Ferentinos, Deep learning models for plant disease detection and diagnosis, Computers and Electronics in Agriculture, vol. 145, pp. 311318 (2018).
[7]. H. A. Atabay, Deep residual learning for tomato plant leaf disease identification, Journal of Theoretical & Applied Information Technology, vol. 95(24) (2017).
[8]. Liu, W. Anguelov, D.; Erhan, D.; Szegedy, C.; Reed, S.; Cheng-Yang, F.; Berg, A.C. SSD: Single Shot MulfiBox Detector. In European Conference on Computer Vision; pp. 21–37. Springer: Cham, Switzerland (2016).
[9]. Wang, H.; Shang, S.; Wang, D.; He, X.; Feng, K.; Zhu, H. Plant Disease Detection and Classification Method Based on the Optimized Lightweight YOLOv5 Model. Agriculture 2022, 12, 931 (2022).
[10]. Kaggle web, https://www.kaggle.com/datasets/nurnob101/rice-disease,last accessed 2022/09/14
[11]. Kaggle web, https://www.kaggle.com/datasets/adefiqri12/riceleafsv3, last accessed 2022/09/14
[12]. labelImg web, https://github.com/heartexlabs/labelImg, last accessed 2022/08/14
[13]. Ren S, He K, Girshick R, et al. Faster r-cnn: Towards real-time object detection with region proposal networks[J]. Advances in neural information processing systems, 28 (2015).
[14]. Wei L, Dragomir A, Dumitru E, et al. SSD: Single Shot MultiBox Detector[J]. Springer, Cham (2016).
[15]. J. Redmon, S. Divvala, R. Girshick and A. Farhadi, You Only Look Once: Unified, Real-Time Object Detection, 2016 IEEE Conference on Computer Vision and Pattern Recognition (CVPR), pp. 779-788 (2016).
[16]. J. Redmon and A. Farhadi, "YOLO9000: Better, Faster, Stronger," 2017 IEEE Conference on Computer Vision and Pattern Recognition (CVPR), pp. 6517-6525 (2017).
[17]. Redmon J, Farhadi A. Yolov3: An incremental improvement. arXiv: 1804.02767 (2018).
[18]. Liu S, Qi L, Qin H, et al. Path Aggregation Network for Instance Segmentation[C]// 2018 IEEE/CVF Conference on Computer Vision and Pattern Recognition (CVPR). IEEE (2018).
[19]. Dong-Yan Zhang, Han-Sen Luo, Dao-Yong Wang, Xin-Gen Zhou, Wei-Feng Li, Chun-Yan Gu, Gan Zhang, Fang-Ming He, Assessment of the levels of damage caused by Fusarium head blight in wheat using an improved YoloV5 method, Computers and Electronics in Agriculture, Vol. 198 (2022).
[20]. Jiangtao Qi, Xiangnan Liu, Kai Liu, Farong Xu, Hui Guo, Xinliang Tian, Mao Li, Zhiyuan Bao, Yang Li, An improved YOLOv5 model based on visual attention mechanism: Application to recognition of tomato virus disease, Computers and Electronics in Agriculture, Vol. 194 (2022).
[21]. Bahdanau, D., Cho, K., & Bengio, Y. Neural machine translation by jointly learning to align and translate. Computer Science (2014).