


1. Introduction
Stock, one of the most profitable but also riskiest way to make fortune used to be regarded as random but now are scientifically analyzed and predicted. Long Short Term Memory (LSTM) is widely used in the fields of artificial intelligence and deep learning. This article will mainly focus on forming the basic stock forecasting algorithm in Python with LSTM and constructing a data set for stock of American multinational technology company. With this methodology, people can quickly obtain the precise indicator and result.
2. Methodology
In the dataset of American multinational technology company in 2019 [1], the stock information can be imported in the table with multiple variables in one dataset - date, high, low, close, revenue, profit, P/E and growth rate, etc. Date is the period needed to forecast. High and low indicate the highest and lowest prices of the stock that day. Income and profit show how much money was earned on the stock that day, minus the cost price. The price-earnings ratio and growth rate represent the percentage of the stock's gain and the percentage of money added in the market that day.
In the next step, to analyze the data and organize and classify the data, users first apply to the most basic machine learning algorithm, linear regression. Linear regression models generate an equation that determines the relationship between independent and dependent variables. It can be written as: y=θ1X1+θ2X2…..θnXn
x1, x2, ....xn represent independent variables, and coefficients θ1, θ2,....θn represent weights. Due to the large number of the independent variables, features using the time (date) column are extracted and then fitted to a linear regression model since date is the input.
To implement the analysis of the dataset, a program is created to sort the dataset in a certain order, and then generate a separate dataset. Separate datasets can help continue the next step without affecting other required data.
Then, the dataset can be applied in the LSTM algorithm in sequence prediction problems.
LSTM has three gates:
Input gates: Input gates add information to the cell state
forget gate: it removes information that the model no longer needs
Output gate: The output gate of the LSTM selects the information as the output
In LSTM, the information to omit is determined in the first step with the sigmoid function. It looks at the previous state (ht-1) and the current input xt and evaluates the function.
The second layer has two functions. The first is the sigmoid function and the second is the tanh function. The sigmoid function decides which values to let through (0 or 1). The tanh function assigns weights to the passed values, determining their level of importance, from -1 to 1.
The final step is to run a sigmoid layer to determine which parts of the cell state make it output. Then setting a value between -1 and 1 via the tanh function can be multiplied by the output of the sigmoid gate.
3. Results
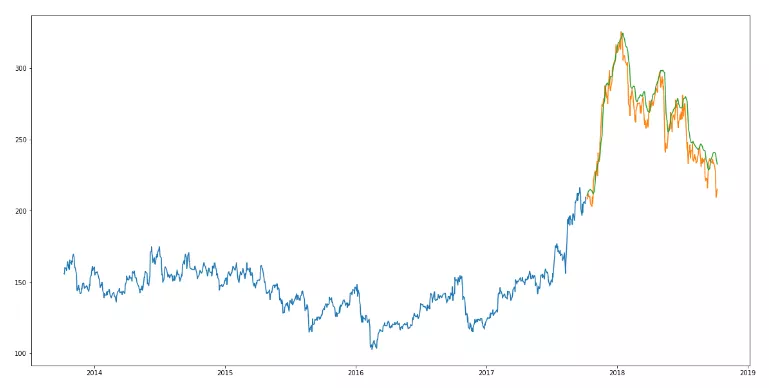
Figure 1. A figure name.
In the figure above, people can compare and contrast the results of the linear and LSTM algorithm. Since LSTM is known for its accurate prediction with numerous uncertain inputs [2], LSTM is obviously more in line with the actual trend. The LSTM model can adjust various parameters to make stock predictions more accurate. And because linear regression is too fixed, it will lead to some parameter changes that are very different from the parameters.
After comparing the predicted results, it can be found that at least the accuracy of the prediction is more than 50%. However, the LSTM prediction is generally lower than the actual. It might be the influence of randomness of market.
4. Discussion
With the analysis of stocks, it is not difficult to find that there is a big difference between linear regression and LSTM in the prediction of stocks. The reason for these differences is the randomness of the market including globalization and development in technology. Optimization of the parameters and development in better algorithm are necessary to better prediction [3].
Certain bias in LSTM algorithm has been discussed and improved by combining with other algorithm or adding more restrictions [4]. However, for beginners in the stock market, this model is a reliable source to obtain the result.
After fitting the model, the predicted trend can lead to the result. Then users can perform some analysis through the decision tree model and other methods, so that they can clearly see whether there is a problem with the data through the decision tree. Other forecasting techniques like Autoregressive integrated moving average (ARIMA)[5], Seasonal ARIMA (SARIMA)[6], and Prophet[7] are also useful in forecasting.
5. Conclusion
Time series forecasting is still developing, especially after the epidemic which greatly influence the global economy. And stock analysis is an extension of this field. When people use machine learning to analyze stocks, they can find that stocks have strong randomness and variability. Even so, making some simple predictions using methods like LSTM would at least give some advice when it comes to buying American multinational technology company stocks, especially useful for people who do not have a clue but want to make a purchase. The accuracy is high enough for people to make rational decision and the difference can be adjusted with further studies.
References
[1]. Google Stock Data | Kaggle
[2]. Kumar G, Singh UP, Jain S. An adaptive particle swarm optimization-based hybrid long short-term memory model for stock price time series forecasting. Soft comput. 2022;26(22):12115-12135. doi: 10.1007/s00500-022-07451-8. Epub 2022 Aug 26. PMID: 36043118; PMCID: PMC9415266.
[3]. Huang Y, Gao Y, Gan Y, Ye M. A new financial data forecasting model using genetic algorithm and long short-term memory network. Neurocomputing. 2021;425:207–218.
[4]. Fischer T, Krauss C. Deep learning with long short-term memory networks for financial market predictions. Eur J Oper Res. 2018;270(2):654–669.
[5]. Alwee R, Shamsuddin SM, Sallehuddin R. Hybrid support vector regression and autoregressive integrated moving average models improved by particle swarm optimization for property crime rates forecasting with economic indicators. ScientificWorldJournal. 2013 May 23;2013:951475. doi: 10.1155/2013/951475. PMID: 23766729; PMCID: PMC3677664.
[6]. Suradhaniwar S, Kar S, Durbha SS, Jagarlapudi A. Time Series Forecasting of Univariate Agrometeorological Data: A Comparative Performance Evaluation via One-Step and Multi-Step Ahead Forecasting Strategies. Sensors (Basel). 2021 Apr 1;21(7):2430. doi: 10.3390/s21072430. PMID: 33916026; PMCID: PMC8037998.
[7]. Crash Diagnosis and Price Rebound Prediction in NYSE Composite Index Based on Visibility Graph and Time-Evolving Stock Correlation Network
Cite this article
Wang,Y. (2023). The application of Long Short-Term Memory algorithm in American multinational technology company stock prediction. Applied and Computational Engineering,13,131-133.
Data availability
The datasets used and/or analyzed during the current study will be available from the authors upon reasonable request.
Disclaimer/Publisher's Note
The statements, opinions and data contained in all publications are solely those of the individual author(s) and contributor(s) and not of EWA Publishing and/or the editor(s). EWA Publishing and/or the editor(s) disclaim responsibility for any injury to people or property resulting from any ideas, methods, instructions or products referred to in the content.
About volume
Volume title: Proceedings of the 5th International Conference on Computing and Data Science
© 2024 by the author(s). Licensee EWA Publishing, Oxford, UK. This article is an open access article distributed under the terms and
conditions of the Creative Commons Attribution (CC BY) license. Authors who
publish this series agree to the following terms:
1. Authors retain copyright and grant the series right of first publication with the work simultaneously licensed under a Creative Commons
Attribution License that allows others to share the work with an acknowledgment of the work's authorship and initial publication in this
series.
2. Authors are able to enter into separate, additional contractual arrangements for the non-exclusive distribution of the series's published
version of the work (e.g., post it to an institutional repository or publish it in a book), with an acknowledgment of its initial
publication in this series.
3. Authors are permitted and encouraged to post their work online (e.g., in institutional repositories or on their website) prior to and
during the submission process, as it can lead to productive exchanges, as well as earlier and greater citation of published work (See
Open access policy for details).
References
[1]. Google Stock Data | Kaggle
[2]. Kumar G, Singh UP, Jain S. An adaptive particle swarm optimization-based hybrid long short-term memory model for stock price time series forecasting. Soft comput. 2022;26(22):12115-12135. doi: 10.1007/s00500-022-07451-8. Epub 2022 Aug 26. PMID: 36043118; PMCID: PMC9415266.
[3]. Huang Y, Gao Y, Gan Y, Ye M. A new financial data forecasting model using genetic algorithm and long short-term memory network. Neurocomputing. 2021;425:207–218.
[4]. Fischer T, Krauss C. Deep learning with long short-term memory networks for financial market predictions. Eur J Oper Res. 2018;270(2):654–669.
[5]. Alwee R, Shamsuddin SM, Sallehuddin R. Hybrid support vector regression and autoregressive integrated moving average models improved by particle swarm optimization for property crime rates forecasting with economic indicators. ScientificWorldJournal. 2013 May 23;2013:951475. doi: 10.1155/2013/951475. PMID: 23766729; PMCID: PMC3677664.
[6]. Suradhaniwar S, Kar S, Durbha SS, Jagarlapudi A. Time Series Forecasting of Univariate Agrometeorological Data: A Comparative Performance Evaluation via One-Step and Multi-Step Ahead Forecasting Strategies. Sensors (Basel). 2021 Apr 1;21(7):2430. doi: 10.3390/s21072430. PMID: 33916026; PMCID: PMC8037998.
[7]. Crash Diagnosis and Price Rebound Prediction in NYSE Composite Index Based on Visibility Graph and Time-Evolving Stock Correlation Network