


1. Introduction
Image classification is a widely recognized computer technology, mostly utilizing Convolutional Neural Networks (CNNs) for classification task. Within this domain, numerous sub-techniques have been developed, with human face recognition serving as a prominent branch of image classification. In contemporary society, human face recognition has gained significant popularity, which has huge potential in various areas. The machine will compare the human face with all samples stored in the database, akin to a matching task. In this case, emotion recognition based on the captured face images using image classification increasingly attracted much attention. Using images to extract features and carry out the prediction of human emotions. It has numerous potential applications in many domains. For instance, this technique can be considered in the psychology field. If psychologists can use it to monitor the emotions of patients, they can observe patients’ emotional records to judge their recovery level.
In the early field, image classification is limited to object recognition. Researchers utilized traditional machine learning models to carry out image classification task. Support Vector Machine (SVM) and Multi-layer Perceptron (MLP) are well-structured models in the machine learning field. In recent years, the scientific community has increasingly adopted CNNs and their variations for human face recognition tasks. For example, one study focused on the use of the CNN-20 architecture to develop both face recognition (FR) and Speaker recognition (SR) deep-CNN models [1]. In this article, the authors elaborate the co-compressed blended model and test its performance. The result showed that these co-compressed fused models have good performance and extract the common characteristics of FR and SR in the former areas. However, this article does not consider using other traditional models like SVM and MLP to compare the performance of different models. In [2], the author tries to add fuzzy rough set theory to the CNN algorithm to improve the facial recognition ability. Those studies show the potential of CNN algorithms in image classification. In this research [3], the author uses both one-dimensional CNN and a support vector machine to do the emotion recognition. Emotion recognition is a difficult task. However, it’s a meaningful technique. Facial emotion recognition (FER) helps people to explore the human’s inner mind or emotion through images or videos. In [3], the experimental result shows that the 1D-CNN and SVM classifiers implement a precision of 98.41% and 97.44% respectively. It’s a crucial comparison between different models. Moreover, feature extraction is a key point when researchers do emotion recognition. The classifier accuracy works well when there are three emotions that need to be recognized. However, if there are 7 emotions that need to be recognized, current feature extraction may not still work perfectly and achieve high accuracy.
This research focused on the effect that using various CNN architectures for the task of recognizing seven emotions. The CNN architecture models include MobileNet, VGG, and ResNet. The research maintained uniformity in the model training parameters while also incorporating image preprocessing techniques. The sole point of divergence resided in the model structure. Fundamentally, the model was constructed in three segments. The first section is one of the CNN architectures models (MobileNet, VGG, ResNet). The second section is one global average pooling layer. The third section is one dense layer with SoftMax as the activation function. According to the experimental results, it is possible to explore the best performance model structure on emotion recognition.
2. Methodology
2.1. Dataset description and preprocessing
In this research, a dataset that collects abundant human facial expressions called FER-2013 from Kaggle was employed [4]. The dataset is composed of seven facial expression categories (Angry, Disgust, Fear, Happy, Sad, Surprise, Neutral). All images in the dataset had been registered as face-centered and grayscale with 48×48 pixels. The training set and test set consist of 29, 709 samples and 3589 samples, respectively.
Table 1. The detailed parameters of Image Generator. | |
Operation name | Value |
Rescale | 1./255 |
Validation split | 0.2 |
Rotation range | 20 |
Width shift range | 0.1 |
Height shift range Zoom range Horizontal flip | 0.1 0.1 True |
In terms of the preprocessing, the application of normalization and data augmentation was considered. The dataset was normalized by dividing 255 to reduce the computation cost and the values of the image was converted to range from 0 to 1. In order to avoid overfitting, data augmentation with Keras image generator based on the specific setting as listed in Table 1 was applied.
2.2. CNN-based emotion recognition model
As a prominent category of the deep learning network, Convolution Neural Networks (CNNs) had several advantages over shallow structure models. In [5], the researchers mentioned three crucial advantages of CNNs which showed why CNNs, highlighting the reasons behind their superior performance in image classification tasks compared to traditional models. Initially, CNNs excel in robust feature extraction across diverse scenarios. By employing convolutional operations, CNNs effectively extract salient data features in an abstract format. This capability allows CNNs to discern and capture essential characteristics from complex image data, enabling them to handle intricate visual patterns with high efficacy. Furthermore, CNNs were able to represent image information and marked core features fast from enormous data. Therefore, CNNs architecture models handled non-linear complex problems efficiently. The last advantage of CNNs was the simple network structure, which can provide lower computation costs with less time and was suitable to classify the object in the image.
CNNs adopt a structured architecture comprising multiple convolution layers, pooling layers, and a flattened layer [6-8]. The convolution layer was the base of CNNs, it used filters to scan the input for feature extraction in a small area. Combining several convolution layers was able to extract more and more complicated features. The whole structure reduced the model storage requirement and kept the number of parameters were not increase hugely even after adding more convolution layers to the model. Normally, a pooling layer was set after the convolution layer. In this study, average pooling layers was used in the model to capture features without getting their precision location, which ensured the learning skill of the networks. The flattened layer was usually added in the last part of the model. The reason was that a flattened layer can convert the multidimensional input into one-dimensional. Then the output of the convolution layer can connect with a fully connected layer. In this study, the activation function of all fully connected layers was SoftMax which was a popularly used multi-class activation function [9].
In this project, several classic CNNs models called ResNet50, MobileNet, and DenseNet169 was utilized to test their performance based on the FER-2013 dataset [4]. MobileNet model is a CNNs architecture that was constructed on an embedded board [10]. MobileNet was designed for efficient image classification on mobile and embedded devices, it was a pre-trained model with relatively fewer parameters. ResNet50 is a classic model that addresses the vanishing gradient problem [11]. DenseNet169 is a variant of the Densely Connected Convolutional Network (DenseNet) architecture [12]. This study aimed to compare the performance of those three models on the dataset FER-2013 [4]. Therefore, the structure of the test models was controlled in the same structure. The pre-trained model from the Keras application was invoked, secondly, this study connected the pre-trained model with one global average pooling layer, and finally added one dense layer to the last part. In the last dense layer, SoftMax was chose as the activation function. The whole study was implemented based on the framework called TensorFlow and Python.
2.3. Implementation details
As regards the formation of the various models, this study maintained all the parameters at the same level during the project. The following are the details of the relative parameters: epochs=50, learning rate=0.001, and batch size=32. Furthermore, this study used the SGD optimizer and categorical cross-entropy as a loss function.
3. Results and discussion
3.1. The performance of models
All experiments were conducted based on the same hyperparameter configuration. In Table 2, MobileNet outperformed both ResNet50 and DenseNet169, with lower loss and better accuracy on training and validation data. Notably, MobileNet exhibited exceptional performance by achieving an accuracy of 56.08% on the test dataset, thereby attaining the highest accuracy among all the models evaluated in the experiment.
Table 2. The Performance of different models in the FER-2013 dataset. | |||||
Model | Training Loss | Validation Loss | Training Accuracy | Validation Accuracy | Test Accuracy |
MobileNet | 1.1332 | 1.2151 | 58.67% | 55.93% | 56.08% |
ResNet50 | 1.9218 | 1.2601 | 55.34% | 52.76% | 53.21% |
DenseNet169 | 61.0701 | 51.4185 | 55.34% | 51.79% | 52.44% |
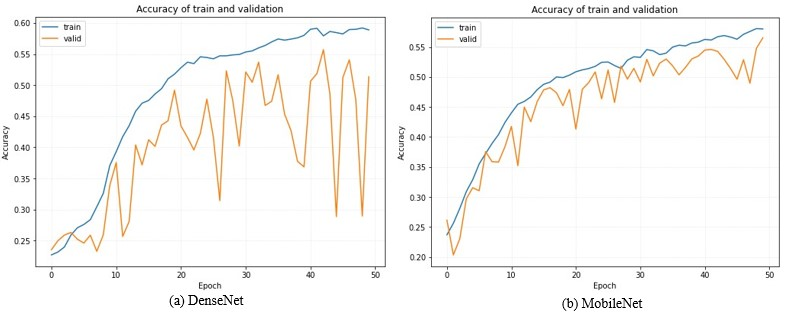
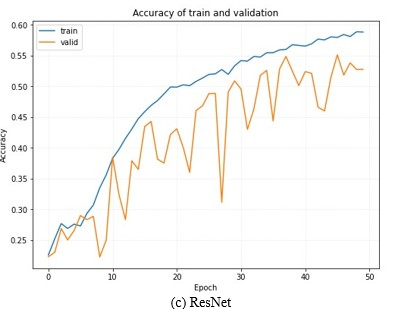
Figure 1. The Accuracy of Training and Validation Data for Different Models in the FER-2013 Dataset.
Photo/Picture credit: Original
Observing Figure 1, the tendency of the train curve remains relatively consistent across all three models. For the validation curve, DenseNet has various fluctuations, followed by ResNet, and MobileNet is a gentle rise.
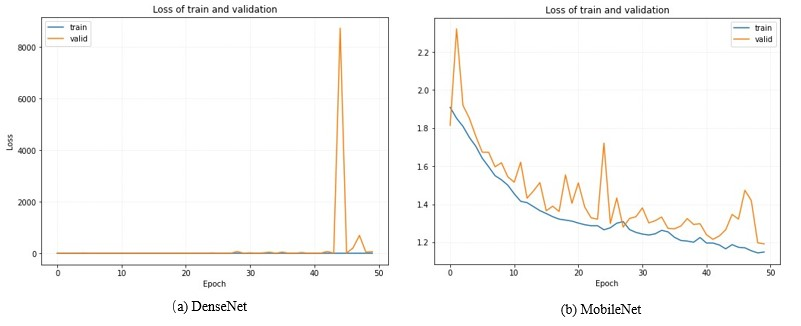
Figure 2. The Loss of Training and Validation Data for Different Models in the FER-2013 Dataset. Photo/Picture credit: Original
In Figure 2, the tendency of the loss line had significant differences. The value of the loss on the y-axis was much bigger for DenseNet and ResNet than MobileNet. For DenseNet, the loss was dramatically increased at epoch 45 and decreased immediately at epoch 46. For the MobileNet, the loss decreased slowly with relatively low fluctuations. The loss of ResNet was huge at the beginning of the training period, then the loss decreased rapidly after the first epoch finished.
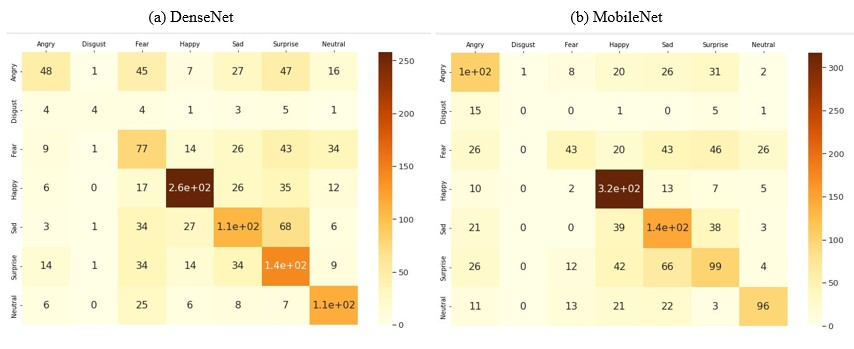
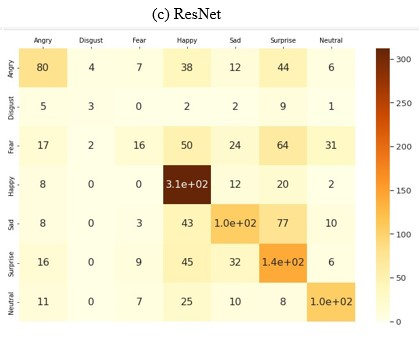
Figure 3. The Confusion Matrix for Different Models in the FER-2013 Dataset.
Photo/Picture credit: Original
Figure 3 showed the confusion matrix for DenseNet, MobileNet, and ResNet. The layout was like each other but there was some difference. Generally, the classification of the seven types of emotions was relatively correct.
3.2. Discussion
In Table 1, the loss of DenseNet was much bigger than MobileNet and ResNet, the accuracy of the DenseNet was fine on the dataset. The loss of DenseNet had dramatically increased from 4.8 to 8728.89 at epoch 45 and then decreased to 10.16 at epoch 46 in Figure 2, which means that the training process of DenseNet was not stable, that’s the reason why DenseNet has a huge loss in Table 1 than other models. This phenomenon is a special case here because of the model otherness, it is more direct to understand the model otherness from Figure 2, the accuracy of these models was quite close to each other, and even the graph of loss had various changes. In addition, Figure 2 showed that the accuracy of each model was all around 0.25 and increase to 0.5-0.6 after 50 epochs of training. This process corresponded to the learning skill of CNNs architecture models, extracting basic features at the beginning so the accuracy was low too. Learning to extract more core features and recognize the object after the training. In the experiment result, the MobileNet performs better than the other two models, the reason might be MobileNet has lower parameters (323, 603, 9) than ResNet (236, 020, 55) and DenseNet (126, 545, 35). On the other hand, ResNet50, MobileNet, and DenseNet169 had 48, 28, and 169 layers respectively. Therefore, another reason might be MobileNet had the lowest layers which means that MobileNet’s extracted features will be simpler than ResNet and DenseNet. For example, edges, shapes, and some facial organs were all included in the simple features, when the model do emotional classification, the change of those simple features was the crucial element for the result. The complicated features extracted by ResNet and DenseNet might be not suitable for facial expression recognition. The huge number of layers of DenseNet can extract some abstract features which might cause high loss during the evaluation process.
4. Conclusion
In this study, the influence that using various CNN architectures for emotion recognition according to the facial expression was investigated. The training parameters of the various models and data preprocessing steps were uniformed. The dataset FER-2013 was used to train three various CNNs architecture models, namely MobileNet, ResNet, and DenseNet. The experiment result indicated that MobileNet has the best performance on test data, with low various change of loss decreasing and accuracy increasing during the training period. The reason might be that MobileNet has relatively fewer model parameters than ResNet and DenseNet and the dataset FER-2013 was a small dataset. In the future, combing model improvement methods were anticipated to join in the research. Additionally, exploring a wider range of CNN architecture models would contribute to a more comprehensive understanding of their performance in emotion recognition tasks based on facial expressions.
References
[1]. Wan T S T et al 2019 Co-compressing and unifying deep cnn models for efficient human face and speaker recognition Proceedings of the IEEE/CVF Conference on Computer Vision and Pattern Recognition Workshops 0-0.
[2]. Liu J 2023 An improved cnn algorithm with hybrid fuzzy ideas for intelligent decision classification of human face expressions Soft Comput 27 pp 5195–5204.
[3]. Sujanaa J et al 2021 Emotion recognition using support vector machine and one-dimensional convolutional neural network Multimed Tools Appl 80 pp 27171–27185.
[4]. Sambare M 2020 FER-2013 Retrieved May 29 2023 from https://www.kaggle.com/datasets/msambare/fer2013.
[5]. Song J S et al 2019 A Survey of Remote Sensing Image Classification Based on CNNs Big Earth Data 3 (3, Jul) pp 232–254.
[6]. Arena P Basile A Bucolo M et al. 2003 Image processing for medical diagnosis using CNN Nuclear Instruments and Methods in Physics Research Section A: Accelerators, Spectrometers, Detectors and Associated Equipment 497(1) pp 174-178.
[7]. Yu Q Wang J Jin Z et al 2022 Pose-guided matching based on deep learning for assessing quality of action on rehabilitation training Biomedical Signal Processing and Control 72: 103323.
[8]. Liu F Lin G Shen C 2015 CRF learning with CNN features for image segmentation Pattern Recognition 48(10): pp 2983-2992.
[9]. Liu W et al 2016 Large-margin softmax loss for convolutional neural networks ICML 2(3) 7.
[10]. Bouguezzi S Faiedh H Souani C 2021 Slim MobileNet: An Enhanced Deep Convolutional Neural Network 2021 18th International Multi-Conference on Systems, Signals & Devices (SSD) IEEE pp 12-16.
[11]. He K Zhang X Ren S et al 2016 Deep residual learning for image recognition Proceedings of the IEEE conference on computer vision and pattern recognition pp 770-778.
[12]. Huang G Liu Z Laurens VDM Weinberger KQ 2017 Densely connected convolutional networks In: Proceedings of the IEEE conference on computer vision and pattern recognition (CVPR) pp 4700–4708.
Cite this article
Gao,W. (2023). Investigation of multiple convolutional neural network models on emotion detection. Applied and Computational Engineering,22,35-41.
Data availability
The datasets used and/or analyzed during the current study will be available from the authors upon reasonable request.
Disclaimer/Publisher's Note
The statements, opinions and data contained in all publications are solely those of the individual author(s) and contributor(s) and not of EWA Publishing and/or the editor(s). EWA Publishing and/or the editor(s) disclaim responsibility for any injury to people or property resulting from any ideas, methods, instructions or products referred to in the content.
About volume
Volume title: Proceedings of the 5th International Conference on Computing and Data Science
© 2024 by the author(s). Licensee EWA Publishing, Oxford, UK. This article is an open access article distributed under the terms and
conditions of the Creative Commons Attribution (CC BY) license. Authors who
publish this series agree to the following terms:
1. Authors retain copyright and grant the series right of first publication with the work simultaneously licensed under a Creative Commons
Attribution License that allows others to share the work with an acknowledgment of the work's authorship and initial publication in this
series.
2. Authors are able to enter into separate, additional contractual arrangements for the non-exclusive distribution of the series's published
version of the work (e.g., post it to an institutional repository or publish it in a book), with an acknowledgment of its initial
publication in this series.
3. Authors are permitted and encouraged to post their work online (e.g., in institutional repositories or on their website) prior to and
during the submission process, as it can lead to productive exchanges, as well as earlier and greater citation of published work (See
Open access policy for details).
References
[1]. Wan T S T et al 2019 Co-compressing and unifying deep cnn models for efficient human face and speaker recognition Proceedings of the IEEE/CVF Conference on Computer Vision and Pattern Recognition Workshops 0-0.
[2]. Liu J 2023 An improved cnn algorithm with hybrid fuzzy ideas for intelligent decision classification of human face expressions Soft Comput 27 pp 5195–5204.
[3]. Sujanaa J et al 2021 Emotion recognition using support vector machine and one-dimensional convolutional neural network Multimed Tools Appl 80 pp 27171–27185.
[4]. Sambare M 2020 FER-2013 Retrieved May 29 2023 from https://www.kaggle.com/datasets/msambare/fer2013.
[5]. Song J S et al 2019 A Survey of Remote Sensing Image Classification Based on CNNs Big Earth Data 3 (3, Jul) pp 232–254.
[6]. Arena P Basile A Bucolo M et al. 2003 Image processing for medical diagnosis using CNN Nuclear Instruments and Methods in Physics Research Section A: Accelerators, Spectrometers, Detectors and Associated Equipment 497(1) pp 174-178.
[7]. Yu Q Wang J Jin Z et al 2022 Pose-guided matching based on deep learning for assessing quality of action on rehabilitation training Biomedical Signal Processing and Control 72: 103323.
[8]. Liu F Lin G Shen C 2015 CRF learning with CNN features for image segmentation Pattern Recognition 48(10): pp 2983-2992.
[9]. Liu W et al 2016 Large-margin softmax loss for convolutional neural networks ICML 2(3) 7.
[10]. Bouguezzi S Faiedh H Souani C 2021 Slim MobileNet: An Enhanced Deep Convolutional Neural Network 2021 18th International Multi-Conference on Systems, Signals & Devices (SSD) IEEE pp 12-16.
[11]. He K Zhang X Ren S et al 2016 Deep residual learning for image recognition Proceedings of the IEEE conference on computer vision and pattern recognition pp 770-778.
[12]. Huang G Liu Z Laurens VDM Weinberger KQ 2017 Densely connected convolutional networks In: Proceedings of the IEEE conference on computer vision and pattern recognition (CVPR) pp 4700–4708.