


1 Introduction
Today, Asian Americans make up only 5% of eligible adult voters in the United States. However, the total number of American voters between the 2016 and 2020 elections has been the largest in history [1]. Asian Americans stand at the forefront of this advancement, having the largest increase in voter turnout percentage among all races between 2016 and 2020, with a jump from 49% to 59%. They also have the largest increase in voter turnout percentage among all races through the past four elections, between 2008 and 2020, with a jump of 47% to 59%. [2] In addition to their voter turnout increase, Asian Americans are also the fastest-growing racial group in the United States. Between 2000 and 2019, the Asian American population has grown by an astounding 81%, from 10.5 to 18.9 million. California, Texas, and New York have seen the most significant influx in Asian Americans, contributing to 43% of the population increase across the nation since 2000. [3] The increase in voter turnout and population has proved to put Asian Americans as game-changers in recent elections. Moreover, the increase in Asian American population has also led to an increase in Asian American politicians. As of 2022, Asian Americans make up two of the Senators, 16 of the House of Representatives, and Indian American Kamala Harris serves as Vice President of the United States.
While Asian Americans' political participation has been more impactful than ever, the methods by which their participation is measured lack from a micro-level and temporal standpoint. Despite the fact that there already exists a significant amount of data on the political participation of Asian Americans in the past elections, the methods in which those data are acquired tend to have a relatively high margin of error. Currently, the two most commonly used forms of data collection are through exit polls and Census Bureau surveys. The former is carried out through either in-person interviews as the voters leave their polling place or telephone calls for early voters. The latter is also carried out through a survey conducted in the weeks following the election. [4] However, these data sources only capture the information of a select group of people biased against minority groups. From 2006 to 2012, the share of Hispanic voters was always off by one or two percentage points between the exit polls and Census Bureau surveys. Considering that the average share of Hispanic voters between the two surveys was around 8%, that is a disparity of nearly 25%. [5] In addition to the lack of accuracy in the data, these methods also lack in capturing data temporally. These polls and surveys only record data from that specific election cycle and therefore cannot express a cross-year analysis and show trends that can only be seen on a larger temporal scale.
To address the shortcomings seen in polls and surveys, one can observe objective, large data concerning political participation, such as the Campaign Contributions data provided by the Federal Elections Committee, and use different data science methods to discern the political participation of Asian Americans over the past century. That is what our research offers to do. We will evaluate the evolution of Asian American political participation using this large-scale data provided by the Federal Elections Committee and use a machine learning approach to identify the Asian American individuals through name analysis, a comparatively more accurate method than the traditional method of data scientists that is to use the dictionary-based method. However, we will show that the surname lists produced by the dictionary-based method are more accurate under certain circumstances and will use them to validate the accuracy of the machine learning model. In doing so, we plan to show Asian American political participation on an unprecedently temporal and specific scale over the past two decades.
2 Related Work
Although Asian Americans represent only a small percentage of the U.S. population, the number is still steadily growing—from less than a million in 1960 to more than 15 million today. They also tend to receive higher education and income levels than any other U.S. racial group. [6] However, Asian Americans' political participation does not commensurate with their numerical strength. The little engagement of Asian Americans in the political system has been well documented. [7] Many factors have been considered, such as acculturation experiences, group connectedness, hybrid identity, or even responses to hate crimes and racial victimization. Essentially, contrary to the socioeconomic status that has been reliably used to indicate political behavior, Asian Americans' political participation does not lead to increased political clout. [7,8]
More recently, the political participation of Asian Americans has also increased. [9] The Asian American voters hit a historic high turnout rate of nearly 60% in 2020, according to the U.S. Census Bureau. One preliminary report of the Asian American vote organized by Asian American and Pacific Islander (AAPI) suggests that Asian American voters had increased the turnout in multiple key battleground states. Furthermore, such increases in political participation by Asian Americans may constitute both voting and other political activities. [10] For example, Asian Americans have been shown to support candidates predominantly financially from the same ethnic group. [11]
3 Methodology
Attempts at using FEC Campaign Contributions data to discern Asian American political contributions already exist. The most common way to identify Asian Americans in FEC Campaign Contributions data is to analyze the names that the data provides; the data does not explicitly state the donor’s ethnicity or race.
3.1 Dictionary-based matching
Dictionary-based matching is a common method to identify the ethnicity or race of an individual based on their names. The method that one study carried out is similar to the one in this paper. However, its technique lacked variety and did not accommodate for more recent improvements in technological methods. The method was carried out using one technique: to match the first and surnames of the contributor to an Asian ethnic names dictionary using PERL scripts. [12]
Similarly, another study also used the dictionary-based matching method to identify Asian Americans in FEC Campaign Contributions data. However, they used two name lists instead of one to match the names of the donors. The surnames were first matched to the 2000 Census surname list which contains all surnames that appeared 100 or more times in the 2000 Census. The names identified as Asian Americans were then matched against a second surname list that was produced in the context of a healthcare setting. [13]
The lists and method this paper uses are derived from a paper published in 2000. [14] The 2000 paper produced surname lists for six major Asian American ethnic groups: Chinese, Japanese, Filipino, Korean, Indian, and Vietnamese. These lists were based on Social Security Administration records that identified each individual's country of birth, then evaluated using an independent file of census records and previously developed Asian surname lists to test their accuracy. Although that paper produced surname lists based on an ethnic level, this paper uses all six surname lists collectively to identify Asian Americans as a whole.
While the dictionary-based matching method mainly ensures that all individuals identified are, in fact, Asian, some individuals that are Asian might not be included. In other words, it prioritizes specificity over sensitivity. One example that Lauderdale addressed was the surname Chang, which was not identified on any list, despite the fact that most people with the surname Chang are Asian. This is due to the method by which the lists were derived. The method derived lists on the ethnic, not racial level. If a name surpassed the 50% bar of being a certain ethnicity, it would be included in the surname list of said ethnicity. For the surname Chang, it was identified as having around a 40% chance of being Korean and Chinese each, meaning it did not pass the bar and was not included on either list. Due to this limitation, the dictionary-based matching method will have comparatively lower accuracy than the machine learning method. However, it will be used as a baseline for validation because of its high specificity.
3.2 Machine learning
The second method this paper uses to determine ethnicity and race is a machine learning based approach. One paper published in 2020 built its machine learning framework upon the 1901 Canadian census, which contains the ethnicity of each individual; the choice to use an older census was due to the 2005 Statistics act, which prohibits public access to census data 92 years after their respective years of collection. [15] The final 1901 Canadian census, after trimming missing or duplicate records, came down to around 4.8 million records. The paper examined 13 ethnic groups: Aboriginal (First Nations, Métis, Inuit, and all-combined), Chinese, English, French, Irish, Italian, Japanese, Russian, Scottish, and others. A random 20% of these records were chosen to be the test set, the remaining 80% the training set, and 12.5% of the training set taken to be the validation set. The model achieved a 76% F1 and 91% accuracy.
While the 2020 paper claimed that the older census data was not detrimental to the results as naming practices stay persistent over long periods for ethnic groups, it encouraged other papers to use more temporally relevant data. A 2018 paper filled this quota. That paper created three models for identifying ethnicity and race trained and validated on the 2000 and 2010 Census Bureau surname data, the Florida Voter Registration data, and the Wikipedia data. [16] This paper used the model created based on the 2000 and 2010 Census data. The researchers split the names, which were initially strings, into two-letter character chunks known as bi-chars to train the model. The example the paper gave is that a name such as "Smith" would become "Sm," "mi," "it," and "th."They then modeled the relationship between the sequence of characters and the individual’s ethnicity and race using Long Short Term Memory Networks. [17]
3.3 Validation
Due to the dictionary-based matching method prioritizing specificity over sensitivity, many names were excluded from the lists. One example would be Filipino names, a large part of which was eliminated due to their intersection with Hispanic names. However, we can use its lists as ground truths to test against our machine learning method because of this method's specific nature.
As the 2018 paper does not provide validation data for the Census Bureau surname model, we use a surname list derived from the dictionary-based matching method to validate the models. By selecting the surname list with country code C22, we produce a list with surnames that are believed to be Chinese (as represented by the ‘C’), unconditionally strongly predictive (as represented by the first ‘2’ and meaning that more than 75% of people on a list without Asian race classification available associate with originating from China), and conditionally strongly predictive (as represented by the second ‘2’ and meaning that more than 75% of people on a list with Asian race classification available associate with originating from China). We treat this C22 surname list as the ground truth due to the highly specific and strongly predictive nature of the list, guaranteeing a high likelihood of being Chinese. [18]
We take the individuals identified as Chinese by the C22 list and output the percentage of those individuals whom the machine learning model identifies as Asian/API. We repeat this process for the Japanese and Korean strongly predictive lists. Since these lists have been established as having a strongly predictive nature, we can treat this outputted percentage as the accuracy of the machine learning model. The results are as follows.
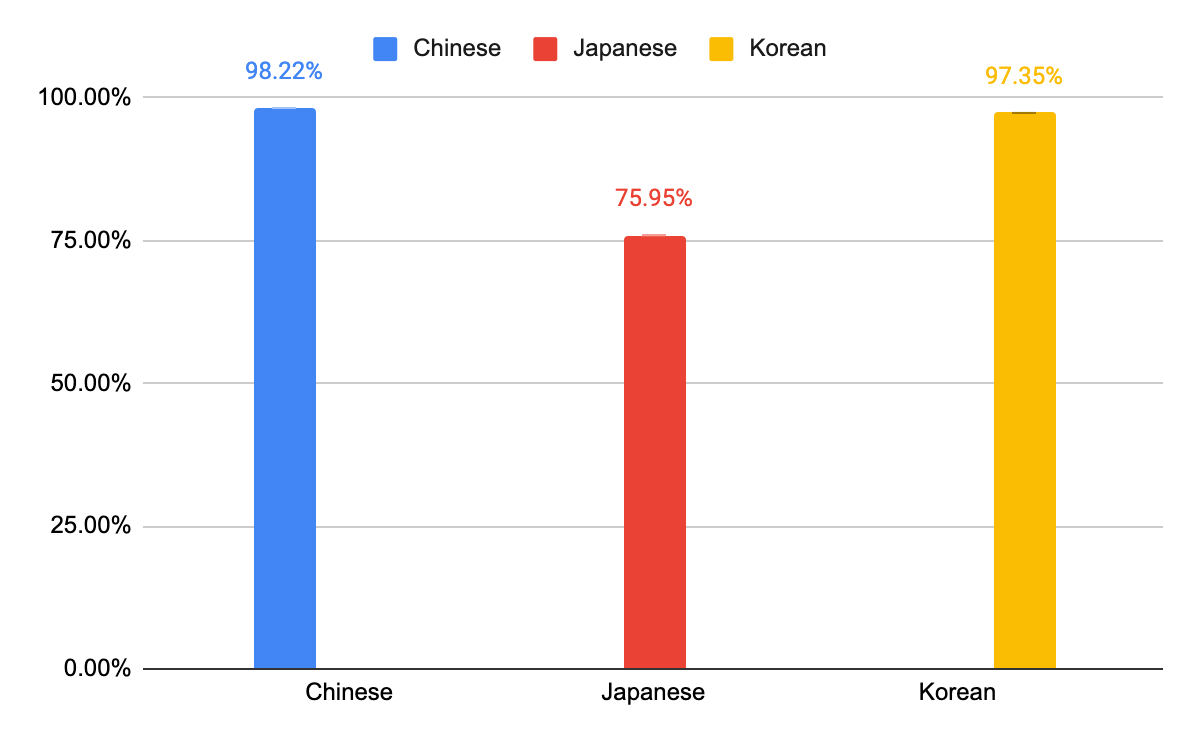
Fig. 1. Percentage of strongly predictive lists for Chinse, Japanese, and Korean names that the machine learning model identifies as Asian/AAPI
The results demonstrate that the machine learning model is highly accurate when predicting the race of Chinese and Korean names as Asian. However, the accuracy is lower for predicting Japanese names as Asian. It is not clear whether this is a shortcoming of the machine learning model or the derivation of the Japanese name list.
4 Results
Figure 2 shows that the 2000 election had a fairly even divide between Democratic and Republican Asian voters. This was reflected across all demographics, as the Presidential race came down to the key state of Florida, which declared Bush the President by just 537 votes. [19] Independent Asian voters were seemingly nonexistent.
The 2004 election saw a large jump in Democratic Asian voters. This contradicted the overall majority, which voted for Bush that year. Then Director of Polling for ABC News, Gary Langer, claimed that Bush won because of women voters and 9/11. In his words, "[Bush's] image of leadership, his focus on security, the fact that 9/11 has not happened again within this country's borders convinced Americans, especially women with families to protect, that this president should be returned to the White House, and he was." [20] While this might have appealed to the overall American population, an eight state-wide exit poll conducted by the Asian American Legal Defense and Education Fund (AALDEF) in 2004 found that only 16% of Asian voters found the most important issue to be the war in Iraq or Terrorism/Security respectively. The largest group of Asian voters regarded Economy/Jobs as the most critical issue. [21]
The 2008 election saw an even more significant jump in Democratic Asian voters, reaching a staggering 89.3% of the demographic. AALDEFF's Multilingual Exit Poll in eleven States showed that all Asian ethnicities voted for Economic/Jobs once again as their most important issue. 79% of the respondents stated that they supported healthcare for all individuals in the country regardless of immigration status. [22]. This most closely reflected the Affordable Care Act passed by Obama in 2010, which led to a record low of 9% of Americans who were uninsured by 2016. McCain, on the other hand, publicly critiqued the ACA. [23]
While lower than the numbers in 2008, the 2012 election also saw dominant support for the Democratic party from the Asian Americans with 77.3%. This year, Democratic candidate—Obama—stayed the same, but Mitt Romney represented the Republican party. Democratic State Representative Tackey Chan claimed that Obama's biography appealed to Asian Americans, seeing as he grew up with an immigrant parent and spent parts of his childhood in Indonesia. [24] In addition to Obama's success with the passing of the ACA, Romney also displayed apparent resistance to immigration and reported "harsh rhetoric aimed at China."[25]
The 2016 election between Hillary and Trump saw even greater heights in Asian American Democratic support, with 92% of Asian voters leaning blue. One explanation is provided by the 2016 National Asian American Survey, which reported that Asian Americans strongly opposed the Muslim ban by a 3-to-1 margin. [26] The Asian American Vote reported by the AALDEF also saw support in 65% of Asian Americans for "comprehensive immigration reform, including a path to citizenship for undocumented immigrants." [27]
The 2020 election saw unprecedented support for the Independent party. This can be largely explained by AAPI's support for the Independent party candidate Bernie Sanders and the support he reciprocated to the AAPI community through his policies and reforms. Through Sanders' political campaigns, he has shown support for the AAPI community in reforming structural policies that reinforce racism and exploitation against AAPIs. For example, he strongly opposed the economic exploitation of migrant workers, recognizing the low wages and poor working conditions in such relationships. To that end, he has resisted such acts as the Trans-Pacific Partnership Act. Sanders also supported comprehensive immigration reform, as seen in his support for the Border Security, Economic Opportunity, and Immigration Modernization Act of 2013, Congress' most recent attempt at said reform. On a more ideological level, Sanders recognized the Asian “model minority myth” that perpetuates the idea that the AAPI community does not need to be helped since they do so well in education and the economy. [28] All of this is to say that Asian Americans’ staunch support for the Independent Party during the 2020 election can be explained thoroughly.
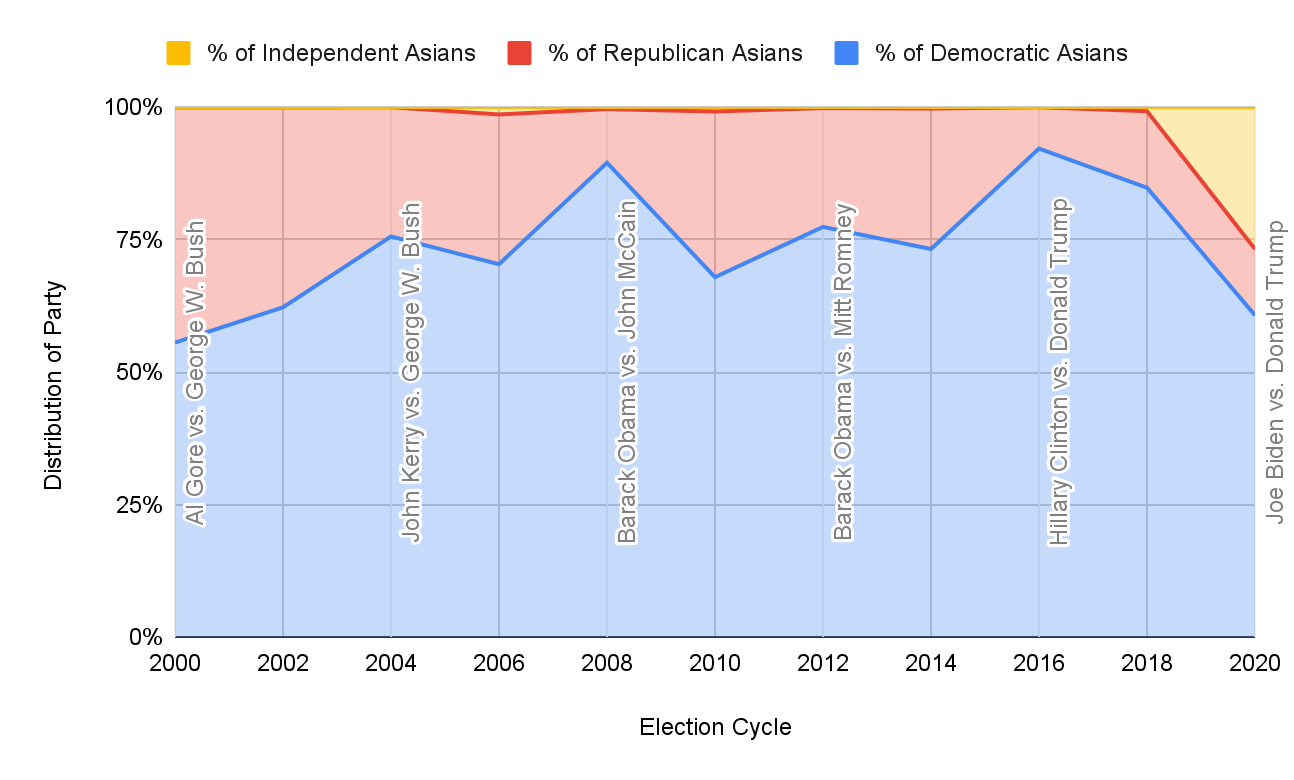
Fig. 2. Distribution of Recipient Parties of Asian American Contributions Over Past 10 Election Cycles (Years 2000-2020)
Figure 3 shows a slight increase in the percentage of total American voters that are Asian American over the past 20 years. There has been a comparatively steeper increase in total Asian American Contributions over the past 20 years. This can be explained by the previously established fact that Asian Americans are the fastest-growing racial grouping in the United States. Therefore, while there is only a slight increase in the percentage of total American voters that are Asian American, the fact that the total Asian American population is also increasing drastically increases total contributions.
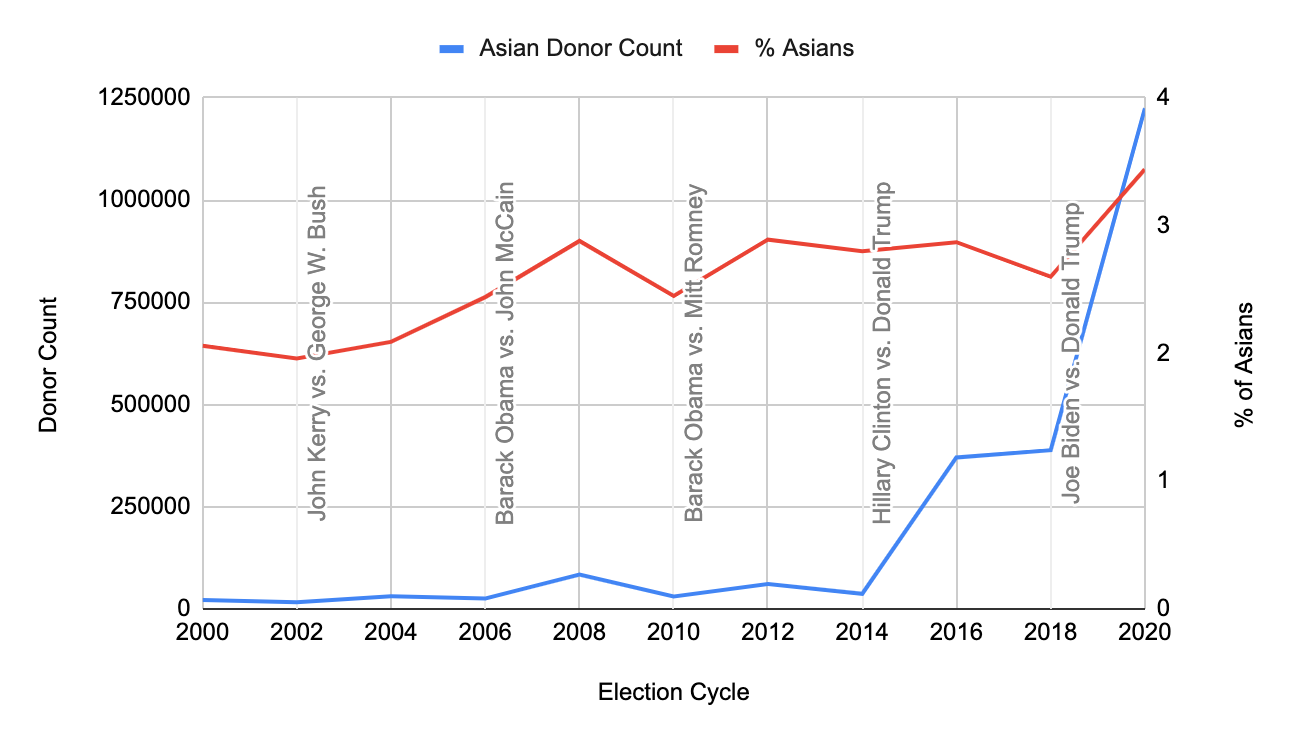
Fig. 3. Percentage of Total Contributors that are Asian American Over Past 10 Election Cycles
Figure 4 shows that over the past 20 years, Asian American males hold the majority when it comes to contributions count. However, there has been a 17.4% increase in female contributions from 2000 to 2020, showing the uptrend in the shift of influence for Asian American females.
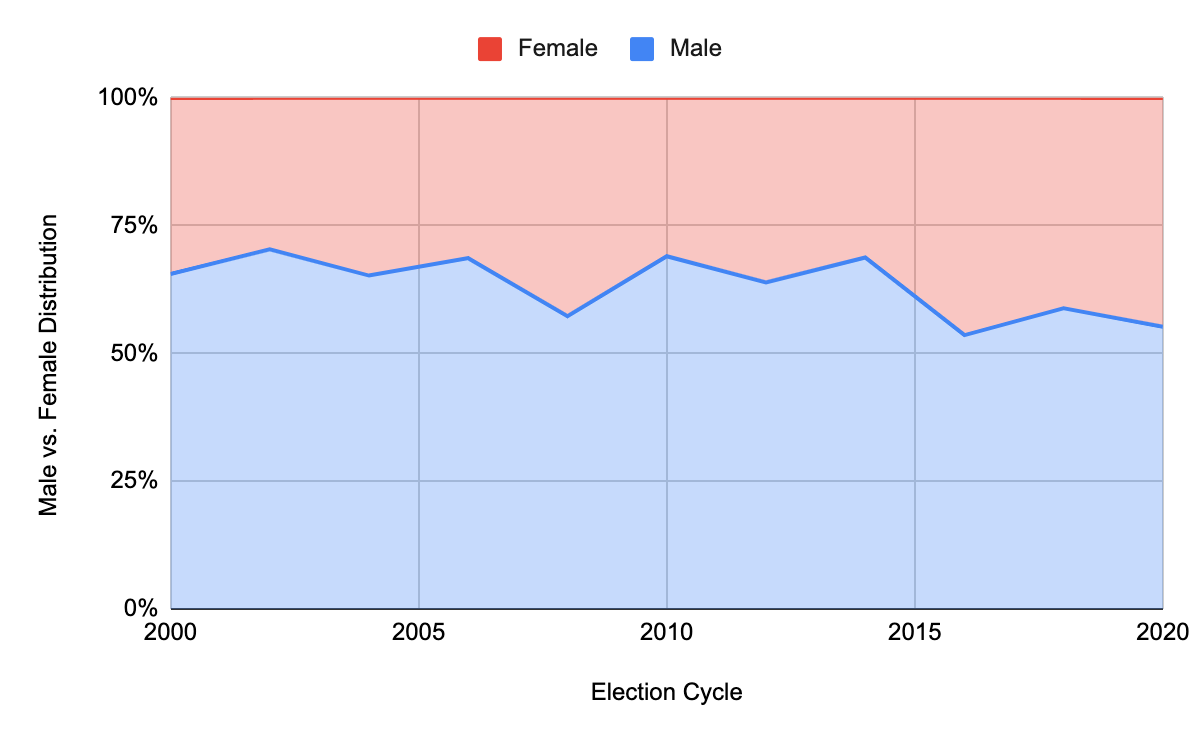
Fig. 4. Male vs. Female Distribution of Asian American Contributors over Past 10 Election Cycles
Figure 5 shows that California has remained the predominant state for Asian American contributors to political campaigns throughout the past ten election cycles. New York follows in second, with Virginia trailing in third. All of these percentages are reflective of the population count of Asian Americans in each of the respective states. However, the data points for Virginia in 2000, 2002, and 2004 are surprisingly high, considering that they never had a large influx of Asian American immigrants.
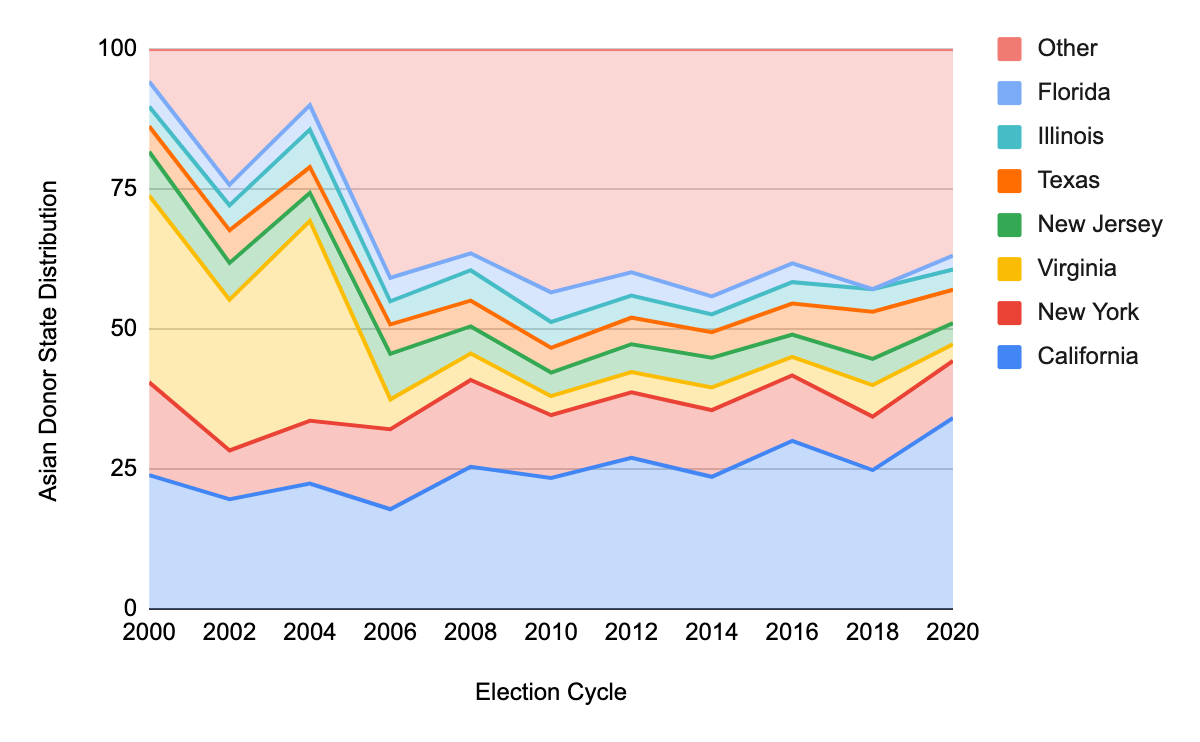
Fig. 5. State Distribution of Asian American Contributors over Past 10 Election Cycles with the Percentage of States that have appeared in the Top 5 of any given year displayed individually.
Figure 6 shows that the average donation size of Asian Americans never falls last among the four racial groups, with the exception of the year 2002. They have also proven to lead the pack in many election cycles, namely 2008, 2014, 2016, and 2018. There is a general downtrend in average donation size. This does not indicate, however, that the general population’s engagement in political campaigns is decreasing. Rather, it suggests that, according to a study in 2020, smaller donations from individuals, compared to larger ones from political-action committees, can reduce race and gender inequities among candidates and benefit elected officials and constituents. [29]
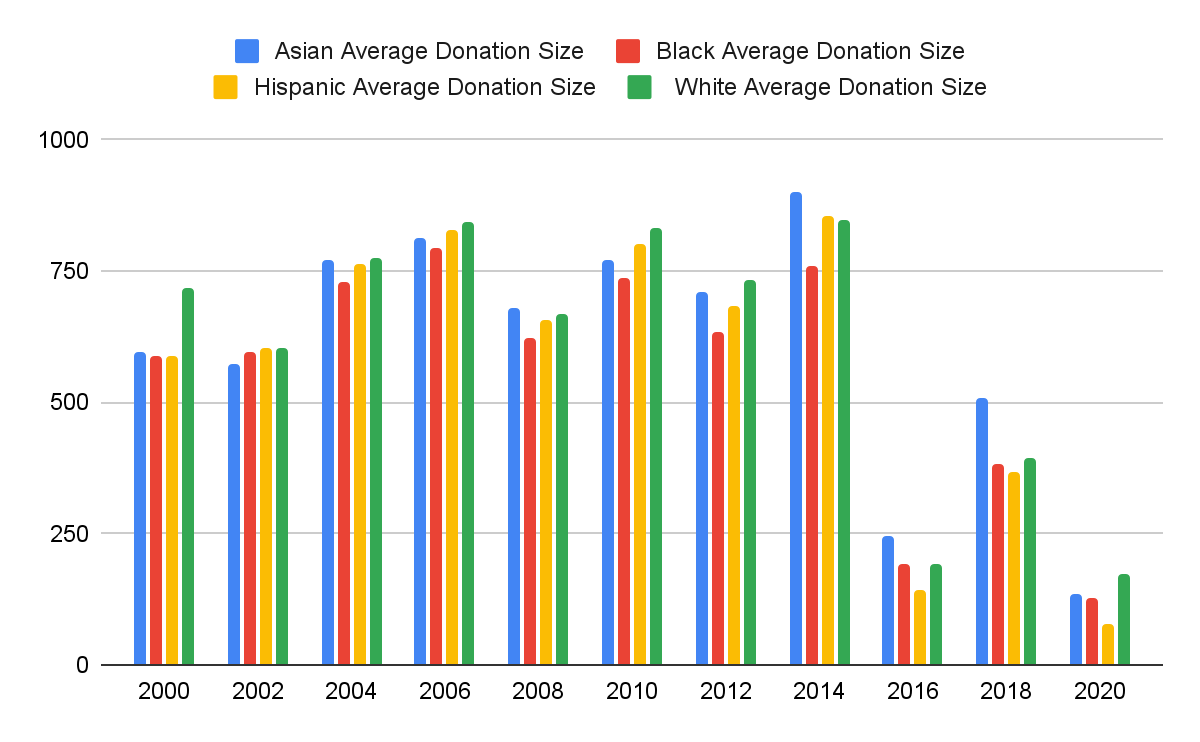
Fig. 6. Average Donation Size of Each Race over the Past 10 Election Cycles
5 Conclusion
Our research offers a temporally and statistically comprehensive study of Asian American Political Participation in U.S. Elections over the past two decades. Using a machine learning model that we validated against a highly accurate surname list derived from a dictionary-based method, we have shown that Asian American contributions are increasing, largely due to Asian Americans being the fastest-growing racial group in the country. We have shown that the contribution distribution is gradually shifting to an equal distribution between men and women. We have seen that, except in Virginia, the state distribution of Asian American contributions has remained relatively constant. Overall, it shows that Asian Americans are commensurate with their increase in population.
A path for future exploration could be using both the first name and surname for more accurate identification of Asian Americans from the large-scale data. Currently, both the dictionary-based and machine learning methods only analyze the surname. A potential change would be to use the machine learning model trained on the Florida voter registration data, which does indeed use the individual's full name. Alternatively, a disparate method would be using the Bayesian Improved First Name Surname Geocoding method (BISFG). Using the geolocation of the individual, combined with the first and last name, the method uses Bayes’ theorem to output the probability of the individual being of a particular race. With the inclusion of the geolocation on top of the full name analysis, this method could provide an even more accurate insight into the data at hand.
References
[1]. U.S. Census Bureau 2021. United States Election Project.
[2]. Budiman, Abby (2021) Asian Americans are the fastest-growing racial or ethnic group in the U.S. In: Pew Research Center, Washington, D.C.
[3]. https://www.pewresearch.org/fact-tank/2021/04/09/asian-americans-are-the-fastest-growing-racial-or-ethnic-group-in-the-u-s/
[4]. Krogstad JM, Lopez MH (2020) Why measuring the demographics of voters on election day is difficult. In: Pew Research Center. Washington, D.C. https://www.pewresearch.org/fact-tank/2014/11/04/why-measuring-the-demographics-of-voters-on-election-day-is-difficult/.
[5]. Krogstad JM, Lopez MH (2020) Why measuring the demographics of voters on election day is difficult. In: Pew Research Center. https://www.pewresearch.org/fact-tank/2014/11/04/why-measuring-the-demographics-of-voters-on-election-day-is-difficult/
[6]. Janelle Wong, S. Karthick Ramakrishnan, Taeku Lee, Jane Junn (2011), Asian American Political Participation Emerging Constituents and Their Political Identities, Russell Sage Foundation.
[7]. Tao-Fang Huang (2012), The myth of political participation among Asian Americans, PhD Thesis, University of Texas at Austin.
[8]. Alexander Kuo, Neil Malhotra, and Cecilia Hyunjung Mo (2017), Social Exclusion and Political Identity: The Case of Asian American Partisanship, The Journal of Politics, Volume 79, Number 1, 17-32.
[9]. File, Thom . 2015. “Who Votes? Congressional Elections and the American Electorate: 1978-2014.” Current Population Survey Reports, P20-577. U.S. Census Bureau, Washington, DC.
[10]. Nathan Chan. 2021. “Political Inequality in the Digital World: The Puzzle of Asian American Political Participation Online”. Political Research Quarterly, Volume 74, Number 4, 882-898.
[11]. Cho, Wendy. Tam (2002) Tapping Motives and Dynamics behind Campaign Contributions: Insights from the Asian American Case. American Politics Research 30, no. 4, 347–83. https://doi.org/10.1177/1532673X02030004001.
[12]. Cho, Wendy. Tam (2002) Tapping Motives and Dynamics behind Campaign Contributions: Insights from the Asian American Case. American Politics Research 30, no. 4, 347–83. https://doi.org/10.1177/1532673X02030004001.
[13]. Shah S (2016) Growth of Asian American political contributions. In: Data Bits. http://aapidata.com/blog/asian-am-political-contributions/.
[14]. Lauderdale, D.S., Kestenbaum, B. (2000) Asian American ethnic identification by surname. Population Research and Policy Review 19, 283–300. https://doi.org/10.1023/A:1026582308352
[15]. Wong, K. O., Zaïane, O. R., Davis, F. G., & Yasui, Y. (2020). A machine learning approach to predict ethnicity using personal name and census location in Canada. PloS one, 15(11), e0241239. https://doi.org/10.1371/journal.pone.0241239
[16]. Sood, Gaurav & Laohaprapanon, Suriyan (2018). Predicting Race and Ethnicity From the Sequence of Characters in a Name, https://doi.org/10.48550/arxiv.1805.02109
[17]. Sood, Gaurav & Laohaprapanon, Suriyan (2018). Predicting Race and Ethnicity From the Sequence of Characters in a Name, https://doi.org/10.48550/arxiv.1805.02109
[18]. Lauderdale, D.S., Kestenbaum, B. (2000) Asian American ethnic identification by surname. Population Research and Policy Review 19, 283–300. https://doi.org/10.1023/A:1026582308352
[19]. Kennedy, Lesley (2020). How the 2000 Election Came Down to a Supreme Court Decision, History.com, available at: https://www.history.com/news/2000-election-bush-gore-votes-supreme-court
[20]. Trei, Lisa (2004). Why Bush won in 2004, Stanford News, available at: https://news.stanford.edu/pr/2004/polls-1117.html
[21]. W. Yu, Nancy et al. (2005). The Asian American Vote: A Report on the AALDEF Multilingual Exit Poll in the 2004 Presidential Election, The Asian American Legal Defense and Education Fund, available at: https://www.aaldef.org/uploads/pdf/AALDEF-Exit-Poll-2004.pdf
[22]. The Asian American Legal Defense and Education Fund (2018). New Report on the Asian American Vote in the 2008 Elections Shows Widespread Support for Obama and Growing Numbers of First-Time Voters [Press release], available at: https://www.aaldef.org/press-release/new-report-on-the-asian-american-vote-in-the-2008-elections-shows-widespread-support-for-obama-and-g/
[23]. Rapfogel, Nicole & Gee, Emily & Calsyn, Maura (2020). 10 Ways the ACA Has Improved Health Care in the Past Decade, American Progress, available at: https://www.americanprogress.org/article/10-ways-aca-improved-health-care-past-decade/#:~:text=The%20ACA%20generated%20one%20of,since%20the%20ACA%20was%20enacted.
[24]. Borchers, Callum & Wirzbicki, Alan (2012). Asian-Americans backed Obama overwhelmingly, The Boston Globe, available at:
[25]. https://www.bostonglobe.com/news/politics/2012/11/09/asian-americans-voted-more-heavily-for-barack-obama-than/gdcKynV3Hq3OgSeOlNEhHM/story.html
[26]. Huetteman, Emmarie (2018). McCain’s Complicated Health Care Legacy: He Hated the ACA. He Also Saved It., Kaiser Health News, available at:
[27]. https://khn.org/news/mccains-complicated-health-care-legacy-he-hated-the-aca-he-also-saved-it/
[28]. Ramakrishnan, Karthick & Lee, Jennifer& Lee, Taeku & Wong, Janelle (2016). “National Asian American Survey (NAAS) 2016 Post-Election Survey.” Riverside, CA: National Asian American Survey, available at:
[29]. http://naasurvey.com/wp-content/uploads/2017/05/NAAS16-post-election-report.pdf
[30]. Ramakrishnan, Karthick et al. (2016). Report on Registered Voters in the Fall 2016 National Asian American Survey, National Asian American Survey, available at:
[31]. https://naasurvey.com/wp-content/uploads/2016/10/NAAS2016-Oct5-report.pdf
[32]. Ramakrishnan, Karthick et al. (2016). Report on Registered Voters in the Fall 2016 National Asian American Survey, National Asian American Survey, available at:
[33]. https://naasurvey.com/wp-content/uploads/2016/10/NAAS2016-Oct5-report.pdf
[34]. The Asian American Legal Defense and Education Fund (2016). The Asian American Vote 2016: A Report by The Asian American Legal Defense and Education Fund, available at:
[35]. https://www.aaldef.org/uploads/TheAsianAmericanVote2016-AALDEF.pdf
[36]. FeelTheBern Editors (2020). Bernie Sanders on Asian American & Pacific Islander Rights, FeelTheBern, available at: https://feelthebern.org/asian-american-pacific-islander-rights/
Cite this article
Li,M. (2023). The Open Secrets of the Model or Marginalized Minority: Political Campaign Participation of Asian Americans in the 21st Century. Applied and Computational Engineering,2,793-801.
Data availability
The datasets used and/or analyzed during the current study will be available from the authors upon reasonable request.
Disclaimer/Publisher's Note
The statements, opinions and data contained in all publications are solely those of the individual author(s) and contributor(s) and not of EWA Publishing and/or the editor(s). EWA Publishing and/or the editor(s) disclaim responsibility for any injury to people or property resulting from any ideas, methods, instructions or products referred to in the content.
About volume
Volume title: Proceedings of the 4th International Conference on Computing and Data Science (CONF-CDS 2022)
© 2024 by the author(s). Licensee EWA Publishing, Oxford, UK. This article is an open access article distributed under the terms and
conditions of the Creative Commons Attribution (CC BY) license. Authors who
publish this series agree to the following terms:
1. Authors retain copyright and grant the series right of first publication with the work simultaneously licensed under a Creative Commons
Attribution License that allows others to share the work with an acknowledgment of the work's authorship and initial publication in this
series.
2. Authors are able to enter into separate, additional contractual arrangements for the non-exclusive distribution of the series's published
version of the work (e.g., post it to an institutional repository or publish it in a book), with an acknowledgment of its initial
publication in this series.
3. Authors are permitted and encouraged to post their work online (e.g., in institutional repositories or on their website) prior to and
during the submission process, as it can lead to productive exchanges, as well as earlier and greater citation of published work (See
Open access policy for details).
References
[1]. U.S. Census Bureau 2021. United States Election Project.
[2]. Budiman, Abby (2021) Asian Americans are the fastest-growing racial or ethnic group in the U.S. In: Pew Research Center, Washington, D.C.
[3]. https://www.pewresearch.org/fact-tank/2021/04/09/asian-americans-are-the-fastest-growing-racial-or-ethnic-group-in-the-u-s/
[4]. Krogstad JM, Lopez MH (2020) Why measuring the demographics of voters on election day is difficult. In: Pew Research Center. Washington, D.C. https://www.pewresearch.org/fact-tank/2014/11/04/why-measuring-the-demographics-of-voters-on-election-day-is-difficult/.
[5]. Krogstad JM, Lopez MH (2020) Why measuring the demographics of voters on election day is difficult. In: Pew Research Center. https://www.pewresearch.org/fact-tank/2014/11/04/why-measuring-the-demographics-of-voters-on-election-day-is-difficult/
[6]. Janelle Wong, S. Karthick Ramakrishnan, Taeku Lee, Jane Junn (2011), Asian American Political Participation Emerging Constituents and Their Political Identities, Russell Sage Foundation.
[7]. Tao-Fang Huang (2012), The myth of political participation among Asian Americans, PhD Thesis, University of Texas at Austin.
[8]. Alexander Kuo, Neil Malhotra, and Cecilia Hyunjung Mo (2017), Social Exclusion and Political Identity: The Case of Asian American Partisanship, The Journal of Politics, Volume 79, Number 1, 17-32.
[9]. File, Thom . 2015. “Who Votes? Congressional Elections and the American Electorate: 1978-2014.” Current Population Survey Reports, P20-577. U.S. Census Bureau, Washington, DC.
[10]. Nathan Chan. 2021. “Political Inequality in the Digital World: The Puzzle of Asian American Political Participation Online”. Political Research Quarterly, Volume 74, Number 4, 882-898.
[11]. Cho, Wendy. Tam (2002) Tapping Motives and Dynamics behind Campaign Contributions: Insights from the Asian American Case. American Politics Research 30, no. 4, 347–83. https://doi.org/10.1177/1532673X02030004001.
[12]. Cho, Wendy. Tam (2002) Tapping Motives and Dynamics behind Campaign Contributions: Insights from the Asian American Case. American Politics Research 30, no. 4, 347–83. https://doi.org/10.1177/1532673X02030004001.
[13]. Shah S (2016) Growth of Asian American political contributions. In: Data Bits. http://aapidata.com/blog/asian-am-political-contributions/.
[14]. Lauderdale, D.S., Kestenbaum, B. (2000) Asian American ethnic identification by surname. Population Research and Policy Review 19, 283–300. https://doi.org/10.1023/A:1026582308352
[15]. Wong, K. O., Zaïane, O. R., Davis, F. G., & Yasui, Y. (2020). A machine learning approach to predict ethnicity using personal name and census location in Canada. PloS one, 15(11), e0241239. https://doi.org/10.1371/journal.pone.0241239
[16]. Sood, Gaurav & Laohaprapanon, Suriyan (2018). Predicting Race and Ethnicity From the Sequence of Characters in a Name, https://doi.org/10.48550/arxiv.1805.02109
[17]. Sood, Gaurav & Laohaprapanon, Suriyan (2018). Predicting Race and Ethnicity From the Sequence of Characters in a Name, https://doi.org/10.48550/arxiv.1805.02109
[18]. Lauderdale, D.S., Kestenbaum, B. (2000) Asian American ethnic identification by surname. Population Research and Policy Review 19, 283–300. https://doi.org/10.1023/A:1026582308352
[19]. Kennedy, Lesley (2020). How the 2000 Election Came Down to a Supreme Court Decision, History.com, available at: https://www.history.com/news/2000-election-bush-gore-votes-supreme-court
[20]. Trei, Lisa (2004). Why Bush won in 2004, Stanford News, available at: https://news.stanford.edu/pr/2004/polls-1117.html
[21]. W. Yu, Nancy et al. (2005). The Asian American Vote: A Report on the AALDEF Multilingual Exit Poll in the 2004 Presidential Election, The Asian American Legal Defense and Education Fund, available at: https://www.aaldef.org/uploads/pdf/AALDEF-Exit-Poll-2004.pdf
[22]. The Asian American Legal Defense and Education Fund (2018). New Report on the Asian American Vote in the 2008 Elections Shows Widespread Support for Obama and Growing Numbers of First-Time Voters [Press release], available at: https://www.aaldef.org/press-release/new-report-on-the-asian-american-vote-in-the-2008-elections-shows-widespread-support-for-obama-and-g/
[23]. Rapfogel, Nicole & Gee, Emily & Calsyn, Maura (2020). 10 Ways the ACA Has Improved Health Care in the Past Decade, American Progress, available at: https://www.americanprogress.org/article/10-ways-aca-improved-health-care-past-decade/#:~:text=The%20ACA%20generated%20one%20of,since%20the%20ACA%20was%20enacted.
[24]. Borchers, Callum & Wirzbicki, Alan (2012). Asian-Americans backed Obama overwhelmingly, The Boston Globe, available at:
[25]. https://www.bostonglobe.com/news/politics/2012/11/09/asian-americans-voted-more-heavily-for-barack-obama-than/gdcKynV3Hq3OgSeOlNEhHM/story.html
[26]. Huetteman, Emmarie (2018). McCain’s Complicated Health Care Legacy: He Hated the ACA. He Also Saved It., Kaiser Health News, available at:
[27]. https://khn.org/news/mccains-complicated-health-care-legacy-he-hated-the-aca-he-also-saved-it/
[28]. Ramakrishnan, Karthick & Lee, Jennifer& Lee, Taeku & Wong, Janelle (2016). “National Asian American Survey (NAAS) 2016 Post-Election Survey.” Riverside, CA: National Asian American Survey, available at:
[29]. http://naasurvey.com/wp-content/uploads/2017/05/NAAS16-post-election-report.pdf
[30]. Ramakrishnan, Karthick et al. (2016). Report on Registered Voters in the Fall 2016 National Asian American Survey, National Asian American Survey, available at:
[31]. https://naasurvey.com/wp-content/uploads/2016/10/NAAS2016-Oct5-report.pdf
[32]. Ramakrishnan, Karthick et al. (2016). Report on Registered Voters in the Fall 2016 National Asian American Survey, National Asian American Survey, available at:
[33]. https://naasurvey.com/wp-content/uploads/2016/10/NAAS2016-Oct5-report.pdf
[34]. The Asian American Legal Defense and Education Fund (2016). The Asian American Vote 2016: A Report by The Asian American Legal Defense and Education Fund, available at:
[35]. https://www.aaldef.org/uploads/TheAsianAmericanVote2016-AALDEF.pdf
[36]. FeelTheBern Editors (2020). Bernie Sanders on Asian American & Pacific Islander Rights, FeelTheBern, available at: https://feelthebern.org/asian-american-pacific-islander-rights/