


1.Introduction
One of the most significant and important contributors to the worldwide edible oil family is crude palm oil. It originated in West Africa but was brought to Southeast Asia. To this day, the production of crude palm oil is denominated by Indonesia (59%), followed by Malaysia (25%). Thus, this oil became an important oil for both countries as it contributed significantly to their gross domestic product. Despite the continuous debates and environmental concerns associated with this oil, the number of productions continues to surge every year. This growth has allowed numerous producers and refiners to obtain substantial benefits, including the opportunity to go public and list their companies on stock exchanges. This in turn, has opened an avenue for fund managers, individual investors, and stock traders across the globe to participate in the palm oil industry by acquiring ownership through the purchase of their stocks.

Figure 1: Total Production of Crude Palm Oil in 2020
Source: United Nations [1]
Owning a plantation estate and holding plantation stocks may seem to revolve around the same core product, but they entail entirely separate endeavours, accompanied by its own unique challenges and risks. While plantation owners grapple with issues on operational costs, climate impact, and environmental concerns, fund managers, individual investors, and stock traders who have acquired stocks in palm oil companies face a different set of challenges, such as monitoring the financial performance and price movement of core and correlated commodities, as these factors directly influence the stock prices of plantation companies. However, these movements in commodity prices present an opportunity for fund managers, individual investors, and stock traders to participate actively in this dynamic market to manage risk and optimise their returns.
Numerous papers have delved into the repercussions of global commodity price fluctuations on the palm oil industry, yet there remains a dearth of investigations focusing on how these fluctuations affect palm oil companies. A study conducted by [2] emphasised on the impact of palm oil prices on the Kuala Lumpur Composite Index (KLCI) and their findings revealed a cointegration and a positive relationship between these variables. Meanwhile [3] employed wavelet correlation in order to investigate the causality between crude palm oil, exchange rate, and KLCI. Their empirical results are in line with [2] except that no causal effects were found between crude palm oil and exchange rate. Additional studies by [4] and [5] expanded their data by incorporating the Islamic stock index namely the FTSE Bursa Malaysia Emas Shariah (BMES). Both studies found causal relationships between palm oil, KLCI, and BMES, shedding light on the intricate dynamics at play within these markets.
Close to Malaysia, Indonesia stands as the predominant producer of crude palm oil, commanding more than half of the global output, but there has been a lack of research examining the relationship between crude palm oil and the Indonesian stock market. However, a recent study conducted by [6] focused on the influence of global commodities, particularly soybean oil, sunflower oil, and crude palm oil, on the stock prices of prominent palm oil companies, namely Astra Agro Lestari (AAL) and Sinar Mas Agro Resources and Technology (SMART). His findings were intriguing, revealing a cointegration relationship among these variables. Notably, the palm oil companies exhibited a positive correlation with crude palm oil prices, indicating that as crude palm oil prices surged, so did the stock prices of AAL and SMART. In contrast, there was a negative relationship observed between these companies and the prices of soybean oil and sunflower oil. These insights shed valuable light on the dynamics at play in the palm oil industry and its connection to the Indonesian stock market.
While crude palm oil holds a significant position in the global economy and is often regarded as the second "black gold" after crude oil, there has been a limited of research examining its relationship with stock market performance. In contrast, many studies have been devoted to exploring the relationship between various commodities and the stock market. For instance, a study by [7] delved into the impact of gold and platinum on the South Africa Top 40, uncovering a noteworthy finding. Their research highlighted a positive relationship, indicating that increases in the prices of these precious metals led to an increase in the South African Top 40. Similarly, [8] focuses on fuel and non-fuel commodities as independent variables that demonstrate a significant and lasting effect of these commodities on both the Johannesburg (South Africa Top 40) and Nigerian Stock Exchanges (NSE 30), spanning both the long-term and short-term.
Furthermore, [9] investigates the cointegration of salmon prices with the stock prices of four salmon companies which are listed in Oslo Stock Exchange. They employed Johansen’s approach and found a cointegration relationship between salmon price, SALM, and GSF. In addition, [10] investigates relationships between selected agricultural commodities with the Fast Moving Consumer Goods Index in India while [11] focus on the relationship between wheat, rice, sugar, and beef with Turkish and Polish stock exchanges.
Numerous studies have been conducted to examine the impact of global commodity price movements on stock indices. However, it is important to consider whether a similar link exists for individual stock prices. In order to further develop and enhance our understanding of these co-movement, this paper addresses an essential gap in the body of knowledge. Furthermore, this paper also present a thorough analysis of the performance of palm oil companies, this research has chosen the biggest plantation companies from Malaysia, Singapore, and Indonesia, all of which are publicly traded on their respective stock exchanges. The aim of this analysis is to provide a more comprehensive understanding of whether these companies are impacted by the price movement of global commodities. This exploration into these relationships is poised to be invaluable for fund managers, individual investors, and stock traders by assisting them to make informed investment decisions and adjust their strategies when navigating market uncertainties, particularly within the global commodities market. In essence, the primary objective of this paper is to shed light on the impact of global commodity price movements on palm oil companies.
2.Data and Methodology
In order to investigate the co-movement between global commodities and the individual stock prices of palm oil companies, this study adopted the empirical model from [2], [3], [6], and [10] as follows:
\( {SP_{t}}= f({SOY_{t}}, {BRENT_{t}}, {PALM_{t}}, {EXR_{t}} \)) (1)
Sime Darby Plantation Berhad (LnSIME), Wilmar International (LnWILMAR), and Astra Agro Lestari Tbk (lnASTRA) represented palm oil companies (\( {LnSP_{t}}) \)and quoted in domestic currency. Soybean oil (LnSOY), Brent Crude as a proxy of crude oil (LnBRENT), and crude palm oil (LnPALM) represent global commodities quoted in US Dollar. Meanwhile, Malaysian Ringgit (LnMYR), Singapore Dollar (LnSGD), and Indonesia Dollar Rupiah (LnIDR) represent the exchange rates for each country. This paper used weekly data spanning from January 2018 to September 2023 where all data were extracted from the Bloomberg terminal.
Autoregressive Distributed Lags (ARDL) proposed by [12] employed in this paper due to flexibility on the level of stationarity. Long-run cointegration can be employed although variables are integrated at I(0), I(1), or mixed [13] Equation (1) can be written in specific ARDL model as follows:
\( {∆LnSP_{t}}= α+ \sum _{i=1}^{p}{β_{1i}}{∆LnSP_{t-1}}+\sum _{i=0}^{q}{β_{2i}}{∆LnSOY_{t-i}}+ \sum _{i=0}^{q}{β_{3i}}{∆LnBRENT_{t-i}}+ \sum _{i=0}^{q}{β_{4i}}{∆LnPALM_{t-i}}+\sum _{i=0}^{q}{β_{5i}}{∆LnEXR_{t-i}}+{λ_{1}}{LnSP_{t-1}}+ {λ_{2}}{LnSOY_{t-1}}+ { λ_{3}}{LnBRENT_{t-1}}+ {λ_{4}}{LnPALM_{t-1}}+ {λ_{5}}{LnEXR_{t-1}}+ {ε_{t}} \)(2)
Parameters\( {β_{ii}} \)in Equation (2) are the short-run dynamics and\( {λ_{i}} \)implies the ARDL model corresponding multiplier, where the null hypothesis is\( {H_{0}}: {λ_{1}}={λ_{2}}={λ_{3}}={λ_{4}}={λ_{5}}=0 \). The presence of cointegration between palm oil companies and global commodities is found if the null hypothesis is rejected. Moreover, this paper also aims to determine the short-term causality of the regressors on palm oil companies. The following model of causality analysis using ARDL based on the Error Correction Model (ECM) as follows:
\( {∆LnSP_{t}}= α+ \sum _{i=1}^{p}{β_{1i}}{∆LnSP_{t-1}}+\sum _{i=0}^{q}{β_{2i}}{∆LnSOY_{t-i}}+ \sum _{i=0}^{q}{β_{3i}}{∆LnBRENT_{t-i}}+ \sum _{i=0}^{q}{β_{4i}}{∆LnPALM_{t-i}}+\sum _{i=0}^{q}{β_{5i}}{∆LnEXR_{t-i}}+ θ{ECT_{t-1}}+ {ε_{t}} \)(3)
where\( {ECT_{t-1}} \)is an error correction term derived from the cointegration test and it represents the performance of the dependent variable to the lagged deviation from the long-run equilibrium path. Meanwhile\( θ \)denotes the coefficient of error correction term that represents the speed of adjustment towards long-run equilibrium. For\( {ECT_{t-1}} \)to be deemed statistically significant,\( θ \)should have a negative sign. Meanwhile short-run causality is tested by employing Wald test where the null hypothesis of no causality is\( {H_{0}}: {β_{1}}={β_{21}}={β_{3}}={β_{4}}={β_{5}}=0 \). This paper did not employ the traditional causality test based on the Vector Autoregression (VAR) due to the concern of mixed level of stationarity between variables.
3.Empirical Result and Discussion
Table 1 shows a summary of the descriptive statistics of 262 data observations. All variables were converted into logarithms for a more approximate normal distribution. The first moment (mean) shows LnASTRA having the highest value (8.719701), followed by LnWILMAR (1.395266) and LnSIME (0.803211). On the second moment (standard deviation), LnASTRA recorded the highest value (0.170066) indicates the highest volatility, and LnSIME recorded the lowest (0.059039) with the lowest volatility. LnSIME and LnASTRA exhibit asymmetric distributions as it recorded negative values of skewness (third moment), which also indicated longer-tailed on the left side of the distribution. Meanwhile LnWILMAR recorded positive value of skewness which is longer-tailed on the right side. For the fourth moment, the value of kurtosis for all variables is greater than 3, which indicates a heavy-tailed or leptokurtic distribution.
Table 1: Descriptive Statistics
|
Variable/Test |
Mean |
SD |
Skewness |
Kurtosis |
|
|
STOCKS |
LnSIME |
0.803211 |
0.059039 |
-1.248022 |
7.559898 |
|
LnWILMAR |
1.395266 |
0.130924 |
0.020607 |
3.003140 |
|
|
LnASTRA |
8.719701 |
0.170066 |
-0.572087 |
3.492056 |
|
|
COMMODITY |
LnSOY |
3.793857 |
0.368234 |
-0.071428 |
1.330464 |
|
LnBRENT |
4.221590 |
0.316183 |
-0.822191 |
3.881679 |
|
|
LnPALM |
6.670818 |
0.357855 |
0.130564 |
2.135719 |
|
|
EXR |
LnMYR |
1.449091 |
0.041126 |
0.958068 |
2.880950 |
|
LnSGD |
0.309000 |
0.018606 |
0.711901 |
3.406594 |
|
|
LnIDR |
9.586578 |
0.034044 |
0.639397 |
2.845856 |
|
Note: Number of observations for all variables is 262. SD is standard deviation.
Table 2 summarises the unit root test results on the stationarity of variables. The results based on Augmented Dickey Fuller (ADF) and Phillip Perron (PP) show mixed evidence of stationarity, but none of the variables was stationary beyond I(2). Thus, the ARDL model is suitable and effective for cointegration analysis between global commodities and palm oil companies.
Table 2: Unit Root Test
|
Variable/Test |
ADF |
PP |
|||
|
Level |
1st Difference |
Level |
1st Difference |
||
|
STOCKS |
LnSIME |
-4.779724*** |
- |
-4.742660*** |
- |
|
LnWILMAR |
-2.809501* |
- |
-2.438609 |
-16.04549*** |
|
|
LnASTRA |
-2.104367 |
-15.40380*** |
-2.362592 |
-15.46945*** |
|
|
COMMODITY |
LnSOY |
-1.174430 |
-10.33295*** |
-1.132606 |
-18.05861*** |
|
LnBRENT |
-1.534966 |
-7.413507*** |
-1.624346 |
-15.09150*** |
|
|
LnPALM |
-1.586726 |
-9.787538*** |
-1.535401 |
-18.18320*** |
|
|
EXR |
LnMYR |
-1.075212 |
-9.808875*** |
-0.918195 |
-14.45500*** |
|
LnSGD |
-2.915616** |
- |
-2.880082** |
- |
|
|
LnIDR |
-2.378601 |
-6.638518*** |
-2.939941** |
- |
|
Note: ***, **, and * indicate 1%, 5%, and 10% level of significance.
The optimal ARDL lags are based on the lowest Akaike Information Criteria (AIC) and Table 3 shows the results of the bound test for the cointegration. The result shows that only LnSIME and LnASTRA have a cointegration relationship with LnSOY, LnBRENT, LnPalm, and LnEXR. This finding indicates the potential co-movement between Sime Darby Plantation and Astra Agro Lestari with the regressors towards long-run equilibrium. However, no cointegration was found between LnWilmar with the regressors. LnSIME had serial correlation problems, and all models experienced heteroscedasticity. This is understandable due to the global pandemic that occurred in 2020 which caused a tantrum in all markets. However, the results from Ramsey RESET shows all models are well specified. In addition, stability tests based on CUSUM and CUSUMSQ presented in Figure 2-4 show all models are relatively stable, except LnSIME in 2020.
Table 3: ARDL F-Bounds Test
|
Model/Test |
F-Stat |
\( x_{SC}^{2} \) |
\( x_{Het}^{2} \) |
\( RESET \) |
|
LnSIME =\( f \)(LnSOY, LnBRENT, LnPALM, LnMYR)1 |
4.1944** |
12.458*** |
30.2742*** |
1.0452 |
|
LnWILMAR =\( f \)(LnSOY, LnBRENT, LnPALM, LnSGD)2 |
2.5817 |
0.4281 |
23.7543*** |
0.0958 |
|
LnASTRA =\( f \)(LnSOY, LnBRENT, LnPALM, LnIDR)3 |
4.7164*** |
1.1188 |
50.9499*** |
1.0651 |
Note: *** and ** indicate 1% and 5 percent level of significance.
1ARDL AIC (2,0,4,1,1), 2ARDL AIC (3,0,2,0,1), and 3ARDL AIC (1,3,4,0,1)
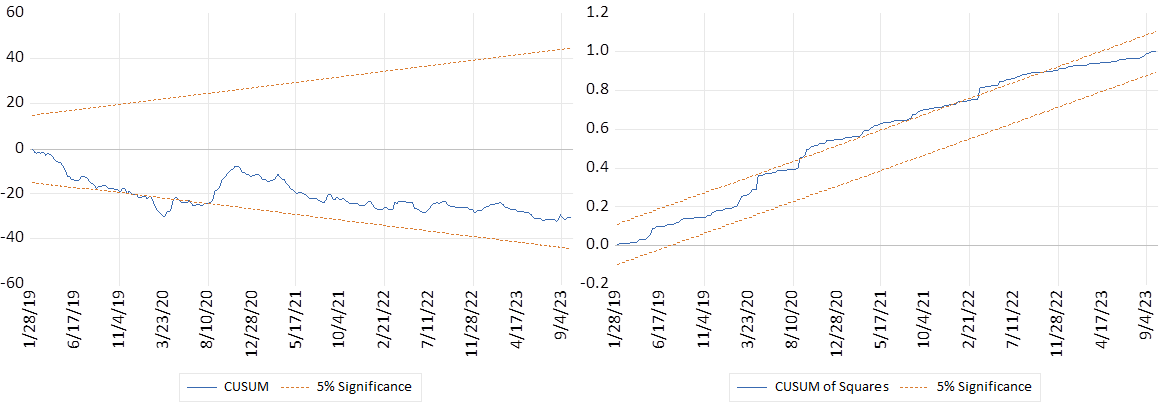
Figure 2: Plots of CUSUM and CUSUMSQ for LnSIME
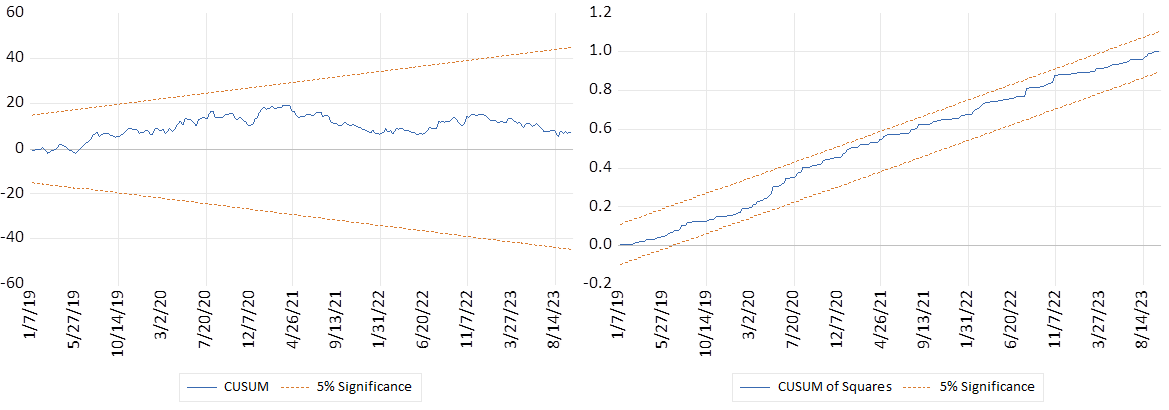
Figure 3: Plots of CUSUM and CUSUMSQ for LnWILMAR
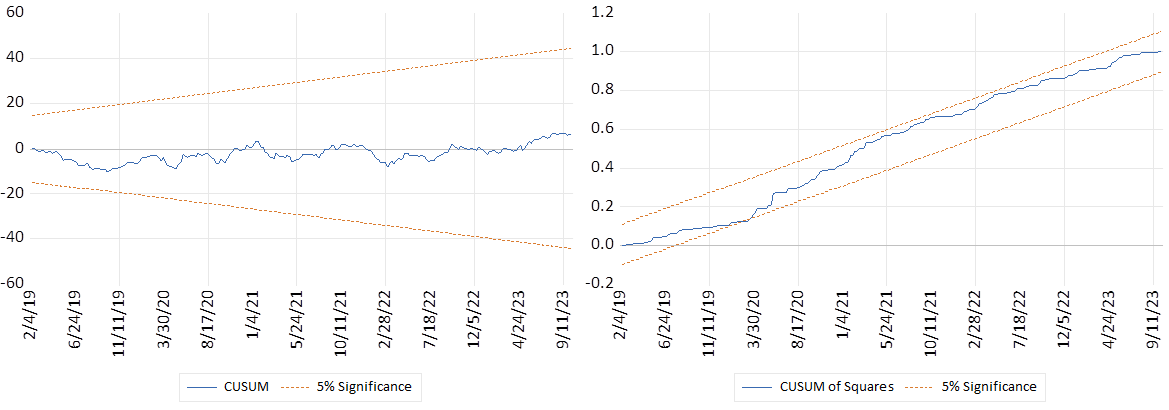
Figure 4: Plots of CUSUM and CUSUMSQ for LnASTRA
This paper proceeds to the estimation of long-run regression coefficients and the results presented in Table 4. For LnSIME, only LnBRENT is statistically significant at 5% level. A 1% increase in Brent crude oil leads to a higher LnSIME of 0.0898%, which implies a positive relationship between Sime Darby Plantation and Brent crude oil. Interestingly, no evidence of cointegration was found between LnSIME and soybean oil, crude palm oil, or the exchange rate. In addition, the significance of the ECT coefficient from the bounds test re-confirms the existence of long-run cointegration. The ECT value of -0.1844 indicates that 18.44% of the deviation from the long-run equilibrium is corrected for 5.42 days.
In the case of LnASTRA, LnSOY and LnBRENT are statistically significant in influencing the stock price of Astra Agro Lestari at the 1 percent level of significance. LnASTRA and LnSOY had a negative relationship where every 1% increase in soybean oil leads to a lower LnASTRA by 0.84%. Brent crude oil is the most responsive to changes for LnASTRA. For every 1 percent change in LnBRENT, the LnASTRA responded positively by 0.94%. Moreover, the coefficient of the ECT theoretically met negative sign. The coefficient of 0.1129 suggests that about 11.29% of disequilibrium is corrected each week for about 8.9 days.
Table 4: Long-Run Coefficient
|
Regressor |
Coefficient |
T-Stat |
|
|
LnSIME =\( f \)(LnSOY, LnBRENT, LnPALM, LMYR) |
LnSOY |
0.011213 |
0.119192 |
|
LnBRENT |
0.089789 |
0.0654** |
|
|
LnPALM |
-0.046257 |
-0.650209 |
|
|
LnMYR |
-0.514210 |
-1.420810 |
|
|
ECT |
-0.184391 |
-5.067538*** |
|
|
LnASTRA =\( f \)(LnSOY, LnBRENT, LnPALM, LnIDR) |
LnSOY |
-0.836756 |
-3.273983*** |
|
LnBRENT |
0.944823 |
6.582514*** |
|
|
LnPALM |
0.195552 |
1.114488 |
|
|
LnIDR |
1.683652 |
0.1423 |
|
|
ECT |
-0.112916 |
-5.373848*** |
Note: *** indicates 1% percent level of significance. ECT is Error Correction Term.
The short-run causality test results are presented in Table 6. In the case of soybean oil, only LnASTRA has a significant causal impact from LnSOY and is insignificant towards LnSIME and LnWILMAR. But the result shows strong evidence for causal impact from LnBRENT to LnSIME, LnWILMAR, and LnASTRA. This indicates the strong role of crude oil in influencing the movement of the stock price of palm oil companies. In addition, the causal impact of crude palm oil is only significant for LnSIME and LnWILMAR. Similar to crude oil, the exchange rate has a significant causal impact on all palm oil companies at the 1% level of significance, except 5% for LnSIME.
Table 5: Causality Test-Based ARDL
|
Null Hypothesis |
F-Stat |
Result |
|
LnSOY ≠> LnSIME |
0.01419 |
LnSOY ≠> LnSIME |
|
LnBRENT ≠> LnSIME |
2.993187** |
LnBRENT => LnSIME |
|
LnPALM ≠> LnSIME |
2.363399* |
LnPALM => LnSIME |
|
LnMYR ≠> LnSIME |
3.822672** |
LnMYR => LnSIME |
|
LnSOY ≠> LnWILMAR |
1.060566 |
LnSOY ≠> LnWILMAR |
|
LnBRENT ≠> LnWILMAR |
4.319658*** |
LnBRENT => LnWILMAR |
|
LnPALM ≠> LnWILMAR |
3.923449** |
LnPALM => LnWILMAR |
|
LnSGD ≠> LnSGD |
10.85556*** |
LnSGD => LnSGD |
|
LnSOY ≠> LnASTRA |
5.428883*** |
LnSOY => LnASTRA |
|
LnBRENT ≠> LnASTRA |
7.174119*** |
LnBRENT => LnASTRA |
|
LnPALM ≠> LnASTRA |
1.545436 |
LnPALM ≠> LnASTRA |
|
LnIDR ≠> LnASTRA |
26.39329*** |
LnIDR => LnASTRA |
Note: ***, **, and * indicate 1%, 5%, and 10% percent level of significance. ‘≠>’ indicates no causal impact, while ‘=>’ indicates evidence of causal impact.
4.Conclusion
This paper investigates the co-movement of global commodities with the palm oil companies listed in FTSE Bursa Malaysia, Singapore Exchange, and Jakarta Exchanges, where the top palm oil companies based on market capitalization from each exchange were selected. The results show that Sime Darby Plantation Berhad, Wilmar International, and Astra Agri Lestari are exposed to the price movement of crude oil, both in the long-run and the short-run. This is interesting because crude oil as an energy commodity is able to influence the stock price of palm oil companies, thus indicating the integration of energy and agriculture markets. Although many studies have shown the cointegration between crude palm oil and soybean oil but result of this study open up another possibility since palm oil companies (except Astra Agri Lestari in the short-run) are not exposed to the price movement of soybean oil. Similarly, this paper also found no evidence of cointegration between crude palm oil and palm oil companies.
The result of this paper will assist fund managers, individual investors, and stock traders in making investment decisions, trading strategies, and portfolio management based on the global commodity markets. Moreover, individual investors who are risk-averse might invest in Wilmar International since this company is not exposed to the price movement of crude oil. Likewise, risk-takers might invest in Sime Darby Plantation or Astra Agri Lestari.
Acknowledgements
This paper is under the Universiti Malaysia Sabah Research Cluster Fund DKP0094.
Conflict of Interest
This paper affirms that none of the authors has any connections with the palm oil companies mentioned, whether financial or otherwise, that could influence the submitted work.
References
[1]. Food and Agriculture Organization of the United Nations. Retrieved from https://www.fao.org/faostat/en/#data/FS
[2]. Nordin, S. and Ismail, R. (2014). The impact of palm oil price on the Malaysian stock market performance. Journal of Economics and Behavioral Studies, 6(1), pp. 1-9.
[3]. Saiti, B., Ali, A., Abdullah, N., and Sajilan, S. (2014). Palm oil price, exchange rate, and stock market: A Wavelet analysis on the Malaysian market. Eurasian Journal of Economics and Finance, 2(1): 13-27.
[4]. Razman, R. and Mansur, M. (2017). The links between crude palm oil, conventional and Islamic stock markets: Evidence from Malaysia based on continuous and discrete wavelet analysis. MPRA Paper.
[5]. Othman, N. and Mansur, M. (2018). Granger-causality between palm oil, gold, and stocks (Islamic and conventional: Malaysian evidence based on ARDL approach. MPRA Paper.
[6]. Arintoko, A. (2021). The stock price response of palm oil companies to industry and economic fundamentals. Journal of Asian Finance, Economics, and Business, 8(3): 99-110.
[7]. Mongale, I.P. and Eita, J.H. (2014). Commodity prices and stock market performance in South Africa. Corporate Ownership and Control, 11(4): 370-375.
[8]. Oyelami, L. and Yinusa, D. (2019). Global commodity prices and stock market nexus: Sub-Sahara African perspective. Acta Universitatis Danubius: Oeconomica, 15(4): 244-258.
[9]. Zhang, D., Myrland, O., and Xie, J. (2016). Firm size, commodity price, and interdependence between firm-level stock price: The case of Norwegian salmon industry. Applied Economics and Finance, 3(4): 179-189.
[10]. Kaur, G. and Dhiman, B. (2019). Agricultural commodities and FMCG stock prices in India: Evidence from the ARDL bound test and the Toda and Yamamoto causality analysis. Global Business Review, 22(5): 1190-1201.
[11]. Ilarslan, K. and Yildiz, M. (2022). Do international agricultural commodity price have an effect on the stock market index? A comparative analysis between Poland and Turkey. Sosyoekonomi, 30(52): 87-107.
[12]. Pesaran, M.H., Shin, Y., and Smith, R.J. (2001). Bound testing approaches to the analysis of level relationships. Journal of Applied Econometrics, 16(3): pp 289-326.
[13]. Zimon, G., Pattak, D.C., Voumik, L.C., Akter, S., Kaya, F., Walasek, R., and Kochanski, K. (2023). The impact of fossil fuels, renewable energy, and nuclear energy on South Korea’s environment based on the STIRPAT model: ARDL, FMOLS, and CCR approaches. Energies 16(17): pp 6198-6219.
Cite this article
Jamil,I.;Kogid,M.;Lim,T.S.;Lajuni,N. (2024). Does the Performance of Global Commodities Exhibit Co-movement and Long-run Relationship with the Palm Oil Companies?. Advances in Economics, Management and Political Sciences,74,20-28.
Data availability
The datasets used and/or analyzed during the current study will be available from the authors upon reasonable request.
Disclaimer/Publisher's Note
The statements, opinions and data contained in all publications are solely those of the individual author(s) and contributor(s) and not of EWA Publishing and/or the editor(s). EWA Publishing and/or the editor(s) disclaim responsibility for any injury to people or property resulting from any ideas, methods, instructions or products referred to in the content.
About volume
Volume title: Proceedings of the 3rd International Conference on Business and Policy Studies
© 2024 by the author(s). Licensee EWA Publishing, Oxford, UK. This article is an open access article distributed under the terms and
conditions of the Creative Commons Attribution (CC BY) license. Authors who
publish this series agree to the following terms:
1. Authors retain copyright and grant the series right of first publication with the work simultaneously licensed under a Creative Commons
Attribution License that allows others to share the work with an acknowledgment of the work's authorship and initial publication in this
series.
2. Authors are able to enter into separate, additional contractual arrangements for the non-exclusive distribution of the series's published
version of the work (e.g., post it to an institutional repository or publish it in a book), with an acknowledgment of its initial
publication in this series.
3. Authors are permitted and encouraged to post their work online (e.g., in institutional repositories or on their website) prior to and
during the submission process, as it can lead to productive exchanges, as well as earlier and greater citation of published work (See
Open access policy for details).
References
[1]. Food and Agriculture Organization of the United Nations. Retrieved from https://www.fao.org/faostat/en/#data/FS
[2]. Nordin, S. and Ismail, R. (2014). The impact of palm oil price on the Malaysian stock market performance. Journal of Economics and Behavioral Studies, 6(1), pp. 1-9.
[3]. Saiti, B., Ali, A., Abdullah, N., and Sajilan, S. (2014). Palm oil price, exchange rate, and stock market: A Wavelet analysis on the Malaysian market. Eurasian Journal of Economics and Finance, 2(1): 13-27.
[4]. Razman, R. and Mansur, M. (2017). The links between crude palm oil, conventional and Islamic stock markets: Evidence from Malaysia based on continuous and discrete wavelet analysis. MPRA Paper.
[5]. Othman, N. and Mansur, M. (2018). Granger-causality between palm oil, gold, and stocks (Islamic and conventional: Malaysian evidence based on ARDL approach. MPRA Paper.
[6]. Arintoko, A. (2021). The stock price response of palm oil companies to industry and economic fundamentals. Journal of Asian Finance, Economics, and Business, 8(3): 99-110.
[7]. Mongale, I.P. and Eita, J.H. (2014). Commodity prices and stock market performance in South Africa. Corporate Ownership and Control, 11(4): 370-375.
[8]. Oyelami, L. and Yinusa, D. (2019). Global commodity prices and stock market nexus: Sub-Sahara African perspective. Acta Universitatis Danubius: Oeconomica, 15(4): 244-258.
[9]. Zhang, D., Myrland, O., and Xie, J. (2016). Firm size, commodity price, and interdependence between firm-level stock price: The case of Norwegian salmon industry. Applied Economics and Finance, 3(4): 179-189.
[10]. Kaur, G. and Dhiman, B. (2019). Agricultural commodities and FMCG stock prices in India: Evidence from the ARDL bound test and the Toda and Yamamoto causality analysis. Global Business Review, 22(5): 1190-1201.
[11]. Ilarslan, K. and Yildiz, M. (2022). Do international agricultural commodity price have an effect on the stock market index? A comparative analysis between Poland and Turkey. Sosyoekonomi, 30(52): 87-107.
[12]. Pesaran, M.H., Shin, Y., and Smith, R.J. (2001). Bound testing approaches to the analysis of level relationships. Journal of Applied Econometrics, 16(3): pp 289-326.
[13]. Zimon, G., Pattak, D.C., Voumik, L.C., Akter, S., Kaya, F., Walasek, R., and Kochanski, K. (2023). The impact of fossil fuels, renewable energy, and nuclear energy on South Korea’s environment based on the STIRPAT model: ARDL, FMOLS, and CCR approaches. Energies 16(17): pp 6198-6219.