


1.Introduction
Tesla is a technology company that has risen rapidly in recent years and has excellent strengths as well as resources in the areas of new energy and automotive innovation. This has led to a significant share of the stock market [1]. Meanwhile, machine learning has been a prominent area of research in recent years, aiming to find patterns in data for analysis and prediction in various aspects. Currently, time series forecasting methods are generally used in stock forecasting. However, since traditional neural networks (RNNs) are unable to model time series, long- and short-term memory models (LSTMs) and differential autoregressive moving average models (ARIMA), which can be used for time series forecasting, have become popular predictive analytical models and are extensively employed in numerous disciplines in the last few years, such as image processing for computer vision, economic and financial forecasting [2]. Both ARIMA and LSTM are classical models used for time series forecasting.ARIMA is a statistical method based on difference and autoregressive moving average models, which can be used to capture trends and seasonality in a time series.LSTM is a neural network-based model that can be used for forecasting by learning the long-term dependencies of a time series. Combining ARIMA and LSTM can form an ARIMA-LSTM hybrid model, and this hybrid model can better utilize the respective advantages of ARIMA and LSTM to improve the accuracy of time series forecasting [2]. Therefore, this research aims to combine ARIMA and LSTM models to forecast and analyze the stock trend of Tesla [3]. Research in this area can advance the trend analysis of the market in such complex areas as stocks. It also gives investors a more reliable reference template.
2.Literature Review
The prediction of stock market prices is a complex and demanding task that involves various factors, including physical aspects, investor emotions, and market rumors. In this study, Srivastava and Mishra explore different algorithms for stock market prediction, ranging from simple ones like Simple Average and Linear Regression to advanced methods such as ARIMA and LSTM [4]. Based on these results, LSTM will be more appropriate for stock market prediction.
Zhao et al. propose a research technique that utilizes an enhanced version of Recurrent neural networks (RNNs), in particular models with long short-term memory (LSTM) [5]. They used stochastic gradient descent to maintain the weights of each data variable, aiming to achieve more efficient and accurate results than existing stock price prediction systems. To evaluate their approach, they use the TESLA Inc. dataset from Yahoo Finance. By analyzing the closing prices and training the LSTM model, they generate stock forecasts and compute the Root Mean Squared Error (RMSE) to assess correctness and effectiveness. The results of the study suggest that LSTM is recommended for stock market forecasts.
Hu & Chen present a novel LSTM-based neural network model for stock price prediction [6]. It incorporates Differential Evolution (DE) to optimize ten network hyperparameters simultaneously, achieving an RMSE of 8.092. Aldhyani & Alzahrani propose a strong deep learning-based framework for stock market prediction [7]. It makes predictions about the closing prices of Apple and Tesla stock using hybrid CNN-LSTM and LSTM techniques. The evaluation measures, including MSE, RMSE, NRMSE, and Pearson's correlation, indicate that the CNN-LSTM model performs slightly better, outperforming other models and achieving high R-squared values of 98.37% for Tesla and 99.48% for Apple. Chen combines the ARIMA model with Monte-Carlo simulation for a flexible asset allocation strategy [8]. By predicting stock prices using ARIMA and incorporating Monte-Carlo simulation, the proposed model outperforms traditional allocation methods, showing higher profitability and accuracy.
A new method for predicting stock market trends is proposed in this paper. The Stacked Bidirectional Long- and Short-Term Memory (SBLSTM) network uses three bi-directional LSTM networks stacked together to improve accuracy. The SBLSTM network is tested on six datasets collected by Yahoo Finance and outperforms other methods in terms of accuracy [9].
This paper mainly uses machine learning to forecast Tesla stock and uses the combined ARMI-LSTM model to forecast stock prices. First, this paper is relevant to the work of Srivastava and Mishra, as both explore the application of the LSTM model to stock market forecasting. However, the difference in this paper is that it attempts to combine ARIMA and LSTM models, aiming to combine the advantages of both and improve the prediction accuracy. Srivastava and Mishra's study was more about comparing the effects of different algorithms. Second, compared with the study of Liu the biggest difference between this study and the previous one is that it adopts the ARMI-LSTM combination approach instead of just LSTM. Zhao and colleagues focus more on optimizing the LSTM model itself, especially weight maintenance [10]. In addition, Hu & Chen proposed a new model based on LSTM and an integrated differential evolution algorithm to optimize network parameters. This is somewhat similar to the goal of this article, but it focuses on combining ARIMA and LSTM rather than integrating other algorithms.
3.Method
3.1.Data Source and Pre-processing
The Tesla stock data for the predictive analysis was obtained from Model Whale [11]. This dataset mainly records the daily stock data of Tesla from 2010 to 2020, and this research selects the data from 2010 to 2017 to train the prediction using the SARIMA- LSTM model to get the result from 2017 to 2020 and then compares it with the actual data of Tesla stock from 2017 to 2020 to analyze the whole research. In order to facilitate the statistical analysis, this dataset was preprocessed for this experiment by converting the daily stocks to weekly stocks and finding the mean value.
3.2.Data Inspection and Analysis
(1) Original series visualization

Figure 1: Original sequence visualization
(2) Original sequence test analysis: smoothness test and white noise test
The original series test failed, indicating that the sample series was initially judged as a non-stationary time series (Figure 1). Based on the ADF test, the test statistic value is 0.8309135088968064, which exceeds the critical value for the 1%, 5%, and 10% significance levels. Furthermore, the p-value = 0.8309135088968064<0.05 suggests that the original data series is smooth. The result of the white noise test indicates that p-value=0.8309135088968064 is greater than 0.05, which means that the time series is a non-stationary white noise series and requires analysis through differential tests.
(3) Differential sequence visualization

Figure 2: Visualization of difference sequence
Figure 2 shows the results of the first-order difference sequence visualization using diff() in pandas for the above unsteady white noise sequence.
(4) Differential sequence test analysis
Based on the differential series test, it appears that the sample sequence displays a specific trend and was initially categorized as a smooth time series. According to the ADF test results, the Test Statistic value is -15.410624351066424, which is less than the critical value for significance levels of 1%, 5%, and 10% as given by the Critical Value. Furthermore, the p-value=3.1269945227949604e-28<0.05, which implies that the original data sequence is smooth. The white noise test also indicates that the p-value=2.63003539e-10 is less than 0.05, illistrating that the time series is a smooth non-white noise series, allowing for further analysis through subsequent modeling.
(5) ACF/PACF to determine the order of model fitting
The model must be in fixed order once the data is smoothed, i.e., determine the order of p and q. Observing the above figure, it is found that both autocorrelation and partial phase coefficients are characterized by trailing, and they both have an obvious second-order correlation.
4.SARIMA Model Analysis
(1) Finding the optimal parameters by grid search
The grid search is done by iterating different combinations of parameters to obtain the best parameters for the SARIMA model, i.e. to evaluate SARIMA. In evaluating and comparing models with different parameters. The smaller its AIC value means the better the model. The best result is (0, 1, 1) (0, 1, 1, 12).
(2) SARIMA model analysis with optimal parameters

Figure 3: SARIMA model analysis with optimal parameters
The summary attributes generated by the SARIMA output return a wealth of information, which is interpreted as follows: The significance of each feature's weights is indicated by the P>|z| column, where the p-values of the weights are all less than or near to 0.05 for a significant effect. The coef column shows the weight (i.e., importance) of each feature and its effect on the time series (Figure 3).
(3) Model testing (white noise test on residual series)
It is found that the statistic's p-value exceeds the significance level of 0.05, which passes the test of significance, and the results indicate that ARIMA (2, 1, 1), the residual series of the model is a white noise series, the model is significantly valid, and the model performs well.
(4) Model residual analysis
The residual test is one of the methods often used in statistics to test whether the linear regression model meets the assumptions. When performing linear regression, this essay fits a model based on the data and observes whether the residuals of the model (The discrepancy between the observed value and the model-predicted value) have some specific properties.
Typically, the model is well-fitted if the residuals possess a normal distribution with an equal variance and a zero mean. Whereas, if the residuals do not satisfy the above conditions, it indicates that there may be problems with the model and further adjustments or improvements are needed.
When performing residuals testing, common methods include:
1—> Plotting visual residuals: residuals over time have no apparent seasonality and appear to be white noise.
2—> Plotting a normal distribution of the residuals: As can be seen, the red KDE line tightly follows the N(0,1) line (where N(0, 1) is the standard sign of a normal distribution with mean 0 and standard deviation 1). A good indication can be obtained from the normal distribution of residuals.
3—> Plotting a Q-Q plot: the residuals are sorted by magnitude and correspond to the quantile of the standard normal distribution, and then plotted as a scatter plot. If the scatter plot approximates a straight line, it suggests that the residuals are normally distributed.
4 —> Plotting autocorrelation indicates that the correlation between the time series residuals and their lagged values is low (Figure 4).
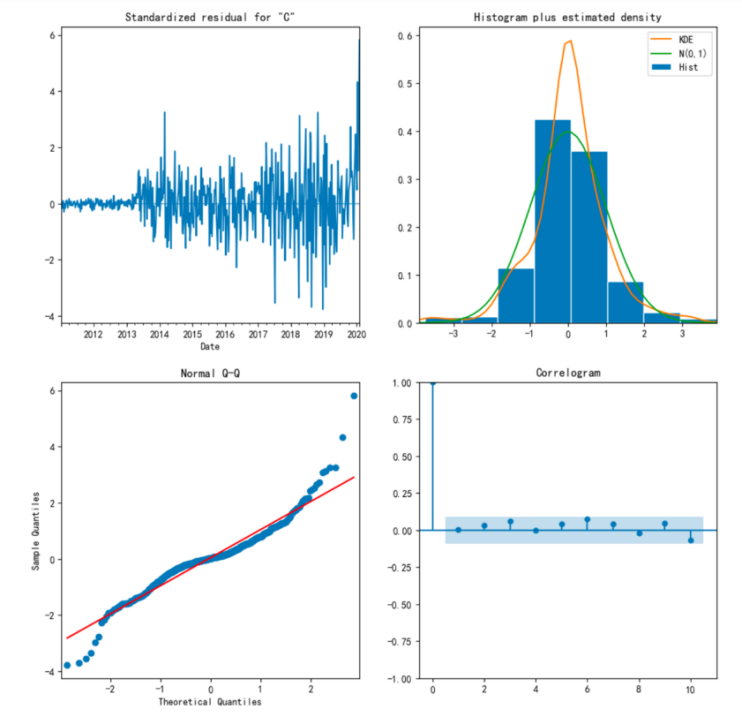
Figure 4: Plotting autocorrelation
5.SARIMA Model Evaluation

Figure 5: Model internal test (forecast 2017-2020)
Forecasts can be produced using the time series SARIMA model once it has been obtained. Plotting the time series' observed and anticipated values reveals that, even when dynamic forecasting is used, the overall prediction is correct (Figure 5); Every projected value (orange line) falls within the predicted confidence intervals (gray areas) and agrees well with the ground reality (blue line); the evaluation metrics are MAE\MSE\MAPE\SMAPE and so on. Overall, the prediction is consistent with the true value, presenting an overall trend that matches well.
6.SARIMA-LSTM Model Analysis
(1) Obtain the residual value of SARIMA and merge it with the stock price, the first column is the stock price, the second column is the SARIMA residual value, and prepare for the next SARIMA-LSTM combination(Figure 6).

Figure 6: Obtaining the residual value of SARIMA and merging it with the stock price
(2) Constructing time series data with the previous week to predict the following week.
(3) Dividing the training and test sets, and LSTM training prediction
Training the data set from 2010 to 2016 and then training the test set from 2017 to 2020. The training set is trained with LSTM to obtain the LSTM model. The test set is then analyzed for forecasting.
(4) Model process evaluation
Loss loss result visualization: analyze the process of model training, the lower the loss loss value the better.(Figure 7)

Figure 7: Model process evaluation
(5) Prediction results
The last step is to perform the model evaluation metrics as well as the real and predicted values visualization and analysis based on the experimental results mentioned above. The results from the model predictions are used to normalize the original order of magnitude for model evaluation. The images of real and predicted data are also drawn and displayed in Figure 8.

Figure 8: Prediction results
7.Conclusion
Overall, the prediction is consistent with the true value, presenting an overall trend that matches well. It shows that it is possible to predict the trend of tech company stocks like Tesla more accurately with the arima-lstm model. Combining ARIMA and LSTM models for forecasting can simulate stock movements more accurately, but stock forecasting is still too complex to use good time series models and neural network models. It is not enough to forecast only based on past stock data; it must be combined with future stock markets (possibly involving human studies such as social relations), so using the ARMI-LSTM model to forecast is still too idealistic. Future research should consider combining multiple data sources and models to improve forecasting accuracy, such as incorporating social media sentiment analysis, macroeconomic indicators, and other relevant factors. In addition, we can explore the combination of other advanced technologies such as deep learning and reinforcement learning with traditional time series models to achieve a more comprehensive and accurate prediction of the stock market."
References
[1]. Liu, S. (2021). Competition and Valuation: A Case Study of Tesla Motors. IOP Conference Series: Earth and Environmental Science, 692(2), 022103. Researchgate. https://doi.org/10.1088/1755-1315/692/2/022103
[2]. S. Makridakis, E. Spiliotis, and V. Assimakopoulos, 2018. “Statistical and Machine Learning forecasting methods: Concerns and ways forward,” PLOS ONE, vol. 13, no. 3, p. e0194889.
[3]. Niedermeyer, E. (2019). Ludicrous : the unvarnished story of Tesla Motors. Benbella Books, Inc.
[4]. Srivastava, P., & Mishra, P. K. (2021, October). Stock Market Prediction Using RNN LSTM. In2021 2nd Global Conference for Advancement in Technology (GCAT)(pp. 1-5). IEEE.
[5]. Zhao, T., Zhang, Y., & Olukotun, K. (2019). Serving recurrent neural networks efficiently with a spatial accelerator.Proceedings of Machine Learning and Systems,1, 166-177.
[6]. Hu, Y. L., & Chen, L. (2018). A nonlinear hybrid wind speed forecasting model using LSTM network, hysteretic ELM and Differential Evolution algorithm. Energy conversion and management, 173, 123-142.
[7]. Aldhyani, T. H., & Alzahrani, A. (2022). Framework for predicting and modeling stock market prices based on deep learning algorithms.
[8]. Chen, Z. (2022). Asset Allocation Strategy with Monte-Carlo Simulation for Forecasting Stock Price by ARIMA Model.
[9]. Lim, J. Y., Lim, K. M., & Lee, C. P. (2021, September). Stacked bidirectional long short-term memory for stock market analysis. In 2021 IEEE International Conference on Artificial Intelligence in Engineering and Technology (IICAIET) (pp. 1-5). IEEE.
[10]. Liu, S. (2021). Competition and Valuation: A Case Study of Tesla Motors. IOP Conference Series: Earth and Environmental Science, 692(2), 022103. Researchgate.
[11]. Data source. Model Whale (https://www.heywhale.com/mw/dataset/6374aadfb1d622f1cb68f2ca/file)
Cite this article
Jiang,Z. (2024). Predictive Analysis of Tesla Inc. Stock with Machine Learning. Advances in Economics, Management and Political Sciences,76,8-14.
Data availability
The datasets used and/or analyzed during the current study will be available from the authors upon reasonable request.
Disclaimer/Publisher's Note
The statements, opinions and data contained in all publications are solely those of the individual author(s) and contributor(s) and not of EWA Publishing and/or the editor(s). EWA Publishing and/or the editor(s) disclaim responsibility for any injury to people or property resulting from any ideas, methods, instructions or products referred to in the content.
About volume
Volume title: Proceedings of the 3rd International Conference on Business and Policy Studies
© 2024 by the author(s). Licensee EWA Publishing, Oxford, UK. This article is an open access article distributed under the terms and
conditions of the Creative Commons Attribution (CC BY) license. Authors who
publish this series agree to the following terms:
1. Authors retain copyright and grant the series right of first publication with the work simultaneously licensed under a Creative Commons
Attribution License that allows others to share the work with an acknowledgment of the work's authorship and initial publication in this
series.
2. Authors are able to enter into separate, additional contractual arrangements for the non-exclusive distribution of the series's published
version of the work (e.g., post it to an institutional repository or publish it in a book), with an acknowledgment of its initial
publication in this series.
3. Authors are permitted and encouraged to post their work online (e.g., in institutional repositories or on their website) prior to and
during the submission process, as it can lead to productive exchanges, as well as earlier and greater citation of published work (See
Open access policy for details).
References
[1]. Liu, S. (2021). Competition and Valuation: A Case Study of Tesla Motors. IOP Conference Series: Earth and Environmental Science, 692(2), 022103. Researchgate. https://doi.org/10.1088/1755-1315/692/2/022103
[2]. S. Makridakis, E. Spiliotis, and V. Assimakopoulos, 2018. “Statistical and Machine Learning forecasting methods: Concerns and ways forward,” PLOS ONE, vol. 13, no. 3, p. e0194889.
[3]. Niedermeyer, E. (2019). Ludicrous : the unvarnished story of Tesla Motors. Benbella Books, Inc.
[4]. Srivastava, P., & Mishra, P. K. (2021, October). Stock Market Prediction Using RNN LSTM. In2021 2nd Global Conference for Advancement in Technology (GCAT)(pp. 1-5). IEEE.
[5]. Zhao, T., Zhang, Y., & Olukotun, K. (2019). Serving recurrent neural networks efficiently with a spatial accelerator.Proceedings of Machine Learning and Systems,1, 166-177.
[6]. Hu, Y. L., & Chen, L. (2018). A nonlinear hybrid wind speed forecasting model using LSTM network, hysteretic ELM and Differential Evolution algorithm. Energy conversion and management, 173, 123-142.
[7]. Aldhyani, T. H., & Alzahrani, A. (2022). Framework for predicting and modeling stock market prices based on deep learning algorithms.
[8]. Chen, Z. (2022). Asset Allocation Strategy with Monte-Carlo Simulation for Forecasting Stock Price by ARIMA Model.
[9]. Lim, J. Y., Lim, K. M., & Lee, C. P. (2021, September). Stacked bidirectional long short-term memory for stock market analysis. In 2021 IEEE International Conference on Artificial Intelligence in Engineering and Technology (IICAIET) (pp. 1-5). IEEE.
[10]. Liu, S. (2021). Competition and Valuation: A Case Study of Tesla Motors. IOP Conference Series: Earth and Environmental Science, 692(2), 022103. Researchgate.
[11]. Data source. Model Whale (https://www.heywhale.com/mw/dataset/6374aadfb1d622f1cb68f2ca/file)