


1. Introduction
In the era of trade globalization, the rise of East Asian economies has significantly reshaped the global economic landscape. This transformation highlights the crucial role played by East Asian countries in international trade. The booming economic strength of East Asia has resulted in economic imbalances, particularly evident in the trade imbalances between developed and developing countries. This disparity is typically characterized by one country consistently maintaining a trade surplus while another endures a persistent trade deficit. Against this backdrop, this study delves into the economic development patterns of the United States and East Asian countries, attempting to reveal the potential mechanisms of sustained trade imbalances. The study aims to provide insights into the interplay between economic development disparities, international division of labor, savings-investment gaps, and their implications for trade imbalances. The research endeavors to contribute to a more comprehensive understanding of the evolving dynamics of the global economy, fostering more balanced and sustainable trade relationships in today’s increasingly interconnected world.
2. Theory
The rise of GVCs has provided opportunities for developing countries to integrate into the global economy [1]. However, there has been a long-term trade deficit between the United States and East Asian countries, which has increased year by year. The trade deficit between the United States and some countries (regions) in East Asia is shown in table 1. This part will analyze the imbalance from three aspects: the international division of labor, the development model and the savings-investment gap.
Table 1: US trade deficit by country (region) (unit: million US dollars).
2007 | 2009 | 2011 | 2013 | 2015 | 2017 | 2019 | 2021 | |
China | 2586.62 | 2272.36 | 2951.87 | 3187.64 | 3675.66 | 3742.65 | 3416.9 | 3527.98 |
Japan | 854.83 | 448.61 | 646.24 | 747.96 | 712.8 | 692.6 | 696.86 | 606.89 |
Korea | 129.12 | 126.62 | 123.61 | 194.27 | 279.65 | 225.88 | 176.79 | 292.52 |
ASEAN-5 | 5577.57 | 4856.59 | 5732.72 | 6142.87 | 6683.11 | 6678.13 | 6309.55 | 6448.39 |
Source: World Bank, Bureau of Economic Analysis.
2.1. International division of labor and industrial transfer
2.1.1. The comparative advantage and absolute advantage theory
On the issue of trade imbalance, comparative advantage and absolute advantage are given different explanations. Traditional comparative advantage advocates free trade. Based on the theory of factor endowment, it is believed that a country should export abundant factor-intensive products and import scarce factor-intensive products, so that the resources of both countries can be fully utilized [2]. Therefore, trade would benefit all countries and automatically bring the economy into equilibrium. Persistent trade imbalances are caused by non-market factors, such as government intervention [3]. However, the theory of absolute advantage holds that trade does not automatically balance. The flow of international trade is caused by the difference between price and real cost, and the imbalance is the normal result of trade competition [4].
In the trade between the United States and East Asian countries, the persistent trade deficit of the United States is often based on the comparative advantage theory, which is believed to be the currency manipulation of East Asian countries. However, more phenomena can be explained by absolute advantage theory. Firms have divested less competitive sections of their operations or relocated parts of the production process in order to reduce costs [5]. In terms of labor costs, Although the level of physical productivity is the same, the wages of workers in East Asian countries are much lower than those in the United States. This difference in labor costs will lead to changes in the production structure and the transfer of international industries [6]. The United States has outsourced more middle and low-end labor-intensive industries to East Asian countries with lower wages and higher-skilled workers. For example, China's low manufacturing costs and a large number of flexible labor force have led to an increasing share of manufacturing while the share of manufacturing in the United States has declined, forming a clear industrial division [7]. Figure 1 shows the proportion of manufacturing in GDP in the United States and some East Asian countries.
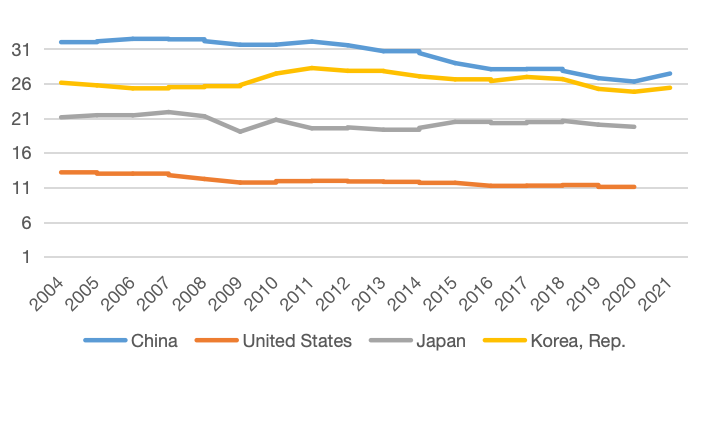
Figure 1: Manufacturing, value added (% of GDP).
Source: World Bank national accounts data.
As a result, East Asian countries have become increasingly important in global manufacturing, with increasing exports and a growing trade deficit. However, in the high-tech industry, in order to maintain technological hegemony, the United States implements export control on some countries and is reluctant to export high-tech products to them, such as restricting the export of chips and semiconductors, while Americans rely on imports for most of their daily consumer goods, then the United States will form a trade deficit with these countries, resulting in trade imbalance.
2.1.2. The flying-geese model
The flying-geese model can also be seen as a supplement to the absolute advantage theory based on cost differences, which refers to the process of transferring an industry to a different country due to cost and industrial upgrading. According to experts who have examined the economic and industrial structural reforms in East Asian nations, they believed that these nations are in the economic development mode of the flying-geese model [8].
Japan is the leading country in this model, followed by Korea, Taiwan, Hong Kong, and Singapore, and then next are the mainland China and ASEAN countries, including Indonesia, Malaysia, the Philippines, and Thailand. In other words, Japan initially established a given industry, and when the technology matured, the cost of manufacturing rose, the competitiveness of these products in Japan decreased, and then these industries were transferred to Korea and the other four countries. Simultaneously, Japan's industrial structure was updated to a higher degree. Similarly, when these four countries evolved in that industry, the production of these products moved to lower-cost countries for development [9].
China has become a major exporter because of its low labor costs, taking over some of the industries from Japan and South Korea. However, in recent years, due to the upgrading of its industries, the increasing cost of labor, and the tariffs imposed by the United States on China, China's position of cost advantage has gradually weakened. According to the flying-geese model, these industries in China will therefore move to lower-cost Southeast Asia, and would not reduce the U.S. trade deficit. This is one of the reasons for the long-term trade imbalance between the United States and East Asia as a whole.
2.2. Differences in economic development models
2.2.1. The consumption-oriented model of the United States--The Keynesian political economy
The core of Keynes's economic policy view is to oppose laissez-faire and advocate government intervention [10]. The expansion of government functions, according to Keynes, refers mainly to the functions of regulating the consumption tendency and investment inducement. Because the purchase of commodities provides income, and wealth stimulates its users to buy commodities, every initial addition to demand multiplies into a series of additions to demand. Since increased demand depletes enterprises' stocks of manufactured goods, this demand growth will also encourage working capital investment to rebuild inventories. This investment will increase demand and revenues, which will then multiply into a series of expenditures. The circularity that results from the relationship between earnings and expenditures breeds a propensity for cumulative processes. An increase in investment or demand will result in an increase in output, demand, and employment that is self-reinforcing. A drop in demand will result in a self-reinforcing decline in output, employment, and demand [11].
The United States was led by this pattern of high consumption under Keynesian policies, which boosted economic growth by stimulating demand. For example, the government increased transfer payments and reduced taxes through fiscal policies, using monetary policies to lower interest rates and encourage consumer credit. In addition, it also stimulated consumption from the perspective of income policies with high wages and high welfare [12].
2.2.2. The export-oriented model of East Asian countries
East Asian countries are generally regarded as export-oriented economies [13]. In order to promote exports, it is necessary to maintain international competitiveness, and that competitiveness usually requires an undervalued currency. In the case of trade surplus, East Asian countries have been accumulating US financial assets and keeping US dollar reserves to compete for exports by pushing down the exchange rate, thus leading to long-term imbalance [14]. The global official international reserves increased from $1.513 trillion in 1995 to $6.809 trillion in 2007 and to $11.84 trillion as of July 2018. Most of the growth was concentrated in developing countries and East Asia [15]. Therefore, the current account surplus is a natural result of this growth pattern [16].
2.3. Savings-investment gap--Global savings glut hypothesis
According to Bernanke's global savings glut hypothesis, the cause of current account deficits is insufficient domestic saving, and countries with high domestic investment needs will have more imports than exports. Therefore, investment in deficit economies cannot be driven by domestic savings and must be financed from surplus economies [3].
The difference between savings and investment is equal to the current account balance. Due to the similarities between cultures and family values among East Asian countries, their savings rate is higher than their investment rate, and their willingness to consume is not strong, which is very different from that of the United States. A high savings rate leads to positive net exports and a current account surplus. And it produces insufficient domestic consumption demand, which needs to rely on external demand. The U.S., due to its consumption-oriented model, has a faster rate of domestic investment than savings, negative net exports and a current account deficit. Fast-growing demand has forced the U.S. to rely on external savings, which in turn fills the gap of under-consumption in East Asia, making these two economies more interdependent [6]. The difference in savings between East Asia and the United States leads to the current account imbalance, leaving the U.S. with a persistent trade deficit with East Asia.
3. Empirical approach
This part focuses on savings-investment gaps, using a case study approach and modeling approach to empirically investigate the global savings glut hypothesis. The savings and investment rates of China, Japan, and South Korea in 2007-2021 are selected as cases to compare with that of the United States. Based on the two-gap model, i.e., S-I=X (X is net exports), the savings-investment gap between the four countries is calculated (table 2-5).
Table 2: Investment Savings Gap--U.S. (% of GDP).
2006 | 2008 | 2010 | 2012 | 2014 | 2016 | 2018 | 2020 | |
Savings (S) | 19.16 | 15.02 | 15.30 | 18.60 | 20.19 | 18.99 | 19.72 | 19.30 |
Investment (I) | 23.54 | 21.04 | 18.67 | 19.95 | 20.78 | 20.57 | 21.14 | 21.15 |
S-I | -4.38 | -6.02 | -3.38 | -1.35 | -0.59 | -1.57 | -1.43 | -1.85 |
Source: World Bank national accounts data.
Table 3: Investment-Savings Gap--China (% of GDP).
2006 | 2008 | 2010 | 2012 | 2014 | 2016 | 2018 | 2020 | |
Savings (S) | 48.26 | 51.79 | 51.33 | 48.67 | 47.62 | 44.38 | 44.49 | 44.02 |
Investment (I) | 39.91 | 42.27 | 46.56 | 46.23 | 45.82 | 42.63 | 43.79 | 43.37 |
S-I | 8.35 | 9.52 | 4.77 | 2.44 | 1.79 | 1.75 | 0.69 | 0.65 |
Source: World Bank national accounts data.
Table 4: Investment-Savings Gap--Japan (% of GDP).
2006 | 2008 | 2010 | 2012 | 2014 | 2016 | 2018 | 2020 | |
Savings (S) | 29.82 | 28.64 | 26.38 | 24.90 | 25.77 | 28.73 | 29.08 | 28.32 |
Investment (I) | 26.08 | 25.87 | 22.59 | 24.00 | 25.04 | 24.84 | 25.59 | 25.41 |
S-I | 3.74 | 2.77 | 3.79 | 0.89 | 0.74 | 3.89 | 3.49 | 2.91 |
Source: World Bank national accounts data.
Table 5: Investment-Savings Gap--Korea, Rep. (% of GDP).
2006 | 2008 | 2010 | 2012 | 2014 | 2016 | 2018 | 2020 | |
Savings (S) | 32.89 | 33.32 | 35.04 | 34.66 | 34.99 | 36.79 | 35.85 | 36.07 |
Investment (I) | 32.99 | 33.67 | 32.55 | 31.32 | 29.79 | 30.14 | 31.49 | 31.86 |
S-I | -0.10 | -0.34 | 2.49 | 3.35 | 5.20 | 6.64 | 4.37 | 4.21 |
Source: World Bank national accounts data.
It can be seen from table 2 that since 2007, the national savings rate of the United States has been below 20% on average, while the investment rate has been above 20% on average, forming a savings gap. On the contrary, the savings rates of the three countries in East Asia were very high, with China as the leader. In 2010, China's savings rate reached 51.33%. Although it has declined since then, it has always been higher than 40%, far exceeding the savings rates of other countries. The country with the second highest savings rate was South Korea, whose savings rate has been stable at about 35%, and has been rising in recent years. Japan's savings rate was lower than that of the other two East Asian countries, but it was also higher than 20%, reaching 29.82% in 2006 and 29.08% in 2018, approaching 30%. Corresponding to the savings rate is the investment rate of the three countries. After calculation, it is found that except for South Korea before 2008, the savings-investment gap of the three countries in other periods was positive, in sharp contrast to the United States.
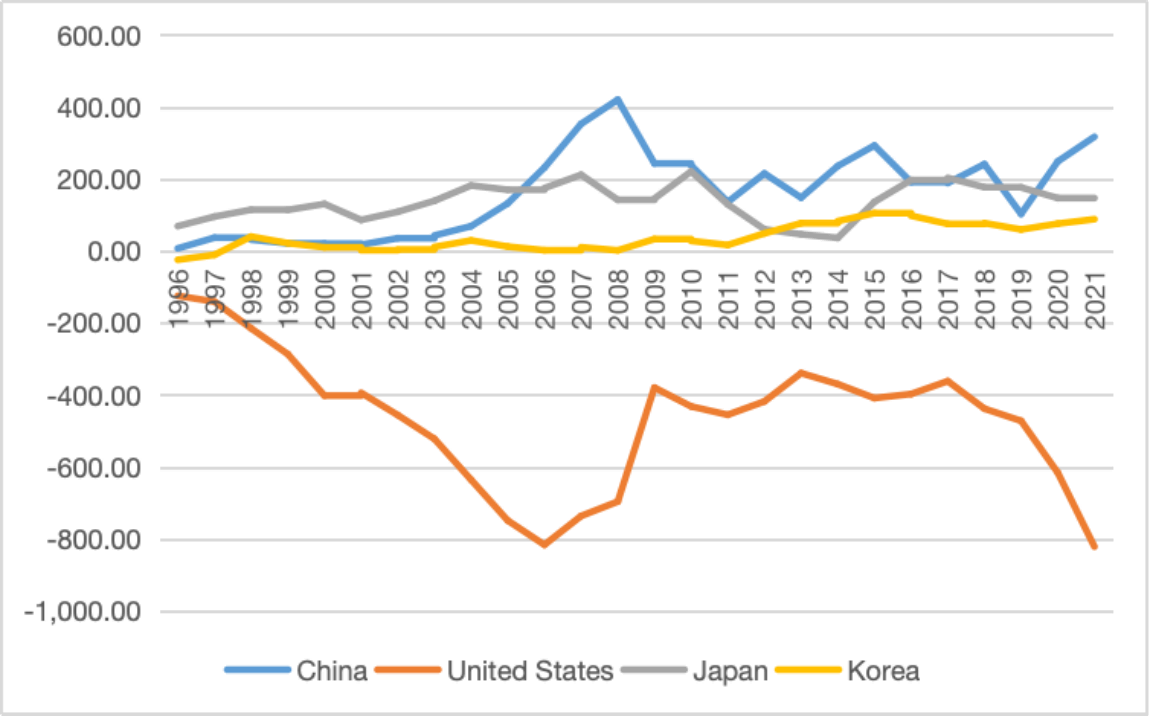
Figure 2: Current account balance (BoP, current billion US$).
Source: World Bank national accounts data.
Figure 2 shows the current account balances of the United States, China, Japan and South Korea from 1996 to 2021. According to the specific data of the current account balance of the U.S. in the World Bank, the U.S. had the worst current account deficits in 2006, 2007 and 2008, reaching -$816.64 billion, -$746.55 billion and -$696.53 billion. At the same time, the savings-investment gaps in these three years were the largest. Since 2009, the current account deficit of the United States has eased and reached its peak in 2013 and 2014 at -$339.45 billion and -$369.98 billion, respectively, while it has fallen again since 2017. This is also largely consistent with the change of the savings-investment gap in the United States. In contrast, in China, Japan and South Korea, their current account balances have been positive for a long time, which is also related to their high savings rates.
Also, we can use a modeling approach to test the relationship between the savings-investment gap and the current account imbalance. The preferred test is the Granger causality test, where the current account balance is set as the variable Y and the savings-investment gap is set as X. The time series data for each country are entered through the Eviews software to see if the original hypothesis is rejected, i.e., whether X is the Granger cause of Y.
4. Conclusion
From the perspective of global economic imbalance, this paper focuses on two important economies, and explores the reasons behind their trade imbalance. Through theoretical and empirical analysis, it is found that the difference in economic development between the United States and East Asia has led to an international division of labor and a gap in savings and investment, thus leading to the trade imbalance. In response to the current U.S.-China trade war and other issues, the research questions raised in this paper not only help us understand the real driving forces behind the imbalance and mitigate conflicts arising from trade between countries, but also provide experience and guidance for the future development of global trade.
References
[1]. Li, X., Meng, B., & Wang, Z. (2019). Recent patterns of global production and GVC participation. Global Value Chain Development Report 2019, 9–43.
[2]. OBrien, R., & Williams, M. (2016). Global Political Economy. Palgrave MacMillan.
[3]. Weber, I., & Shaikh, A. (2021). The U.S.-China trade imbalance and the theory of free trade: Debunking the currency manipulation argument. International Review of Applied Economics, 35(3-4), 432–455.
[4]. Milberg, W., & Winkler, D. (2013). What role for comparative advantage? Outsourcing Economics, 59–102.
[5]. Milberg, W. (2008). Shifting sources and uses of profits: Sustaining US financialization with global value chains. Economy and Society, 37(3), 420–451.
[6]. Quan Yi, & Fang Ying. (2011). Exploring the economic imbalance between the United States and East Asia and its causes. Journal of the Institute of International Relations, 2011(04), 75-83.
[7]. Froud, J., Johal, S., Leaver, A., & Williams, K. (2014). Financialization across the Pacific: Manufacturing cost ratios, supply chains and power. Critical Perspectives on Accounting, 25(1), 46–57.
[8]. Bui, M. T., Miura, R., Saito, M., Shibata, Y., & Suenaga, K. (2022). Fragmented Flying Geese (FFG) and Intra-Regional Agglomeration: Towards a Model Explaining Location Shifting of Japanese Multinational Corporations and the Electric Value Chains of ASEAN Economies. Economies, 10(10), 238-N.PAG.
[9]. Chiang, H. (2008). The “Flying Geese Development” model of the IT industry in East Asia. Journal of the Asia Pacific Economy, 13(2), 227–242.
[10]. Stilwell, F. (2012). Political economy: The contest of economic ideas. Oxford University Press.
[11]. Caporaso, J. A., & Levine, D. P. (1992). Theories of political economy. Cambridge University Press.
[12]. Feng Wen-ming. (2011). The U.S. policy of encouraging residents' consumption and its inspiration. Xiang Chao, 2011(05), 84-85.
[13]. Oatley, Thomas. (2019). International Political Economy. Routledge.
[14]. Palley, T. I. (2015). The theory of global imbalances: Mainstream Economics vs Structural Keynesianism. Review of Keynesian Economics, 3(1), 45-62.
[15]. Ivanova, M. N. (2019). Inequality, financialization, and the US Current Account Deficit. Industrial and Corporate Change, 28(4), 707–724.
[16]. Kalinowski, T. (2015). Second image IPE: Global economic imbalances and the ‘defects’ of the east asian development model. International Politics, 52(6), 760-778.
Cite this article
Liu,T. (2024). Economic Development Pattern and Trade Imbalance: Comparing the U.S. with East Asia. Advances in Economics, Management and Political Sciences,80,355-361.
Data availability
The datasets used and/or analyzed during the current study will be available from the authors upon reasonable request.
Disclaimer/Publisher's Note
The statements, opinions and data contained in all publications are solely those of the individual author(s) and contributor(s) and not of EWA Publishing and/or the editor(s). EWA Publishing and/or the editor(s) disclaim responsibility for any injury to people or property resulting from any ideas, methods, instructions or products referred to in the content.
About volume
Volume title: Proceedings of the 3rd International Conference on Business and Policy Studies
© 2024 by the author(s). Licensee EWA Publishing, Oxford, UK. This article is an open access article distributed under the terms and
conditions of the Creative Commons Attribution (CC BY) license. Authors who
publish this series agree to the following terms:
1. Authors retain copyright and grant the series right of first publication with the work simultaneously licensed under a Creative Commons
Attribution License that allows others to share the work with an acknowledgment of the work's authorship and initial publication in this
series.
2. Authors are able to enter into separate, additional contractual arrangements for the non-exclusive distribution of the series's published
version of the work (e.g., post it to an institutional repository or publish it in a book), with an acknowledgment of its initial
publication in this series.
3. Authors are permitted and encouraged to post their work online (e.g., in institutional repositories or on their website) prior to and
during the submission process, as it can lead to productive exchanges, as well as earlier and greater citation of published work (See
Open access policy for details).
References
[1]. Li, X., Meng, B., & Wang, Z. (2019). Recent patterns of global production and GVC participation. Global Value Chain Development Report 2019, 9–43.
[2]. OBrien, R., & Williams, M. (2016). Global Political Economy. Palgrave MacMillan.
[3]. Weber, I., & Shaikh, A. (2021). The U.S.-China trade imbalance and the theory of free trade: Debunking the currency manipulation argument. International Review of Applied Economics, 35(3-4), 432–455.
[4]. Milberg, W., & Winkler, D. (2013). What role for comparative advantage? Outsourcing Economics, 59–102.
[5]. Milberg, W. (2008). Shifting sources and uses of profits: Sustaining US financialization with global value chains. Economy and Society, 37(3), 420–451.
[6]. Quan Yi, & Fang Ying. (2011). Exploring the economic imbalance between the United States and East Asia and its causes. Journal of the Institute of International Relations, 2011(04), 75-83.
[7]. Froud, J., Johal, S., Leaver, A., & Williams, K. (2014). Financialization across the Pacific: Manufacturing cost ratios, supply chains and power. Critical Perspectives on Accounting, 25(1), 46–57.
[8]. Bui, M. T., Miura, R., Saito, M., Shibata, Y., & Suenaga, K. (2022). Fragmented Flying Geese (FFG) and Intra-Regional Agglomeration: Towards a Model Explaining Location Shifting of Japanese Multinational Corporations and the Electric Value Chains of ASEAN Economies. Economies, 10(10), 238-N.PAG.
[9]. Chiang, H. (2008). The “Flying Geese Development” model of the IT industry in East Asia. Journal of the Asia Pacific Economy, 13(2), 227–242.
[10]. Stilwell, F. (2012). Political economy: The contest of economic ideas. Oxford University Press.
[11]. Caporaso, J. A., & Levine, D. P. (1992). Theories of political economy. Cambridge University Press.
[12]. Feng Wen-ming. (2011). The U.S. policy of encouraging residents' consumption and its inspiration. Xiang Chao, 2011(05), 84-85.
[13]. Oatley, Thomas. (2019). International Political Economy. Routledge.
[14]. Palley, T. I. (2015). The theory of global imbalances: Mainstream Economics vs Structural Keynesianism. Review of Keynesian Economics, 3(1), 45-62.
[15]. Ivanova, M. N. (2019). Inequality, financialization, and the US Current Account Deficit. Industrial and Corporate Change, 28(4), 707–724.
[16]. Kalinowski, T. (2015). Second image IPE: Global economic imbalances and the ‘defects’ of the east asian development model. International Politics, 52(6), 760-778.