


1. Introduction
Over the years, the global plastic market has gradually increased in size. According to a research report by Grand View Research, it reached 593 billion US dollars in 2021 and is projected to exceed 750 billion US dollars by 2027 [1]. With the continuous development of the Chinese economy, the demand for plastics in packaging, medical, and product components has gradually expanded, which has driven the rapid increase in plastic production. In the twelve years from 2010 to 2021, the output increased from 58.31 million tons to 80.04 million tons. In 2021, the scale of China's plastic products market has reached 1.6156 trillion yuan [2]. According to data from the National Bureau of Statistics of China, in 2022, the revenue from rubber and plastic products accounted for 2.16% of the total industrial income in China, making it one of the key industries [2]. Due to its importance, the price fluctuations in the plastic market of China have attracted increasing attention. Among them, polypropylene, as a widely used plastic material, has a significant impact on various industries. It is crucial for manufacturers and market participants to have a deep understanding of the changes in polypropylene prices and their influencing factors. Therefore, research on the price of polypropylene is of great economic and practical significance.
Previous studies have mainly focused on the properties of polypropylene, while research on polypropylene price is relatively scarce, and there is almost no research on the price of polypropylene in China. A. L. Roes, E. Marsili, E. Nieuwlaar and M. K. Patel ) studied the environmental benefits and cost benefits of Polypropylene Nanocomposite compared to traditional materials [3]. Janusz Grebowicz, S.-F. Lau, and Bernhard Wunderlich focused on the thermal properties of polypropylene[4]. There are also some books that provide introductions to polypropylene itself, such as The Handbook of Polypropylene and Polypropylene Composites edited by Harutun Karian [5], and Polypropylene: The Definitive User's Guide and Databook written by Clive Maier and Theresa Calafu [6]. Lurion M. De Mello and Ronald D. Ripple analyzed the polypropylene price dynamics by studying input costs and downstream demand. However, their research mainly focuses on the market dynamics of South East Asian and North Western European regions [7]. Based on this situation, this article analyzes in detail the correlation between various influencing factors and the price fluctuations of polypropylene in China, and establishes an effective price forecasting model to fill the academic gap.
Factors such as raw material prices, supply and demand relationships, geopolitical risks, and currency exchange rate fluctuations may directly or indirectly affect the price of polypropylene. Geopolitical risks and currency exchange rate fluctuations will have reactions through raw material prices and downstream products. Therefore, this article analyzes the factors related to the price of polypropylene into two categories: upstream raw material prices and downstream product markets.
In terms of raw material prices, polypropylene is a polymer formed by the polymerization reaction of propylene [8]. Propylene is mainly obtained in four ways. The first is the dehydrogenation of propane to produce propylene, where propane is mainly a by-product of natural gas and crude oil processing. The second is the catalytic cracking of naphtha to produce propylene, where naphtha is a mixture of hydrocarbons extracted from crude oil. The third is the separation of propylene through catalytic and cracking processes in oil refineries, where propylene is included in the by-products of catalytic and cracking processes in oil refineries. The fourth is the production of propylene from methanol, where the main raw material for methanol synthesis is natural gas, accounting for more than 80% of methanol production. From the above, it can be seen that the production of propylene is closely related to crude oil and natural gas, and propylene is the direct raw material for polypropylene. Therefore, this article selects the futures prices of crude oil and natural gas in China as the upstream raw material price factors for polypropylene price analysis. In addition, although propylene can also be produced through coal liquefaction and cracking, this production method has poor economic benefits and is not a major production method, so it is directly ignored. According to estimates, raw material prices will be positively correlated with the price of polypropylene, and changes in raw material prices will directly transmit to the price of polypropylene.
In terms of the downstream product market, due to the wide range of applications of polypropylene, this article selects four most representative aspects that have the strongest correlation with polypropylene prices, including packaging, textiles, medical devices, and household appliances. Since we can’t find the specific price of them. As large sectors, there is just no unified price data available. So we turn to the Stock index to represent these market conditions. Although stock prices do not have a direct connection with product market prices, stock indices are considered to reflect the situation of the target market to some extent, which may have connection with the price of polypropylene in China. And according to the research, they do have a high correlation
2. Data
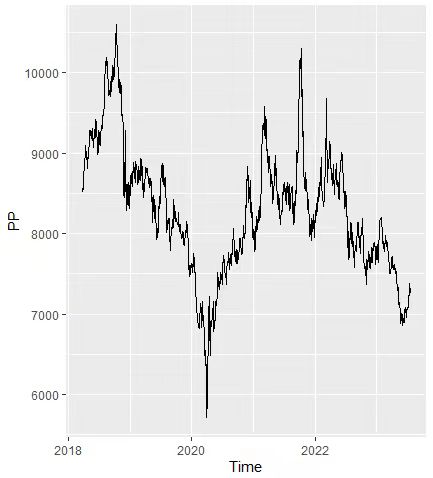
Figure 1: The price flow diagram of Polypropylene
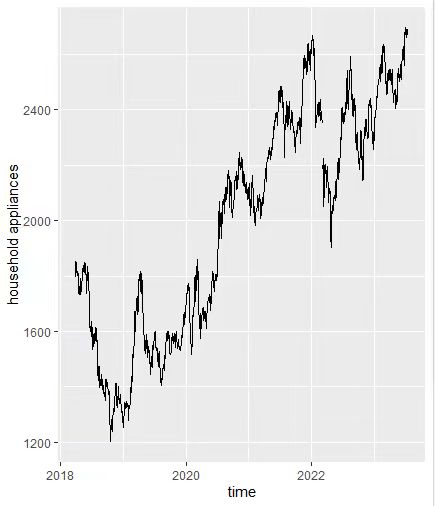
Figure 2: The price flow diagram of household appliance
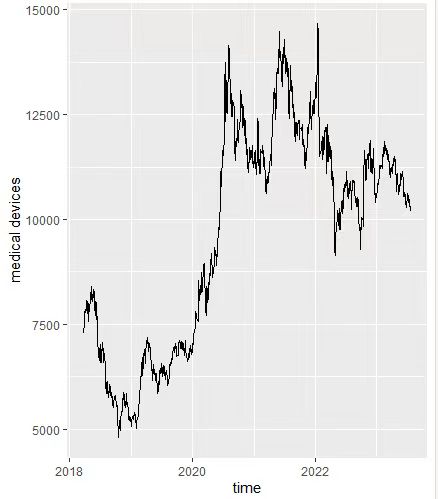
Figure 3: The price flow diagram of medical devices
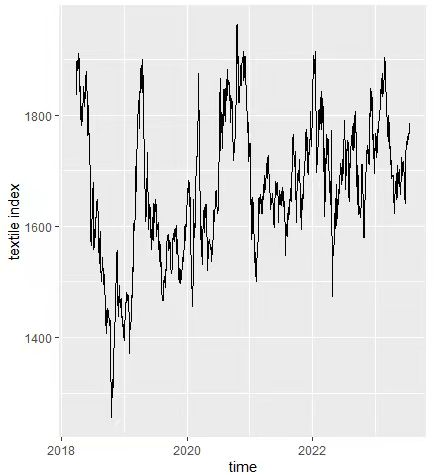
Figure 4: The price index of textile
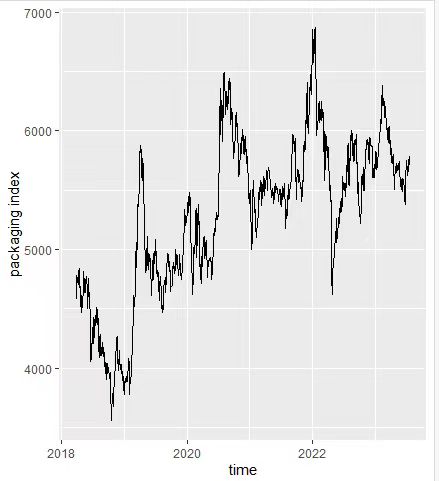
Figure 5: The price index of packaging
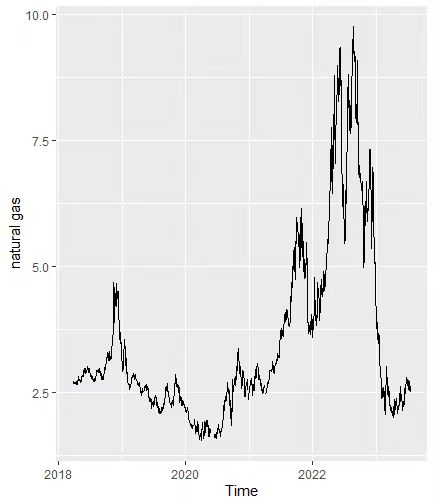
Figure 6: The price flow diagram of natural gas
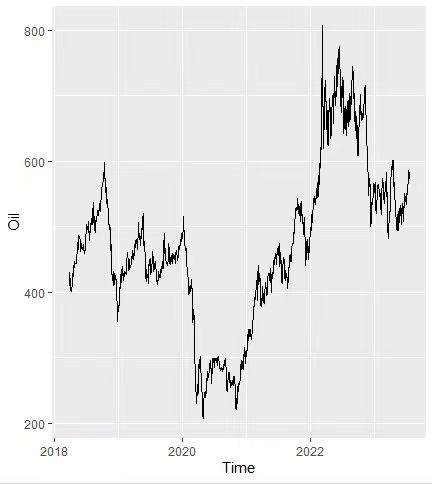
Figure 7: The price flow diagram of crude oil
Figure 1 represents the trend of polypropylene futures prices from 3/26/2018 to 7/19/2023.
Figure 2 represents the trend of the stock index for household appliances from 3/26/2018 to 7/19/2023
Figure 3 represents the trend of the stock index for medical devices from 3/26/2018 to 7/19/2023.
Figure 4 represents the trend of the stock index for textiles from 3/26/2018 to 7/19/2023.
Figure 5 represents the trend of the stock index for packaging from 3/26/2018 to 7/19/2023.
Figure 6 represents the trend of natural gas futures prices from 3/26/2018 to 7/19/2023.
Figure 7 represents the trend of crude oil futures prices from 3/26/2018 to 7/19/2023.
The target data was set as the futures price of polypropylene in China, which was directly obtained from the professional futures stock software "Tonghuashun". The independent variables were divided into two parts: upstream raw material prices and downstream product markets. For the upstream raw material prices, we also directly used the futures price data of crude oil and natural gas from "Tonghuashun". As for the downstream product market, as mentioned earlier, there is no direct futures price data available. Initially, Chinese market size data was considered, but collecting such data proved to be difficult and resulted in significant data gaps, so it was abandoned. Later, scraping average price changes from Taobao.com was proposed as an alternative method, but it was ultimately deemed unable to fully reflect the downstream product market and was also abandoned. Finally, stock indices were selected as the data for analysis. Stock indices are comprehensive and reflect market prices indirectly while considering other market factors, which meets the requirements of the research.
We conducted a detailed study of the downstream market of polypropylene, and major applications with a large proportion of downstream consumption are focused on drawing, low melt co-polymerization, and homopolymer injection molding, accounting for 32%, 12%, and 9%, respectively, with a total of 53%, which is more than half. Corresponding to these applications, the four most representative aspects with the strongest correlation to polypropylene prices, including packaging, textiles, medical devices, and household appliances, were selected as independent variables for the study.
To ensure consistency and correspondence of the data, all variables were analyzed using daily time series data from 3.26.2018 to 7.19.2023. Any days with missing data were excluded.
Due to the anticipated significant impact of the COVID-19 pandemic and the Russo-Ukrainian war on the data, as originally planned, both upstream and downstream data will be divided into three parts for analysis: pre-COVID-19 pandemic, during the COVID-19 pandemic, and during the Russo-Ukrainian war. However, after preliminary practice and experimentation, it was found that the data during the Russo-Ukrainian war period was complex and volatile due to overlapping with the pandemic period. The existing models were unable to handle it effectively. Therefore, the data during the Russo-Ukrainian war period was discarded, and the focus was placed on the analysis of pre-pandemic and pandemic data.
Finally, the pre-pandemic data was determined to cover the period from March 26, 2018, to December 31, 2019, while the data during the pandemic was set from January 2, 2020, to December 31, 2021. Although the exact start date of the pandemic was December 19, 2019, it takes time for the market to react to unforeseen events. Therefore, the start date of the pandemic data is still set as January 2, 2020.
2.1. Hypothesis Testing
Here, we would like to construct the hypothesis test to view whether these factors affect the performance of the model. We will construct the null hypothesis H₀:βᵢ=0 for all i vs. the alternative hypothesis Hₐ:βᵢ ≠ 0. We will set a 95% confidence interval, which means we will tend to reject the null hypothesis if the test statistic is larger than critical value F(1-a,12,987)= F(1-0.05,12,987)=1.761974 and fail to reject the null hypothesis otherwise.
For the upstream, we will construct the null hypothesis H₀ that β_{oil} = β_{natural gas} = 0 and alternative hypothesis Hₐ that βᵢ ≠ 0. At the 95% confidence interval, we will reject the null hypothesis and conclude that those factors are not insignificant at the same time here. Since both of the coefficients have a t-value bigger than 2, prove that both coefficients are significant.
For the downstream, we will construct the null hypothesis H₀ that β_{textile} = β_{packaging} = β_{medical devices} = β_{household appliances} = 0 and alternative hypothesis Hₐ that βᵢ ≠ 0. At the 95% confidence interval, we will reject the null hypothesis and conclude that those factors are not insignificant at the same time here. Since all of the coefficients have a t-value bigger than 1, prove that both coefficients are significant.
For the final model, the covid data is not included in the model. The null hypothesis H₀ that β_{textile} = β_{packaging} = β_{medical devices} = β_{household appliances} = β_{oil} = β_{natural gas} = 0 and alternative hypothesis Hₐ that βᵢ ≠ 0. At the 95% confidence interval, we will reject the null hypothesis and conclude that those factors are not insignificant at the same time here. Since β_{household appliances} and β_{natural gas} have a t-value smaller than 1, this proves that both coefficients are not significant. So the final model = β_{intercept}+β_{oil}*oil+β_{textile}*textile+β_{packaging}*packaging +β_{medical devices}*medical devices.
2.2. Analyze
Table 1: The linear regression model of upstream without the COVID data
estimate | t-value | p-value | stars | significant | |
Oil | 10.88 | 19.812 | 2.2^-16 | *** | ✓ |
Natural Gas | 525.57 | 12.476 | 2.2^-16 | *** | ✓ |
Table 2: The linear regression model of upstream with the COVID data
estimate | t-value | p-value | stars | significant | |
Oil | 1.1616 | 2.76 | 0.00626 | ** | ✓ |
Natural gas | 1007.43 | 17.26 | 2.2^-16 | *** | ✓ |
Table 1 represents the regression analysis of crude oil and natural gas futures prices with the target variable, polypropylene futures prices, before the outbreak of the pandemic.
Table 2 represents the regression analysis of crude oil and natural gas futures prices with the target variable, polypropylene futures prices, during the pandemic period.
According to Table 1 and Table 2, both their p-values are less than 2.2e^-16. This indicates that there is a correlation between the futures prices of crude oil and natural gas and the target variable, polypropylene futures prices, and it has analytical significance.
Whether it is before or after the pandemic, the estimated values for crude oil and natural gas are positive, indicating a positive correlation between the futures prices of crude oil and natural gas and polypropylene futures prices. Changes in crude oil and natural gas futures prices will cause corresponding changes in polypropylene futures prices. This confirms the previous conjecture.
The absolute value of the t-value represents the degree of correlation between the independent variable and the target variable. The larger the absolute value of the t-value, the higher the correlation. The star on the far right has the same function. Three stars indicate a very high correlation, two stars indicate a moderate correlation, and one star indicates a partial correlation. Comparing the t-value and the number of stars before and after the pandemic, it can be observed that the correlation between crude oil futures prices and polypropylene futures prices decreased significantly during the pandemic. This was studied in accordance with the Argus White Paper: The impact of coronavirus on polypropylene, which states that "Operating rates at steam crackers and other polypropylene producing units were reduced by approximately a quarter in China at the height of the lockdown, as demand fell." [9]. Due to the significant decline in demand, many polypropylene production facilities, especially refineries, were closed. Additionally, China is one of the world's largest crude oil importers, accounting for approximately 50% of the imports. According to data from the Chinese National Bureau of Statistics, China's crude oil imports in 2021 were 513 million metric tons, significantly lower than the 542 million metric tons in 2020 [10]. This indicates that strict transportation restrictions during the COVID-19 pandemic affected crude oil imports. Therefore, during the pandemic, both the raw materials and channels for producing polypropylene from crude oil were severely affected, leading to the closure of some production units. It is speculated that these factors are the main reasons for the significant decrease in correlation between crude oil futures prices and polypropylene futures prices during the pandemic.
Table 3: The linear regression model of downstream without the COVID data
estimate | t-value | p-value | stars | significant | |
packaging | -1.056 | -20.57 | 2.2^-16 | *** | ✓ |
textile | 1.732 | 3.37 | 0.000819 | *** | ✓ |
Medical device | -0.7033 | -7.21 | 2.56^-12 | *** | ✓ |
Household appliance | 4.447 | 5.21 | 2.95^-7 | *** | ✓ |
Table 4: The linear regression model of downstream with the covid data
estimate | t-value | p-value | stars | significant | |
packaging | 0.05205 | 0.577 | 0.564791 | 0 | X |
textile | -1.33579 | -3.524 | 0.000509 | *** | ✓ |
Medical device | -0.0993 | -5.533 | 8.25^-8 | *** | ✓ |
Household appliance | 3.9704 | 14.319 | 2.2^-16 | *** | ✓ |
Table 3 represents the regression analysis of the stock indices for packaging, textiles, medical devices, and household appliances with the target variable, polypropylene futures prices, before the outbreak of the pandemic.
Table 4 represents the regression analysis of the stock indices for packaging, textiles, medical devices, and household appliances with the target variable, polypropylene futures prices, during the pandemic period.
According to Table 3 and Table 4, both their p-values are less than 2.2e^-16. This indicates that there is a correlation between the stock indices of packaging, textiles, medical devices, and household appliances and the target variable, PP futures prices.
Observing the star ratings of the variables' correlations with the target variable before and after the pandemic, it can be found that the packaging stock index had three stars before the pandemic, indicating a high correlation with polypropylene futures prices. However, during the pandemic, the packaging stock index had no star rating for correlation, indicating almost no correlation with PP futures prices. To investigate this, it was found that due to the lockdown measures during the pandemic, there was a surge in demand for plastic packaging, leading to unusual fluctuations in the packaging stock index. These fluctuations were caused by special circumstances rather than the usual supply and demand factors. Therefore, the data during the pandemic period is almost irrelevant to polypropylene futures prices.
3. Model
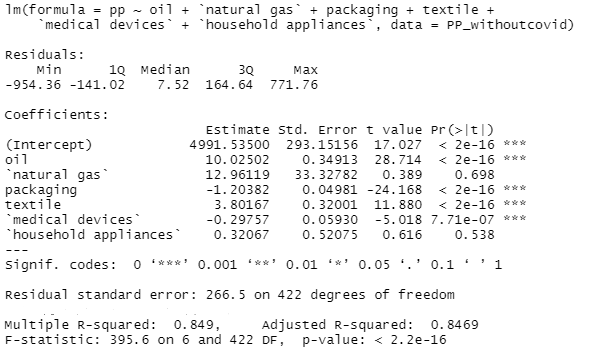
Figure 8: The linear regression model of all variables without the covid data
Figure 8 shows the preliminary experimental regression model built using all available data.
After the research and exploration above, it was found that the COVID-19 pandemic has a significant impact on the prices of upstream raw materials for polypropylene futures and the downstream market. Since the impact of the pandemic is expected to gradually fade away in the long term, the goal of this study is to establish a universal model. Therefore, only the data before the occurrence of the COVID-19 pandemic, specifically from March 26, 2018, to December 31, 2019, will be used for modeling.
By observing Figure 8, it can be seen that the variables "natural gas" and "household appliances" do not have asterisks on the right side, indicating a low correlation with the target variable, which is the polypropylene futures price. This may be because although they have some correlation with the target variable when considering the overall analysis, the influence of other independent variables on the target variable is larger, thus diluting the impact of natural gas and household appliances on the target variable. Overall, the futures price of natural gas and the stock index of household appliances have a small effect on the polypropylene futures price. Therefore, in order to make the final regression model more accurate, the relevant data on natural gas and household appliances have been removed from the modeling data.
To ensure the accuracy of the established model and enable model validation, 70% of the data is used for model building, and the remaining 30% is used for accuracy testing.
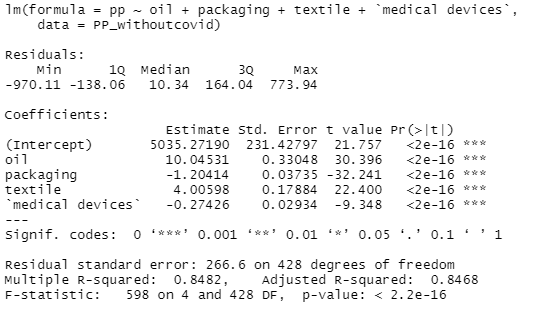
Figure 9: The final linear regression model
Figure 9 represents the final model obtained.
According to Figure 9, the p-value of the model is less than 2.2e^-16, indicating that the model is meaningful. Furthermore, after the previous screening, the correlation between each independent variable used for modeling and the target variable has reached three stars, indicating a high correlation.
The R-squared value represents the proportion of training data that can be explained by the final regression model. From the graph, it can be seen that the R-squared value of this model is around 0.85, indicating that the majority of the data used for the first 70% fits the model well. This implies the reliability of this model from one aspect.
The final obtained model is the estimate multiplied by the corresponding variable's data, and summed together, which can be expressed as: 9.91469 * crude oil futures prices + (-1.22343) * packaging stock index + 3.96203 * textile stock index + (-0.26201) * medical devices stock index.
3.1. Test
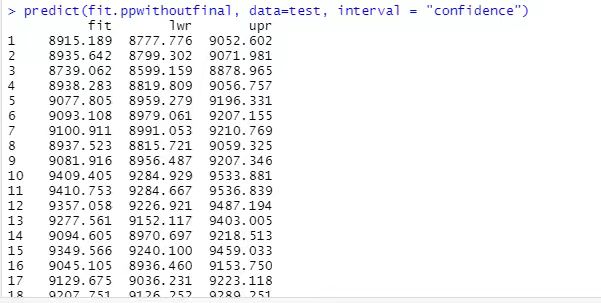
Figure 10: The results obtained after feeding the test data into the model
To further confirm the accuracy of this regression model, the remaining 30% of the data is used to test the model.
We input the independent variables from the last 30% of the data into this model and obtain partially predicted results for the target variable, as shown in Figure 10. "Fit" indicates the predicted or estimated values of the response variable based on the model. It represents the prediction results of the regression model for the input variables of the test set. "Lwr" represents the lower bound of the predicted results. It is used to indicate the lowest possible value of the predicted values of the response variable based on the model within a given confidence interval. "Upr" represents the upper bound of the predicted results. It is used to indicate the highest possible value of the predicted values of the response variable based on the model within a given confidence interval.
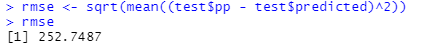
Figure 11: The RMSE of the predicted model
Then, we compare the predicted results given by the model with the actual real results, which are the actual polypropylene futures prices, and calculate the root mean square error (RMSE) as shown in Figure 11. The RMSE value is 252. Considering the difficulty in predicting future prices, this error value is considered acceptable.
3.2. Residual vs Fitted
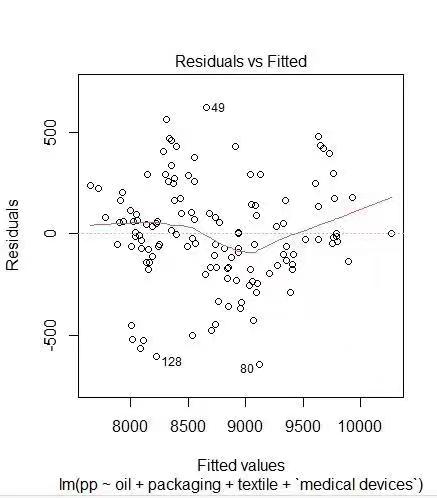
Figure 12: residual vs. fitted graph
From the residual vs. fitted plot (Figure 12) above, it can be seen that the data points do not deviate more from the estimated values of the model as the polypropylene prices increase. This indicates that the data is relatively close to homoscedasticity. Similarly, because the distribution of the majority of variances is uniform, it can be inferred that the model is linear. Additionally, there are no particularly concerning outliers in this case, so there is no need for any special treatment of the dataset.
3.3. K-fold
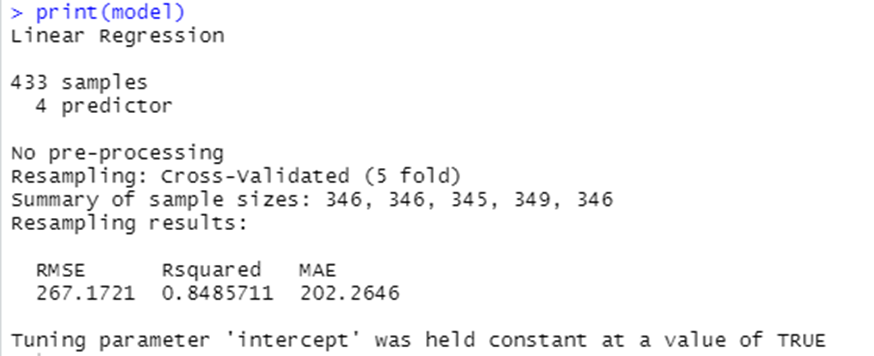
Figure 13: K-fold cross-validation
K-fold cross-validation is also used as a method to test whether a model meets the requirements. In the process of using machine learning to construct training and testing sets, the testing set is a separate set of data that is completely independent of the training process and the final evaluation of the model. However, this can lead to some issues, such as significant differences between the testing set and the model data. K-fold cross-validation attempts to avoid these potential problems. The essence of K-fold is to fold the dataset K times, allowing for the full utilization of the entire dataset. In this case, K-fold is set to 5 times, with each iteration using 20% of the data as the testing set. As shown in Figure 13, the obtained R-squared values are very close to our final model, which are 84.85 and 84.82, respectively. The resulting RMSE values are also close to the final model, being 267 and 266, respectively. This also indicates that the final model is highly stable.
4. Conclusion
Based on the research, analysis, and modeling conducted, several results can be obtained.
Firstly, the futures prices of the raw materials are positively correlated with PP futures prices.
Secondly, during the COVID-19 pandemic, the impact of crude oil futures prices on polypropylene futures prices is relatively reduced.
Thirdly, during the COVID-19 pandemic, the packaging stock index is no longer valuable for analyzing polypropylene futures prices.
What’s more, overall, during normal periods, the upstream raw material - crude oil, and downstream product markets, such as packaging, medical devices, and household appliances, have a significant influence on polypropylene futures prices.
Finally, the specific formula derived from the model is 9.91469 * crude oil futures prices + (-1.22343) * packaging stock index + 3.96203 * textile stock index + (-0.26201) * medical devices stock index.
Due to insufficient capability, we were unable to study the impact of various variables on polypropylene futures prices during the Russo-Ukrainian war period. Furthermore, although the existing predictive model is acceptable, it is not entirely accurate, and there is still room for improvement.
References
[1]. Grand View research group. (2023). Plastic market size, share & growth [2023 global report]. Plastic Market Size, Share & Growth [2023 Global Report]. https://www.grandviewresearch.com/industry-analysis/global-plastics-market
[2]. National Bureau of Statistics of China. (2023, January 31). National Bureau of Statistics. http://www.stats.gov.cn/xxgk/sjfb/zxfb2020/202301/t20230131_1892601.html?eqid=e0b679fc0000788c000000056427e445
[3]. A. L. Roes, E. Marsili, E. Nieuwlaar, M. K. Patel (2007) Environmental and Cost Assessment of a Polypropylene Nanocomposite. Journal of Polymers and the Environment,15:212–226
[4]. Janusz Grebowicz, S.-F. Lau, Bernhard Wunderlich (1984) The thermal properties of polypropylene. Journal of Polymer Science: Polymer Symposia, 71, Issue 1: 19-37
[5]. H Karian (2003) Handbook of Polypropylene and Polypropylene Composites. CRC Press, New York
[6]. C Maier, T Calafu (1998) Polypropylene: The Definitive User's Guide and Databook. Plastic Design Library, Norwich, NY
[7]. LM. De Mello, RD. Ripple (2017) Polypropylene Price Dynamics: Input Costs or Downstream Demand? The Energy Journal, 38, Number 4
[8]. Kyle Lorton Marketing Manager, Polypropylene Catalysts Davison Catalysts. Davison 8500 Series Polypropylene Catalysts for Superior Resins.
[9]. Argusmedia. “Argus White Paper: The Impact of Coronavirus on Propylene - Argus Media.” Argusmedia.Com, www.argusmedia.com/-/media/Files/white-papers/argus-wp-the-impact-of-coronavirus-on-propylene.ashx. Accessed 28 July 2023.
[10]. National Bureau of Statistics of China. (2022, January 17). http://www.stats.gov.cn/sj/zxfb/202302/t20230203_1901338.html
Cite this article
Ying,Z.;Lu,Y. (2024). The Price Trend of Polypropylene. Advances in Economics, Management and Political Sciences,82,37-49.
Data availability
The datasets used and/or analyzed during the current study will be available from the authors upon reasonable request.
Disclaimer/Publisher's Note
The statements, opinions and data contained in all publications are solely those of the individual author(s) and contributor(s) and not of EWA Publishing and/or the editor(s). EWA Publishing and/or the editor(s) disclaim responsibility for any injury to people or property resulting from any ideas, methods, instructions or products referred to in the content.
About volume
Volume title: Proceedings of the 2nd International Conference on Financial Technology and Business Analysis
© 2024 by the author(s). Licensee EWA Publishing, Oxford, UK. This article is an open access article distributed under the terms and
conditions of the Creative Commons Attribution (CC BY) license. Authors who
publish this series agree to the following terms:
1. Authors retain copyright and grant the series right of first publication with the work simultaneously licensed under a Creative Commons
Attribution License that allows others to share the work with an acknowledgment of the work's authorship and initial publication in this
series.
2. Authors are able to enter into separate, additional contractual arrangements for the non-exclusive distribution of the series's published
version of the work (e.g., post it to an institutional repository or publish it in a book), with an acknowledgment of its initial
publication in this series.
3. Authors are permitted and encouraged to post their work online (e.g., in institutional repositories or on their website) prior to and
during the submission process, as it can lead to productive exchanges, as well as earlier and greater citation of published work (See
Open access policy for details).
References
[1]. Grand View research group. (2023). Plastic market size, share & growth [2023 global report]. Plastic Market Size, Share & Growth [2023 Global Report]. https://www.grandviewresearch.com/industry-analysis/global-plastics-market
[2]. National Bureau of Statistics of China. (2023, January 31). National Bureau of Statistics. http://www.stats.gov.cn/xxgk/sjfb/zxfb2020/202301/t20230131_1892601.html?eqid=e0b679fc0000788c000000056427e445
[3]. A. L. Roes, E. Marsili, E. Nieuwlaar, M. K. Patel (2007) Environmental and Cost Assessment of a Polypropylene Nanocomposite. Journal of Polymers and the Environment,15:212–226
[4]. Janusz Grebowicz, S.-F. Lau, Bernhard Wunderlich (1984) The thermal properties of polypropylene. Journal of Polymer Science: Polymer Symposia, 71, Issue 1: 19-37
[5]. H Karian (2003) Handbook of Polypropylene and Polypropylene Composites. CRC Press, New York
[6]. C Maier, T Calafu (1998) Polypropylene: The Definitive User's Guide and Databook. Plastic Design Library, Norwich, NY
[7]. LM. De Mello, RD. Ripple (2017) Polypropylene Price Dynamics: Input Costs or Downstream Demand? The Energy Journal, 38, Number 4
[8]. Kyle Lorton Marketing Manager, Polypropylene Catalysts Davison Catalysts. Davison 8500 Series Polypropylene Catalysts for Superior Resins.
[9]. Argusmedia. “Argus White Paper: The Impact of Coronavirus on Propylene - Argus Media.” Argusmedia.Com, www.argusmedia.com/-/media/Files/white-papers/argus-wp-the-impact-of-coronavirus-on-propylene.ashx. Accessed 28 July 2023.
[10]. National Bureau of Statistics of China. (2022, January 17). http://www.stats.gov.cn/sj/zxfb/202302/t20230203_1901338.html