1. Introduction
One of the most well-known and historic stock market indices in the world, the Dow Jones Industrial Average (DJIA), provides important information on investor behavior and the status of the US economy. It is a vital instrument for financial market analysis. The DJIA is a price-weighted index, which means that individual stock prices, as opposed to the index's overall market capitalization, determine its value, in contrast to market capitalization-weighted indexes.
The values of thirty blue-chip stocks are totaled and divided by the Dow divisor, which is modified to take mergers, stock splits, and other business events into consideration when calculating the DJIA [1]. The study article delves deeply into the intricate dynamics of the DJIA, specifically focusing on the examination and forecasting of seasonal patterns seen in long-term series data. In order to foresee market trends and make well-informed financial decisions, economists, investors, and policymakers must comprehend these seasonal changes in the long-term series data.
The 30 blue-chip stocks in the Dow Jones Industrial Average come from a variety of industries, including manufacturing, technology, finance, health care and more. Each individual stock is representative of its respective industry and plays an important role in it. The committee that determines the Dow's constituents considers factors such as a company's standing, continued growth, investor appeal and industry representation. Through this selection process, the Committee ensures that the Dow Jones Industrial Average accurately reflects U.S. economic conditions and market trends in a dynamic financial market environment. Table 1 shows the components of the Dow Jones Index.
Table 1: The co3nstituent blue chip stocks of the Dow Jones Industrial Average
Company | Symbol | Exchange | Industry | Year Added | Index Weight (2020/4/30) |
3M | MMM | NYSE | Conglomerate | 1976 | 4.35% |
American Express | AXP | NYSE | Financial Services | 1982 | 2.68% |
Pfizer | AMGN | NYSE | Biopharmaceutical | 2004 | 1.06% |
Apple | APPL | NASDAQ | IT | 2015 | 8.01% |
Boeing | BA | NYSE | Aerospace | 1987 | 3.87% |
Caterpillar | CAT | NYSE | Construction, Mining | 1991 | 3.34% |
Chevron | CVX | NYSE | Petroleum | 2008 | 2.63% |
Cisco | CSCO | NASDAQ | IT | 2009 | 1.21% |
Coca-Cola | KO | NYSE | Soft Drink | 1987 | 1.31% |
Disney | DIS | NYSE | Broadcasting, Entertainment | 1991 | 3.12% |
Dow | DOW | NYSE | Chemical | 2019 | 1.04% |
Goldman Sachs | GS | NYSE | Financial Services | 2013 | 5.29% |
Home Depot | HD | NYSE | Home Improvement | 1999 | 6.17% |
Exxon Mobil | XOM | NYSE | Petroleum | 1928 | 1.32% |
IBM | IBM | NYSE | IT | 1979 | 3.58% |
Intel | INTC | NASDAQ | Semiconductor | 1999 | 1.72% |
Johnson & Johnson | JNJ | NYSE | Pharmaceutical | 1997 | 4.18% |
JPMorgan Chase | JPM | NYSE | Financial Services | 1991 | 2.72% |
McDonald’s | MCD | NYSE | Food | 1985 | 5.23% |
Merck | MRK | NYSE | Pharmaceutical | 1979 | 2.25% |
Microsoft | MSFT | NASDAQ | IT | 1999 | 4.94% |
Nike | NKE | NYSE | Apparel | 2013 | 2.45% |
Procter & Gamble | PG | NYSE | Fast-moving, consumer | 1932 | 3.26% |
Raytheon | RTX | NYSE | Aerospace, Defense | 1939 | 1.89% |
Travelers | TRV | NYSE | Insurance | 2009 | 2.95% |
UnitedHealth | UNH | NYSE | Healthcare | 2012 | 8.01% |
Verizon | VZ | NYSE | Telecom | 2004 | 1.62% |
Visa | V | NYSE | Financial Services | 2013 | 5.06% |
Walgreens Boots Alliance | WBA | NASDAQ | Retail | 2018 | 1.26% |
Walmart | WMT | NYSE | Retail | 1997 | 3.44% |
This article will begin by explaining the calculation methodology of the Dow Jones Index and the importance of the 30 blue-chip stocks in the financial industry. It will then delve into utilizing a time series data model to analyze cyclicality, seasonality, and make predictions about future market trends. Additionally, the article will explore the relationship between yield and the index's impact on the market, followed by optimizing investment portfolios and quantifying trading strategies. Finally, the paper will provide a comprehensive summary of the findings and offer conclusive analysis.
2. Analysis of Empirical Results
2.1. Prediction of Future Index
Through utilizing auto plot and datasets obtained from Yahoo Finance (https://finance.yahoo.com/), a graphical representation of the Dow Jones Index can be generated in Figure 1. In order to forecast values, the adjusted closing prices are taken into consideration, incorporating factors such as dividends, stock splits, and new share offerings to determine the precise value. This approach utilizes the closing price as a reference point while accounting for these additional factors.
When choosing the time series, keep in mind that when the Dow Jones Industrial Index was first formed, there were just 12 stocks included. Consequently, the study series was selected to span a time period that reflected the index's steady maturity, using data from the previous 40 years for examination.
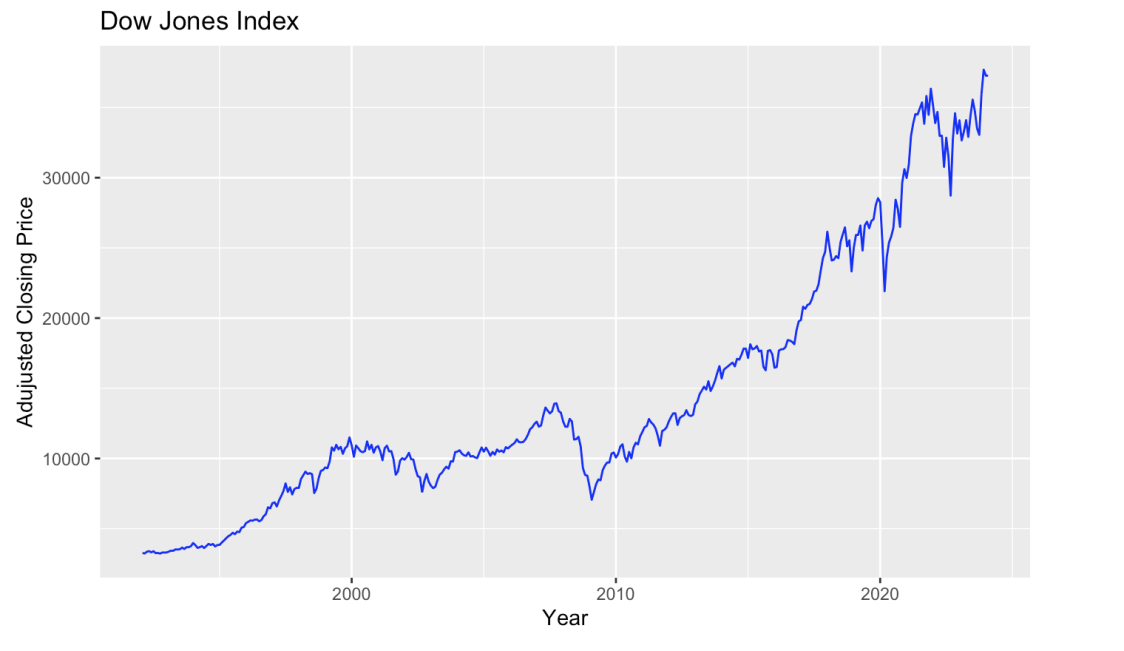
Figure 1: Dow Jones Industrial Average Index during 1993-2023
The dynamics of the stock market mirror those of real economic activities, and it is possible for the fluctuations in the stock index to exhibit cyclical and seasonal patterns, indicative of the presence of an economic cycle [3]. Consequently, the rise and fall of the stock index often demonstrate distinct cyclical and seasonal characteristics.
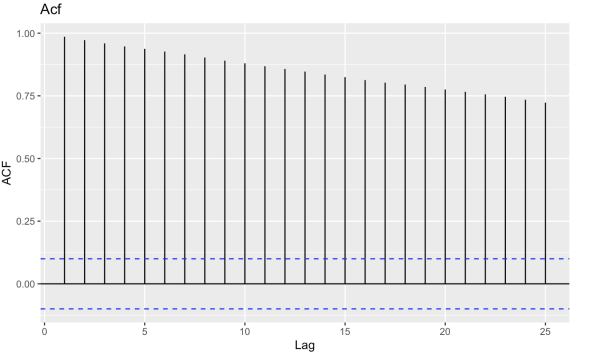
Figure 2: ACF trend prediction
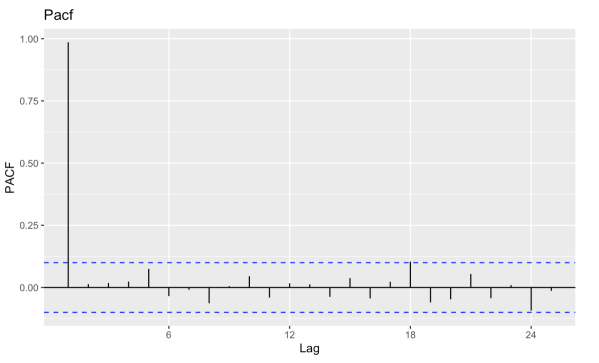
Figure 3: PACF seasonal cyclical prediction
From the Figures 2 and 3, Autocorrelation Function (ACF) and Partial Autocorrelation Function (PACF) graphs can be generated to show that the trend pattern becomes evident, although the presence of seasonality is not clearly discernible. Regarding the Dow Jones Industrial Index, it exhibits a relatively stable trend due to the stability of blue-chip stocks' market value and the broad coverage across various industries. The influence of a specific industry is neutralized within the overall market, and the majority of stocks within the index belong to the technology sector, which possesses substantial growth potential and room for expansion.
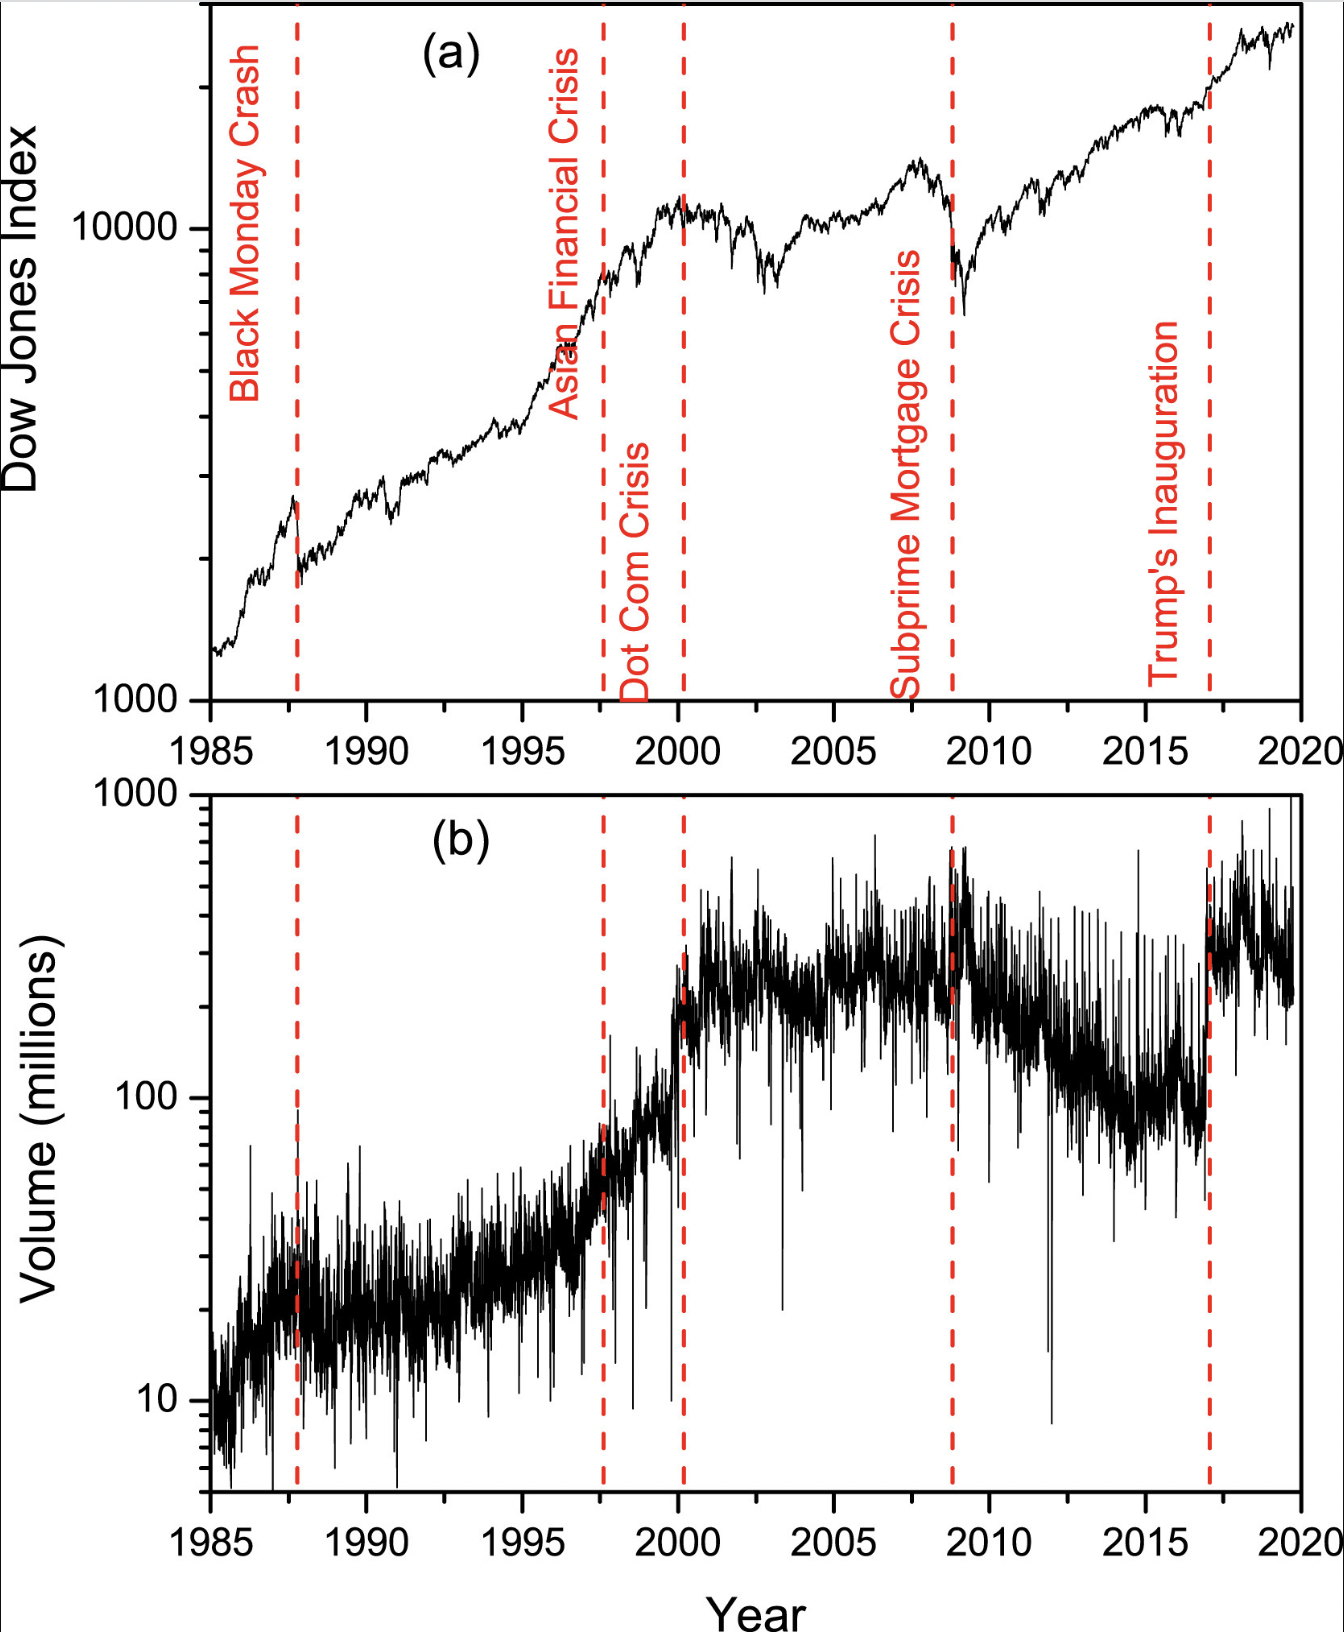
Figure 4: The evolution of DJI between 1985 and 2019[3]
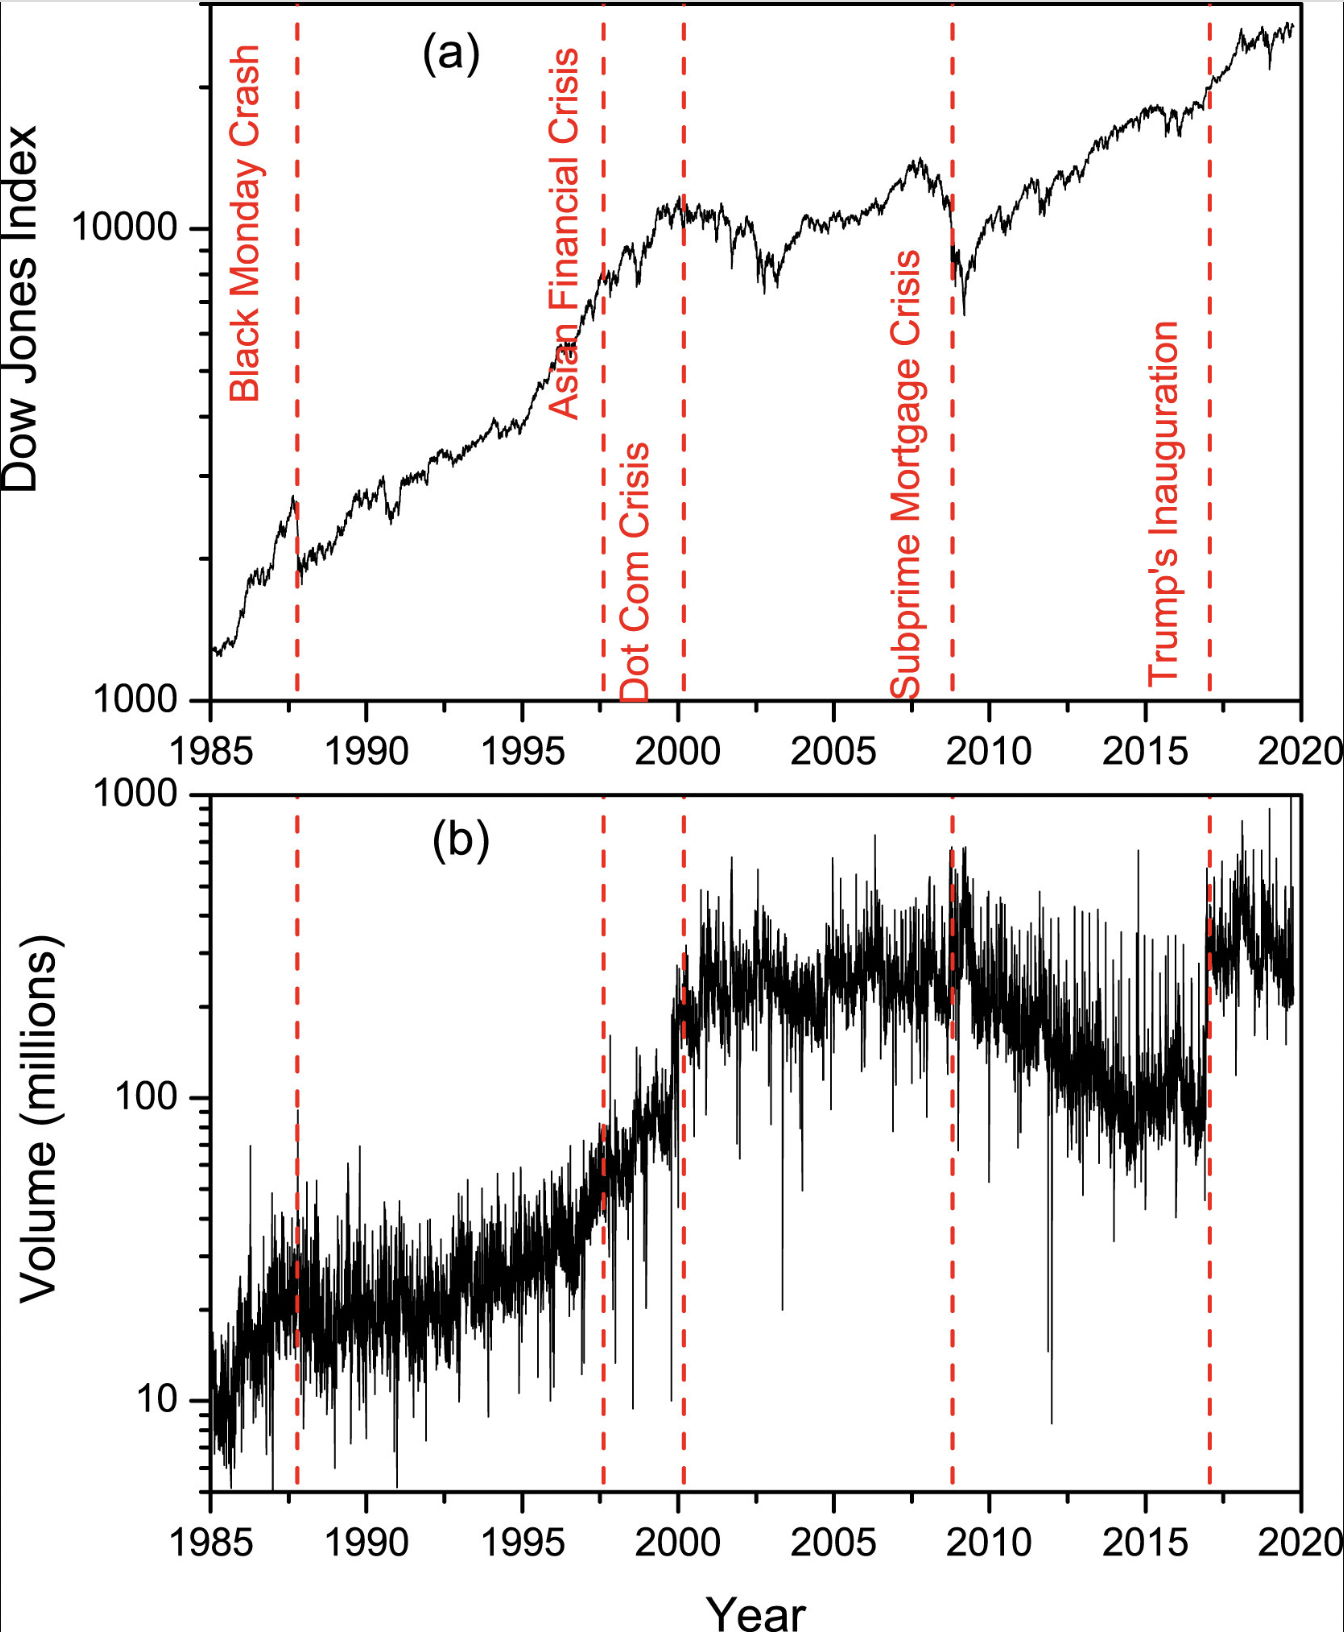
Figure 5: The corresponding trading volume[3]
The daily loss price and volume time series is examined. The years 1985 to 2019 were selected since it was the year that saw the expansion of stock markets and the liberalization of commodity markets, such as those for crude oil, which ushered in the present stage of globalization of the global economy. The development of the DJI between 1985 and 2019 and the accompanying trade volume are seen in Figures 4 and 5[3]. A few significant events are shown by the vertical dotted lines. It has been observed that when noteworthy events take place, the index's upward trend slows down considerably and trading volume rises quickly. This indirectly influences stock price volatility and prevents the index from rising gradually.
Predicting future events is challenging due to their inherent randomness. Consequently, the forecast for the future index relies on nearly 40 years of historical data, leading to the development of the Figures 6&7 forecast models. Using ETS, naive, snaive, and ARIMA forecasting techniques, an analysis was conducted on the future return ratio.
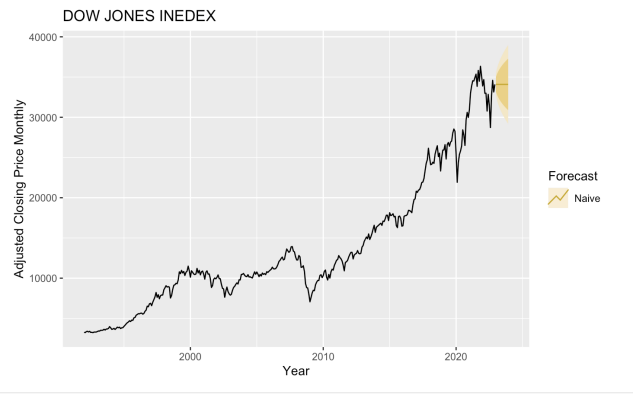
Figure 6: Naive forecast model
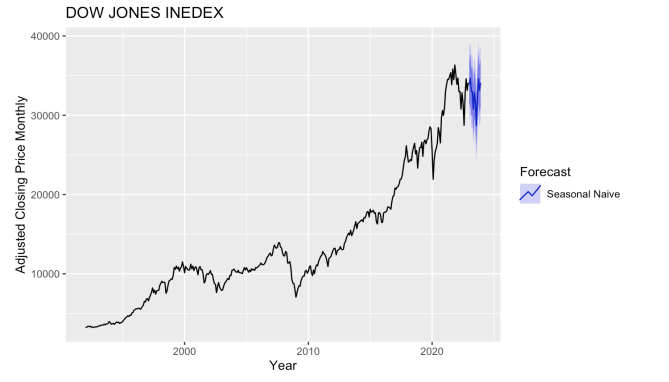
Figure 7: Seasonal Naive forecast model
Through the forecast, it is found that in the next two to three years, the growth rate of the index is relatively slow, with certain fluctuations, but it is expected to increase. Among them, the cyclical impact includes the level of GDP growth, inflation and other macro factors, as well as the specific events of individual important components. The limited length of the observed time series for seasonal changes, coupled with the fact that it primarily encompasses different stocks, diminishes its impact on overall index fluctuations within longer time series [4]. As a result, considering seasonality does not significantly contribute to the analysis.
2.2. Prediction of Future Index Return
Upon observing that the seasonal variations in the index are minimal, the focus of the research shifts towards examining the periodicity and seasonality of the monthly index return rate. This approach allows for a comprehensive exploration of the presence of any cyclical patterns and seasonal trends within the data [5].
First, the daily or monthly rate of return is calculated by the formula as follows (1).
\( Rt=\frac{Pt-Pt-1}{Pt-1} \) (1)
The R language is used for prediction, and its periodicity and seasonality are judged. The ARIMA model is used for prediction, and finally the result is obtained.
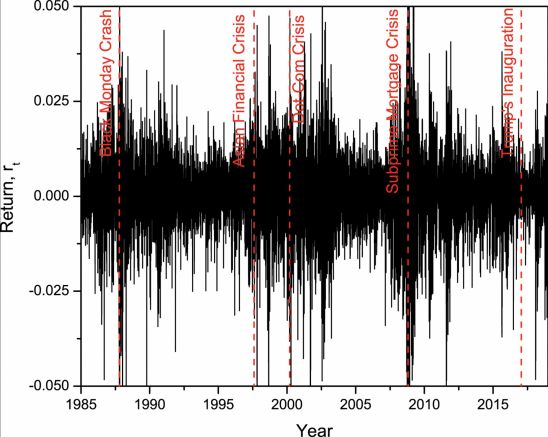
Figure 8: Dynamics of DJI returns between 1985 and 2019[2]
The daily return dynamics are displayed in Figure 8. Given that there is a clustering effect, it is clear that the return dynamics are not truly smooth. In actuality, there are times when returns are low and others when they are great (about 0.025). Particularly volatile times were the subprime financial crisis (September 17, 2008), the Asian Financial Crisis (the third quarter of 1997), and the Black Monday Crash (October 19, 1987). Simultaneously, Figure 9 further splits the monthly rate of return and discovers that there is a link between the monthly rate of return's ups and downs in addition to the rate of return being impacted by significant events.
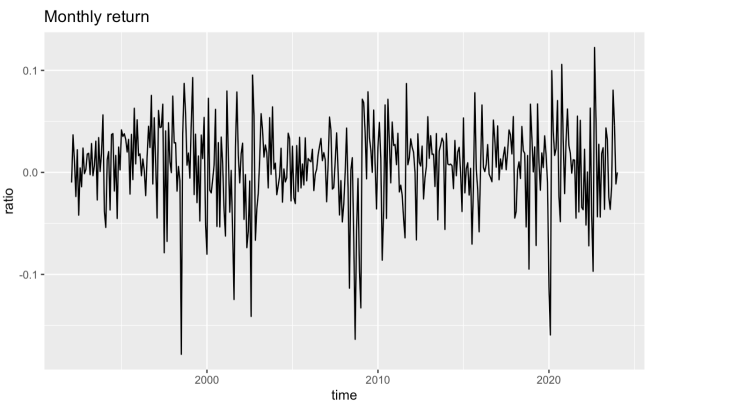
Figure 9: DJI's monthly return between 1994 and 2023
The Dow Jones Industrial Average has seasonal effects in different months, which are mainly manifested as: January effect, December effect. The "January effect" refers to the fact that in January, the stock index usually performs relatively strongly and yields relatively high. This phenomenon may be related to the buying behavior of investors at the beginning of the year, the increase in capital inflows and the emotional factors in the stock market. However, as shown in Figure10, due to the market efficiency, the resulting information impact has a delayed effect on the stock index and the rate of return, resulting in a significant increase in the average rate of return in February and March.
In contrast, the "December effect" states that the stock index usually performs better in December, with higher returns. This may be related to factors such as asset allocation, tax reduction strategies and share buybacks for many investors at the end of the year [6].
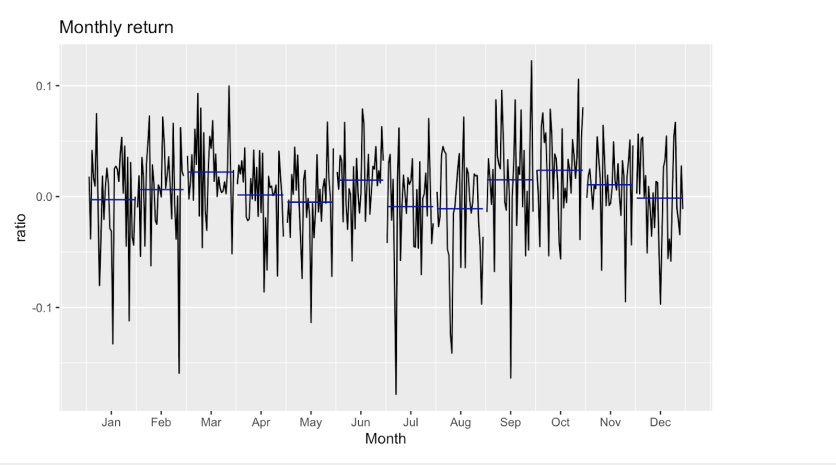
Figure 10: Average return rate for different months
The future return rate of Dow Jones Industrial Index is predicted through ARIMA model, as shown in Figure 11, 12, 13&14. The annual return rate is positive, indicating that the market has profit opportunities, and the seasonal changes of each month show seasonal characteristics as mentioned above.
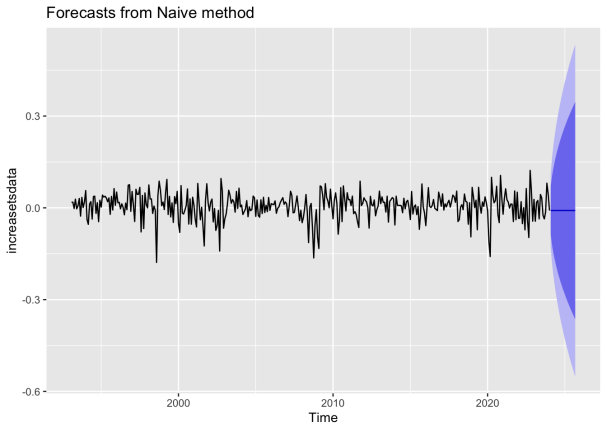
Figure 11: Forecast from Naive method
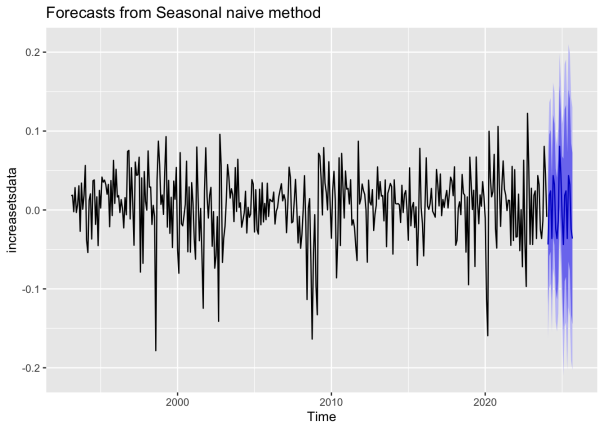
Figure 12: Forecast from Seasonal naive method
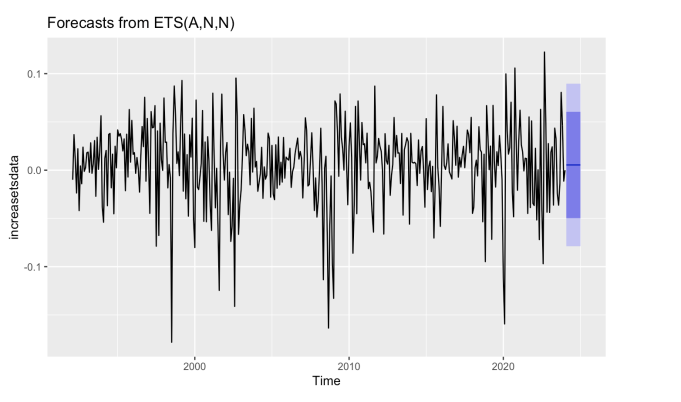
Figure 13: Forecast from ETS(A,N,N)
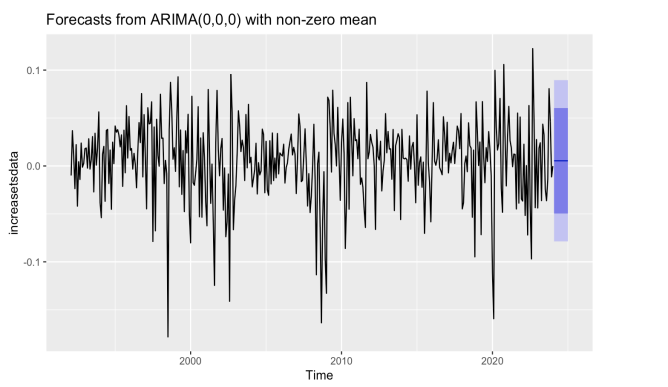
Figure 14: Forecast from ARIMA(0,0,0) with non-zero mean
Initially, the optimal ARIMA model was determined to be ARIMA(0,0,0), indicating that it represents white noise [7]. It became evident that the return ratio does not exhibit stationarity, rendering the ARIMA model unsuitable for forecasting. The results of both the naive and ETS models were consistent and stable, with the mean value slightly above zero. Given the current state of economic development, a general upward trend is expected for the Dow Jones stock market index. However, due to the fluctuating nature of the return ratio between positive and negative values, the forecast values remain stable and fail to reflect numerical changes. Considering the presence of seasonal patterns, the snaive model was identified as the most suitable forecasting model. The forecast data generated by the snaive model also display polytropical characteristics.
Table 2: Predictive test data
ME | RMSE | MAE | MASE | ACF1 | |
Training set | 9.72E-15 | 0.04284731 | 0.03181298 | 0.06994847 | -0.01983551 |
Taking a broader perspective, the return ratio demonstrates significant volatility, frequently oscillating within the range of -0.1 to 0.1. Analyzing the monthly data, it was observed that the average return ratio reached its highest levels during the months of March, April, and October to November, surpassing zero. This suggests the potential existence of favorable investment opportunities during these months. Upon examining the Table2, it became apparent that the return ratio did not exhibit any identifiable trend.
3. Optimize Portfolio
According to previous forecasts, the Dow Jones Index showed a sustained upward trend, and the investment strategy can be roughly divided into simple versions and more complex combinations involving hedging calculations. The simple version is particularly suitable for inexperienced retail investors, whom this study further divides into risk enthusiasts and risk averse investors. On the other hand, the complex capital assets pricing model is more suitable for professional institutional investors.
3.1. Simple Versions
3.1.1. Risk Lover
The analysis of the Dow Jones Industrial Index and its yield forecast reveals a relatively stable overall growth trend. Consequently, it is recommended to consider purchasing call options on the Dow Jones Industrial Index. The Table 3 provides relevant information regarding the available index options [7].
Table 3: Example of the option about DJI index
Symbol | ETF Name | Inverse | Total Assets ($MM) | YTD | Avg Volume | Previous Closing Price | 1-Day Change |
SDOW | ProShares UltraPro Short Dow30 | 3x | $418.44 | 3.32% | 7,688,181 | 19.00 | 1.88% |
DOG | ProShares Short Dow30 | 1x | $182.99 | 1.15% | $787,370.00 | 30.07 | 0.30% |
DXD | ProShares UltraShort Dow30 | 2x | $82.55 | 2.77% | $379,049.00 | 34.71 | 0.49% |
WEBS | Direxion Daily Dow Jones Internet Bear 3X Shares | 3x | $27.30 | 1.41% | $392,667.00 | 8.64 | 1.05% |
Options serve as leveraged instruments that enable investors to control a larger value of assets with a smaller investment. By purchasing options on the Dow Jones Index, investors can participate in its price movements without owning the underlying shares. This approach allows for the potential of significant returns on investment with a relatively small initial capital outlay. However, it is important to note that this strategy carries inherent risks. If the yield turns out to be negative upon maturity, the higher leverage ratio could result in greater losses. This investment strategy advice is intended for investors who are willing to tolerate a certain level of risk and represents a straightforward approach.
3.1.2. Risk Adverse
Consider investing in an exchange-traded fund (ETF) or an index fund that focuses on the Dow Jones Industrial Average [8]. By opting for these types of funds, investors can access diversified investment opportunities across a wide range of markets, thereby reducing the risk associated with specific companies or industries. Moreover, these funds typically feature lower management fees and transaction costs compared to other investment options.
Index funds, in particular, boast lower management fees as their investment strategy revolves around tracking the performance of a specific index, eliminating the need for frequent trading and extensive research. This cost-effectiveness contributes to enhanced long-term investment returns. Furthermore, index funds can be traded on the stock exchange, offering investors the convenience and flexibility of real-time trading based on their individual needs and prevailing market conditions. This eliminates the requirement to wait for confirmation and processing from fund companies.
3.2. Hedging calculations
Through forecasting, the result shows that the overall market is relatively positive, and the index has a steady upward trend, so it is of little significance to hedge risks. However, due to the instability of the market, there may be some events that will shock the market. Therefore, investor can choose industries or companies that are more promising in the future to invest in, but investor can avoid the impact of the market in the future by the following operations.
The CAPM Model (2) is used to predict the return of a stock [9]:
\( Eri=Rf+βi(Erm-Rf)+ε \) (2)
Where ERi represents the total expected return of investment, Rf represents the risk-free rate, βi represents the beta of the investment (Sensitivity coefficient), (ERm−Rf) is equal to the market risk premium, \( ε \) represents the internal factor of certain company/industry. Focusing on the industry's future or instances in which a firm generates more profits through its own business highlights have a lot of promise. In these kinds of situations, you should think about buying a put option with an inverse ratio of 1x on the Dow Jones Industrial Average in the buy market. This approach allows for hedging against the market factor \( Rf+βi(Erm-Rf) \) in the stock. Consequently, irrespective of the market index's fluctuations, the income generated by the business or the company itself e can be obtained [10]. By purchasing a put option on the Dow Jones Industrial Average, investors only incur a relatively lower cost due to the utilization of leverage. This enables them to benefit from potential gains while limiting potential losses.
Simultaneously, it enhances comprehension of the higher-order Four-Movement Capital Asset Pricing Model (Four-Movement CAPM) [11]. The Four-Movement CAPM expands on the original CAPM by incorporating four distinct movements or sources of risk that influence investment returns.
Market Movement: This pertains to the overall market or specific market index's fluctuations.
Industry Movements: Industries or sectors within the market may exhibit unique movements and associated risks. The Four-Movement CAPM acknowledges that industry-specific factors can impact investment returns within these sectors.
Company-Specific Changes: Individual companies may encounter distinctive risks and changes specific to their operations, management, financial condition, and other company-specific factors. These factors influence the investment returns of these companies.
Idiosyncratic Risk: Idiosyncratic risk refers to risks that are specific to a particular investment and cannot be diversified away. These risks are independent of market, industry, or company-specific factors, and they directly affect investment returns.
By considering these four movements of risk, the Four-Movement CAPM aims to provide a more comprehensive understanding of investment returns. It recognizes that investments are influenced not only by market movements but also by industry dynamics, company-specific factors, and idiosyncratic risks [12].
4. Conclusion
Through this study and analysis of the long-term time series data of the Dow Jones Index, the paper has uncovered significant evidence supporting the presence of cyclical and seasonal patterns. These findings have important implications not only for understanding long-term trends in financial markets but also for providing valuable insights and information to investors and policymakers. Firstly, this research has identified the cyclical and seasonal nature of the long-term time series data of the Dow Jones Index. By establishing and analyzing time series models, the research result can forecast future market trends and determine the most effective prediction methods. This provides investors with valuable guidance for making informed decisions within different time periods. Secondly, to better understand the impact of the index on the market, the research has incorporated the rate of return in this study and conducted forecasting and analysis. The finding that returns do not follow any identifiable trends or seasonal patterns offers investors more reliable decision-making support. Through portfolio optimization, the paper can achieve a better balance between risks and returns, resulting in a more stable portfolio with long-term growth potential. Additionally, the optimized quantitative trading strategy provides investors with a more informed basis for decision-making, enabling them to better navigate market fluctuations, reduce transaction costs, and improve transaction efficiency.
Overall, this research contributes to the study and analysis of cyclical and seasonal patterns in the Dow Jones Index, forecasts future market trends, analyzes the impact of return ratios on the market, and offers valuable guidance for the future direction of financial markets and investment decisions through portfolio optimization and the quantification of trading strategies. The author believe that these findings will significantly contribute to the stability of financial markets and the interests of investors by creating more value and opportunities. This paper uses several models to study and forecast the Dow Jones index and its yield. But there are some drawbacks. First, this paper uses some functions to draw a graph and draw conclusions from the graph rather than exact calculations. In addition, there are many factors that affect the Dow. For example, breaking news between countries affects the economy, which then affects the Dow. The model of this paper cannot take this breaking news into account. As a result, the author can use more precise calculations that take into account more factors to make this model more accurate. In future studies, the research intends to further explore these findings, incorporate additional data and methods, and provide more comprehensive and in-depth analysis and predictions regarding long-term trends in financial markets and investment decisions.
References
[1]. Darrat, A. F., Rahman, S., & Zhong, M. (2003). Intraday trading volume and return volatility of the DJIA stocks: A note. Journal of Banking & Finance, 27(10), 2035-2043.
[2]. FRED. (2014). The observations for the Dow Jones Industrial Average represent the daily index value at market close. Retrieved from https://fred.stlouisfed.org/series/DJIA
[3]. Alvarez-Ramirez, J., Rodriguez, E., & Ibarra-Valdez, C. (2020). Medium-term cycles in the dynamics of the Dow Jones Index for the period 1985–2019. Physica A: Statistical Mechanics and its Applications, 546, 124017.
[4]. Caporale, G. M., & Plastun, A. (2019). On stock price overreactions: frequency, seasonality and information content. Journal of Applied Economics, 22(1), 602-621.
[5]. Álvarez-Díaz, M., Hammoudeh, S., & Gupta, R. (2014). Detecting predictable non-linear dynamics in Dow Jones Islamic Market and Dow Jones Industrial Average indices using nonparametric regressions. The North American Journal of Economics and Finance, 29, 22-35.
[6]. Robbani, M. G., & Bhuyan, R. (2005). Introduction of futures and options on a stock index and their impact on the trading volume and volatility: Empirical evidence from the DJIA components. Derivatives Use, Trading & Regulation, 11, 246-260.
[7]. Shumway, R. H., Stoffer, D. S., Shumway, R. H., & Stoffer, D. S. (2017). ARIMA models. Time series analysis and its applications: with R examples, 75-163.
[8]. Ivanov, S. I., Jones, F. J., & Zaima, J. K. (2013). Analysis of DJIA, S&P 500, S&P 400, NASDAQ 100 and Russell 2000 ETFs and their influence on price discovery. Global Finance Journal, 24(3), 171-187.
[9]. Ross, S. A. (1978). The current status of the capital asset pricing model (CAPM). The Journal of Finance, 33(3), 885-901.
[10]. Fama, E. F., & French, K. R. (2004). The capital asset pricing model: Theory and evidence. Journal of economic perspectives, 18(3), 25-46.
[11]. Ranaldo, A., & Favre, L. (2005). Hedge fund performance and higher-moment market models. Journal of Alternative Investments, 8(3), 37.
[12]. Akbaş, S., & Dalkiliç, T. E. (2021). A hybrid algorithm for portfolio selection: An application on the Dow Jones Index (DJI). Journal of Computational and Applied Mathematics, 398, 113678.
Cite this article
Zhang,Z. (2024). Analysis of Periodic and Seasonal Characteristics in Time Series: Taking the Dow Jones Industrial Average as an Example. Advances in Economics, Management and Political Sciences,84,149-162.
Data availability
The datasets used and/or analyzed during the current study will be available from the authors upon reasonable request.
Disclaimer/Publisher's Note
The statements, opinions and data contained in all publications are solely those of the individual author(s) and contributor(s) and not of EWA Publishing and/or the editor(s). EWA Publishing and/or the editor(s) disclaim responsibility for any injury to people or property resulting from any ideas, methods, instructions or products referred to in the content.
About volume
Volume title: Proceedings of the 2nd International Conference on Management Research and Economic Development
© 2024 by the author(s). Licensee EWA Publishing, Oxford, UK. This article is an open access article distributed under the terms and
conditions of the Creative Commons Attribution (CC BY) license. Authors who
publish this series agree to the following terms:
1. Authors retain copyright and grant the series right of first publication with the work simultaneously licensed under a Creative Commons
Attribution License that allows others to share the work with an acknowledgment of the work's authorship and initial publication in this
series.
2. Authors are able to enter into separate, additional contractual arrangements for the non-exclusive distribution of the series's published
version of the work (e.g., post it to an institutional repository or publish it in a book), with an acknowledgment of its initial
publication in this series.
3. Authors are permitted and encouraged to post their work online (e.g., in institutional repositories or on their website) prior to and
during the submission process, as it can lead to productive exchanges, as well as earlier and greater citation of published work (See
Open access policy for details).
References
[1]. Darrat, A. F., Rahman, S., & Zhong, M. (2003). Intraday trading volume and return volatility of the DJIA stocks: A note. Journal of Banking & Finance, 27(10), 2035-2043.
[2]. FRED. (2014). The observations for the Dow Jones Industrial Average represent the daily index value at market close. Retrieved from https://fred.stlouisfed.org/series/DJIA
[3]. Alvarez-Ramirez, J., Rodriguez, E., & Ibarra-Valdez, C. (2020). Medium-term cycles in the dynamics of the Dow Jones Index for the period 1985–2019. Physica A: Statistical Mechanics and its Applications, 546, 124017.
[4]. Caporale, G. M., & Plastun, A. (2019). On stock price overreactions: frequency, seasonality and information content. Journal of Applied Economics, 22(1), 602-621.
[5]. Álvarez-Díaz, M., Hammoudeh, S., & Gupta, R. (2014). Detecting predictable non-linear dynamics in Dow Jones Islamic Market and Dow Jones Industrial Average indices using nonparametric regressions. The North American Journal of Economics and Finance, 29, 22-35.
[6]. Robbani, M. G., & Bhuyan, R. (2005). Introduction of futures and options on a stock index and their impact on the trading volume and volatility: Empirical evidence from the DJIA components. Derivatives Use, Trading & Regulation, 11, 246-260.
[7]. Shumway, R. H., Stoffer, D. S., Shumway, R. H., & Stoffer, D. S. (2017). ARIMA models. Time series analysis and its applications: with R examples, 75-163.
[8]. Ivanov, S. I., Jones, F. J., & Zaima, J. K. (2013). Analysis of DJIA, S&P 500, S&P 400, NASDAQ 100 and Russell 2000 ETFs and their influence on price discovery. Global Finance Journal, 24(3), 171-187.
[9]. Ross, S. A. (1978). The current status of the capital asset pricing model (CAPM). The Journal of Finance, 33(3), 885-901.
[10]. Fama, E. F., & French, K. R. (2004). The capital asset pricing model: Theory and evidence. Journal of economic perspectives, 18(3), 25-46.
[11]. Ranaldo, A., & Favre, L. (2005). Hedge fund performance and higher-moment market models. Journal of Alternative Investments, 8(3), 37.
[12]. Akbaş, S., & Dalkiliç, T. E. (2021). A hybrid algorithm for portfolio selection: An application on the Dow Jones Index (DJI). Journal of Computational and Applied Mathematics, 398, 113678.


