


1. Introduction
1.1. Research Background and Motivation
The digital economy has recently been characterized by the remarkable ascent of Non-Fungible Tokens (NFTs), which represent a new class of digital assets. These assets have been transformative, challenging traditional notions of ownership and value within the virtual realm. As unique, indivisible, and verifiable tokens—often on a blockchain—NFTs denote ownership of distinct items or content and have become particularly synonymous with digital art and collectibles [1]. The advent of NFTs signifies a critical transformation in the valuation, exchange, and perception of digital content [2].
The exploration undertaken herein seeks to dissect the pricing trends, volatilities, and defining patterns of these distinctive digital assets by leveraging a comprehensive time-series dataset. The central inquiry revolves around elucidating the valuation trajectories of top NFT collections and the elements that precipitate their valuation shifts.
Amidst a rapidly expanding NFT marketplace, highlighted by notable sales and an evolving community of artists, collectors, and investors, the market dynamics of NFTs are an enigma, with obscurity surrounding their price development and overall valuation. The intrinsic qualities of NFTs, such as digital rarity, creator reputation, and the sentiment of the associated community, contribute to a valuation process that is intricate and frequently capricious. This paper endeavors to fill the void in current knowledge by undertaking an exhaustive time-series analysis of top NFT collections. The objective is to decrypt the price trends and market conduct of these collections across a temporal spectrum, juxtaposing forecasted outcomes against genuine market statistics. This methodology affords a twofold perspective: it appraises the precision of forecasting models within the NFT sphere and sheds light on the authentic market mechanics at play. This investigation not only contributes to the academic discourse on digital economies but also serves practical purposes, assisting investors, creators, and policymakers in navigating the complex milieu of NFTs.
1.2. Literature review
The emergence of NFTs as a distinct asset class in the digital economy has prompted a surge of academic interest, focusing on their market dynamics, valuation processes, and broader economic implications. The current literature encompasses a range of perspectives, from empirical market analyses to theoretical considerations of NFTs' role within the digital and artistic economies.
Recent empirical studies, such as Nadini et al. have provided comprehensive overviews of the NFT market by examining millions of trades. Their work delineates the centralization and network characteristics of NFT ownership and trades, which are indicative of small-world phenomena in the market [3]. Kireyev's exploration of market design, which has significant implications for market intelligence and the perceived value of NFTs based on bidding costs and platform policies [4]. On the theoretical front, investigations into the effect of NFT fungibility on consumer price sensitivity and the impact of revenue sharing mechanisms between creators and owners have started to emerge, laying the groundwork for a deeper understanding of NFT pricing structures [5]. These theoretical frameworks are crucial for developing marketing strategies and policies tailored to the unique characteristics of NFTs. Furthermore, studies have begun to integrate machine learning to predict NFT sales and prices, highlighting the importance of historical sales data and visual features of the digital assets [6]. This predictive approach aids in understanding the determinants of NFT value and contributes to a more nuanced view of the market.
Despite the burgeoning research, the field still grapples with the implications of the speculative nature of NFTs and their relationship with broader cryptocurrency markets. The volatility inherent in the prices of NFTs and their correlation with cryptocurrencies like Ethereum suggests a complex interplay that requires further investigation [7]. Collectively, these studies provide a multifaceted understanding of the NFT market, yet also point towards the need for continued research, particularly in market behavior during periods of economic uncertainty and the role of NFTs in diversifying investment portfolios. This literature review underscores the nascent but rapidly evolving state of NFT research and sets the stage for this paper's contribution to the field.
1.3. Research Contents
The Research Contents of this paper encapsulate a systematic examination of the market dynamics governing NFTs, with a focus on the valuation trends and market behavior of the top NFT collections. This analysis is rooted in a methodical and empirical approach, utilizing a comprehensive dataset that spans daily records from June 2017 to November 2021, providing a rich temporal landscape for exploration. The research trajectory commences with the stabilization of the inherently non-stationary time series data, employing transformations to ensure the appropriateness of subsequent analyses. The Autoregressive Integrated Moving Average (ARIMA) model is then applied, serving as a cornerstone for forecasting and interpretive efforts. This model enables the elucidation of patterns within the fluctuating valuations of NFTs, revealing insights into the predictive nature of market trends.
In essence, this research Contents aim to decode the intricacies of NFT market dynamics, offering a data-driven narrative that informs stakeholders about the factors shaping the valuation of digital art and collectibles.
2. Methodology
2.1. Data Selection and Processing
The dataset central to this investigation, sourced from Kaggle and denominated "NFT Top Collections," offers an exhaustive exploration of the NFT market, focusing on the top 300 NFT collections [8]. This dataset is distinguished by its breadth of metrics, which are essential for a granular analysis of the NFT marketplace. It meticulously records collection names, categories, total sales, average prices, and additional relevant indicators such as rarity scores, ownership distribution, and transaction frequencies. These metrics encompass daily data recordings across an extensive temporal scope, ranging from June 2017 to November 2021. This period encapsulates the nascent stages of the NFT market's development as well as its subsequent expansion, rendering the dataset invaluable for longitudinal market trend analysis and price dynamics investigation within the NFT domain.
The strategic selection of this dataset underpins the empirical foundation of the study, enabling the application of time-series analysis to discern patterns, fluctuations, and potential causal relationships within the data. Such an analytical approach is instrumental in developing predictive models that project future market trends based on historical observations. The study further entails a comparative analysis between these model-based forecasts and actual market outcomes, thereby assessing the forecast accuracy and contributing to a more nuanced understanding of market dynamics.
The focus of the study on the daily sales volume and the number of market active wallets requires a nuanced understanding of these variables. The daily sales volume, representing the total monetary value of transactions within each NFT collection on a daily basis, serves as a direct indicator of the market's liquidity and financial health. Concurrently, the number of market active wallets, reflecting the count of unique wallets that participated in transactions each day, provides insights into the depth of market participation and the breadth of investor engagement. The dataset documenting activities and transactions across the top 300 NFT collections from June 2017 to November 2021 was confirmed to be complete, with no missing values detected in the essential metrics of daily sales volume and the number of market active wallets. This level of data integrity ensures a robust foundation for the subsequent analysis, eliminating the need for data imputation and allowing for a direct assessment of the NFT market's dynamics.
2.2. Model construction
2.2.1. Time Series Analysis with ARIMA Model
Central to the methodological approach is the application of the Autoregressive Integrated Moving Average (ARIMA) model for time series analysis. ARIMA models are particularly suited for analyzing and forecasting time series data, allowing for the identification of underlying patterns such as trends and seasonality in historical data points [9]. The model operates by explaining a given time series based on its own past values, incorporating three main components: autoregression (AR), differencing (I), and moving averages (MA).
Autoregression (AR): This component models the current value of the series as a function of its previous values. Differencing (I): This process makes the time series stationary, addressing trends and removing seasonality by subtracting the current value from the previous value. Moving Average (MA): This aspect models the error term as a combination of error terms from the past, including both shocks and white noise.
2.2.2. Significance of ARIMA in This Study
The ARIMA model's ability to accommodate the non-stationary nature of financial time series data, including those observed in the NFT market, renders it exceptionally pertinent for this study. By applying the ARIMA model, the research aims to forecast future market behaviors based on the historical data of daily sales volumes and the number of market active wallets. This predictive capacity is crucial for understanding potential future market trends and preparing for market shifts. The choice of the ARIMA model for this analysis stems from its flexibility and efficiency in handling various types of time series data. Its applicability to non-stationary data, aligns well with the characteristics of the NFT market data. Moreover, the ARIMA model's adaptability to incorporate seasonal patterns and external factors offers a comprehensive framework for analyzing the intricate dynamics of the NFT market. The model's predictive accuracy and the interpretability of its results further justify its selection, aiming to contribute insightful forecasts and deepened understanding of market dynamics.
2.2.3. Application to NFT Market Analysis
In applying the ARIMA model to the NFT market data, this study conducts a detailed parameter estimation process to identify the optimal model specifications for both daily sales volume and the number of market active wallets. This involves determining the appropriate order of differencing to achieve stationarity, as well as the optimal number of lagged terms for the AR and MA components. The resulting ARIMA models are then used to forecast short-term market trends, providing a foundation for subsequent analysis and discussion on market dynamics [10]. Through this methodological approach, the study aspires to offer a predictive outlook on the NFT market, facilitating informed decision-making for investors and stakeholders within the digital asset ecosystem.
3. Analysis of Empirical Results
3.1. Sales Price Forecast
This subsection engages in the empirical analysis of the NFT market, initiating with the scrutiny of daily sales prices. The subsequent figure delineates the outcomes of this scrutiny, capturing the observed fluctuations and offering a preliminary visual depiction of market behavior. The intricacies of these observations are conveyed in Figure 1, which renders a graphical interpretation of the variability in daily sales prices pertaining to the NFT market.
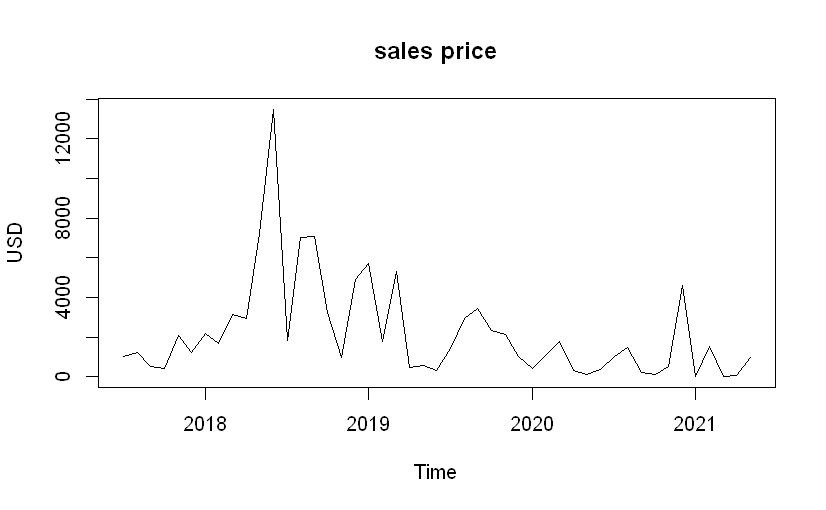
Figure 1: NFT Daily Sales Amount Variability.
Figure 1 displays the variability of the NFT daily sales amount over time. It is evident that there are substantial fluctuations in sales, with peaks suggesting periods of high activity or notable sales events within the NFT market. The sales appear to exhibit a non-stationary pattern with a possible seasonality component, as indicated by the repeated spikes in sales. This initial figure sets the stage for understanding the raw, untransformed behavior of the market over the observed time period.
The initial analysis reveals that the original daily sales amount series is non-stationary. To address this, a Box-Cox transformation was applied, resulting in a stabilized series amenable to further analysis. The ARIMA(0,1,1) model was subsequently constructed for the transformed data. The forecasting results derived from this model are presented in Figure 2.
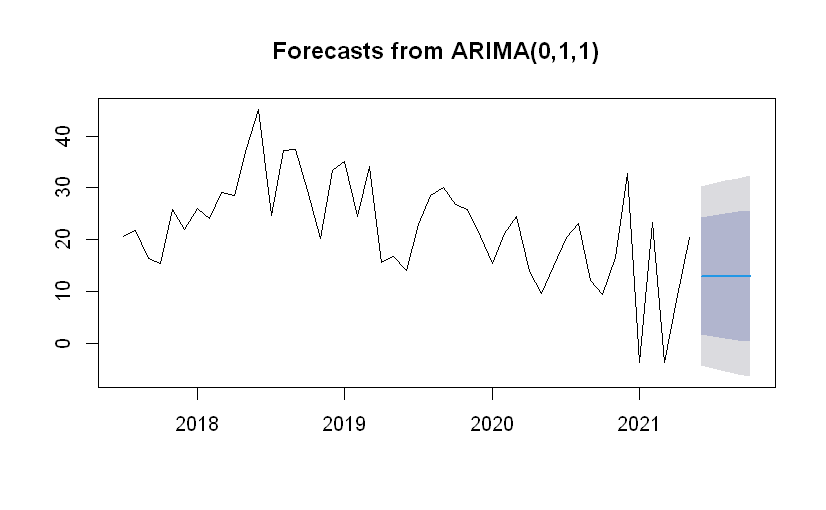
Figure 2: Forecasting Post Box-Cox Transformation with ARIMA Model.
Figure 2 presents the results after applying a Box-Cox transformation, which is used to stabilize variance and make the data more closely meet the assumptions of homoscedasticity required for ARIMA modeling. The ARIMA (0,1,1) model was selected, indicating no autoregressive terms, one differencing step to achieve stationarity, and one moving average term, suggesting that the next value in the series is likely to be close to a weighted moving average of recent past observations and random shocks.
The forecast, as visualized in Figure 2, includes a confidence interval (the shaded area) which offers an estimated range of future sales volumes. The narrowness of the confidence interval indicates a higher level of precision in the forecast, although it is important to note that the actual values could still fall outside this range due to the unpredictable nature of the NFT market.
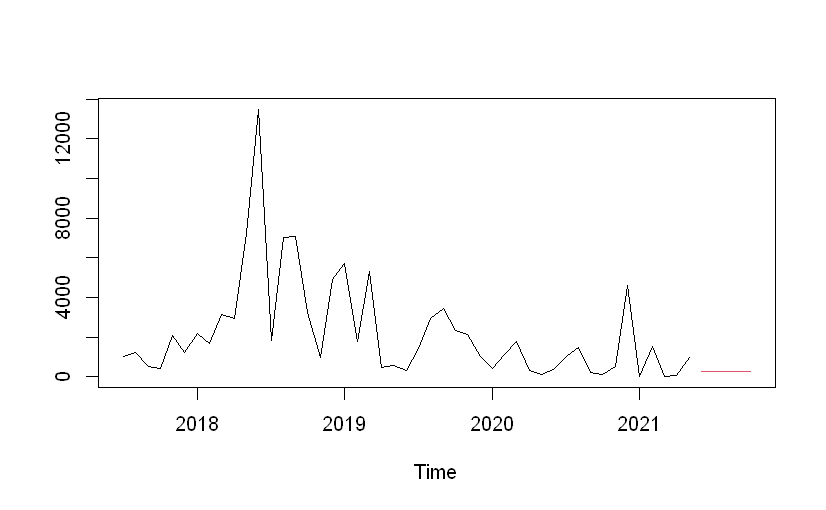
Figure 3: Inverse Box-Cox Transformation to Original Sales Values.
Figure 3 provides the forecasted values after applying the inverse Box-Cox transformation, translating the transformed data back into the original units of the daily sales amounts. This step is crucial as it allows for the interpretation of the forecasted values in a context that is meaningful for stakeholders in the NFT market. The inverse transformation reveals the expected raw sales figures, which can be directly compared with historical data. The Figure 3 suggests that the expected daily sales amount will continue to experience fluctuations but within a certain range predicted by the ARIMA model. This could potentially be used to inform strategies around pricing, sales timing, and inventory management for stakeholders within the NFT market.
These figures 1-4 depict a comprehensive narrative of the time series forecasting process for NFT sales. Starting from an unadjusted sales series, the data undergoes a transformation to meet the requirements of the ARIMA model, followed by a prediction and a reversion to the original scale. The analysis suggests that the NFT market exhibits volatility, with potential periodicity, and that the ARIMA (0,1,1) model is capable of capturing the essence of this behavior for forecasting purposes. The choice of the Box-Cox and ARIMA model combination demonstrates a methodological rigor in addressing non-normality and non-stationarity within the time series data, providing a scientifically grounded forecast that could be valuable for market participants.
3.2. NFT Active Wallet Trend
Moving from the analysis of sales prices to market engagement, the following exploration focuses on the trend in active wallet numbers within the NFT ecosystem. The forthcoming figure provides a visualization of this trend, capturing the daily changes in active wallet numbers. The nuances of this pattern are illustrated in Figure 4, which elucidates the fluctuating participation rates from 2017 to 2021.
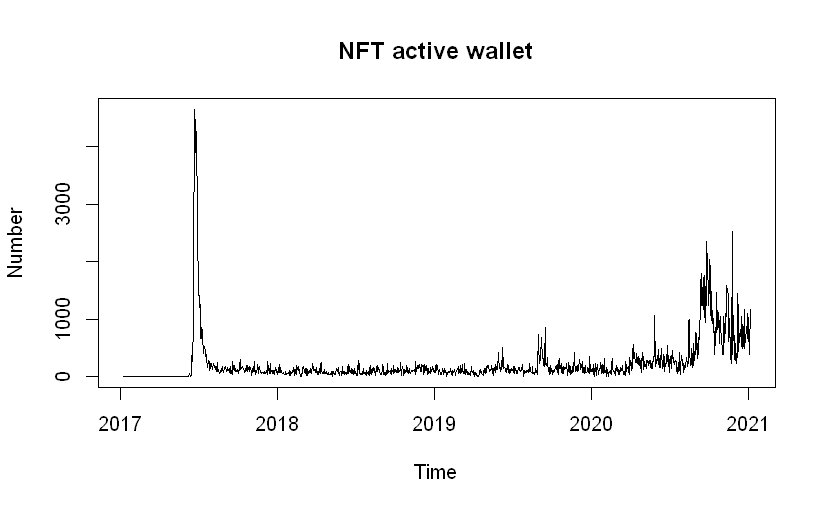
Figure 4: Daily Variation in NFT Active Wallet Numbers.
Figure 4 showcases the day-to-day fluctuations in the number of active wallets within the NFT market from 2017 to 2021. The graph illustrates a highly volatile behavior with a significant spike in early data points, suggesting a potential outlier or an extraordinary event in the market. Post the initial spike, the number of active wallets exhibits a growing trend with increased volatility over time, indicating a market that is both expanding and experiencing frequent shifts in participant activity.
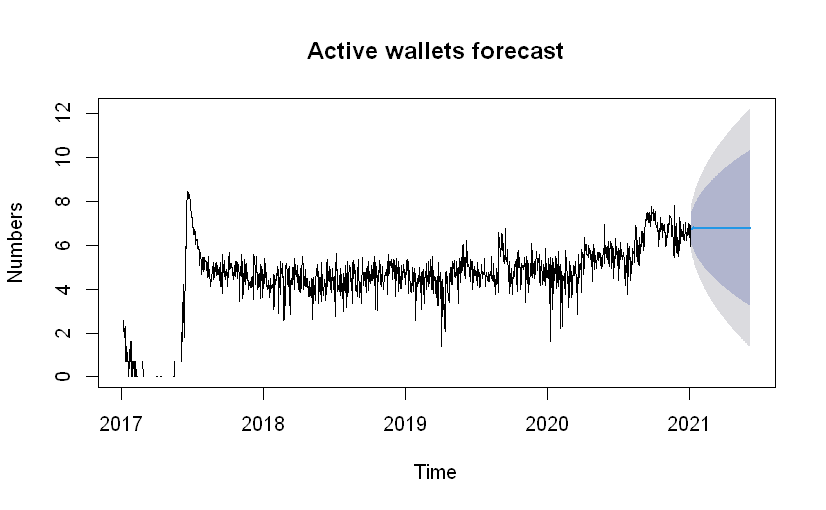
Figure 5: Log-Transformed Active Wallets Forecast with ARIMA Model.
Figure 5 presents a forecast for the number of active wallets based on log-transformed data analyzed using an ARIMA model. Log transformation used to stabilize the variance in time series data, particularly for data with exponential growth or large variances, as seems to be the case with the NFT active wallets. The forecast, which extends beyond the observed data, shows the confidence interval in a shaded area, indicating the range within which future values are expected to fall with a certain probability. The increasing width of the confidence interval as time progresses reflects greater uncertainty in the longer-term predictions.
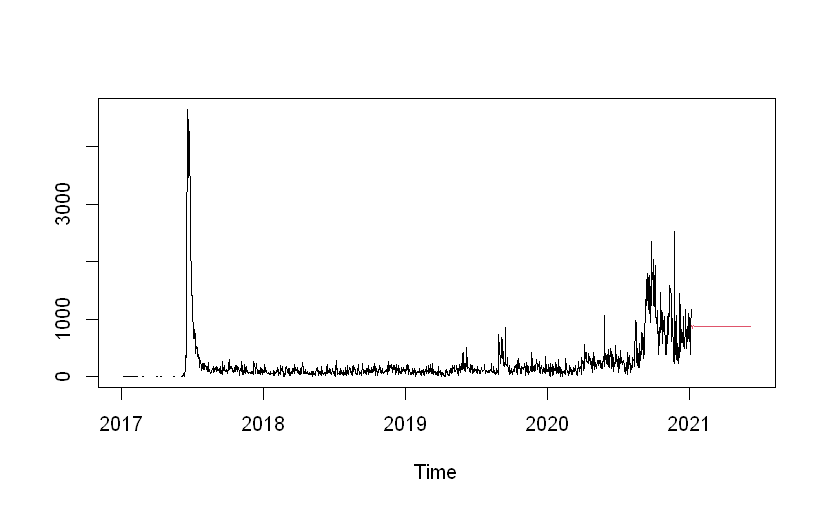
Figure 6: Forecast Reversed from Log Transformation.
Figure 6 provides the forecast for the number of active wallets after reversing the log transformation, restoring the data to its original scale. This allows for a more intuitive interpretation of the forecasted values in terms of actual wallet numbers. The graph suggests a continued growth in the number of active wallets, with a recognition of the inherent volatility in the NFT market as seen by the fluctuations around the forecasted trend line.
Collectively, these graphs narrate the analytical journey from observing the raw data of active wallets in the NFT market to developing a forecasted trend based on a transformed time series. The initial spike in Graph One indicates that while there may be occasional outlier events in the NFT market, the overall trend is upward, reflecting increasing market participation over time. The forecast in Graphs Two and Three provides a projection of this trend into the future, albeit with an acknowledgment of the uncertainties inherent in such predictive modeling.
This analysis is crucial for stakeholders in the NFT market as it offers insights into both the current state of market activity and potential future trends. The use of ARIMA modeling on log-transformed data demonstrates a methodical approach to handling the skewness and heteroscedasticity of the original data, while the inverse transformation ensures the applicability of the forecasted results to real-world scenarios.
4. Discussion
The time-series forecasts of NFT sales and active wallet counts unveil a market that is, simultaneously, burgeoning and exhibiting pronounced volatility. The analysis of sales data reveals not only the presence of cyclical trends, potentially tied to market events or technological milestones, but also the influence of broader economic forces and shifts in collector sentiment. This volatility, while indicative of a market in its relative infancy, also reflects the innovation-driven, fast-paced nature of the digital economy. As such, the NFT market is characterized by periods of rapid growth followed by equally swift contractions, paralleling the broader trends observed in technology adoption life cycles.
The active wallet forecast, on the other hand, denotes increasing participation and engagement within the NFT space. This trend suggests a growing acceptance of NFTs as a component of digital asset portfolios and indicates that the market is gradually transitioning from a niche interest to a more established sector within the digital economy. However, the spike and subsequent fluctuations also point to the impact of speculative trading and the need for market stabilization mechanisms.
From a policy perspective, the results underscore the necessity for regulatory frameworks that can accommodate the unique characteristics of the NFT market. Current regulations designed for traditional assets may not directly translate to the digital realm, where ownership and value are governed by different paradigms. Regulators should consider policies that protect investors and creators in the NFT space without stifling innovation or the organic growth of the market.
Moreover, the findings suggest that stakeholders must remain agile, with artists and creators needing to be mindful of timing and marketing strategies that align with these market fluctuations. Investors and collectors should approach the market with a strategy that considers both the potential for significant returns during peak periods and the risk associated with the market's inherent instability.
In summary, while the predictive models used in this study provide valuable insights into the NFT market's behavior, they also highlight the need for ongoing research to better understand the complexities of digital economies. Future studies could focus on integrating a wider range of economic indicators, behavioral data, and technological trends to refine these models further. The Discussion section ties these strands together, emphasizing that while the market shows promise, caution and informed policy development are crucial for its healthy evolution.
5. Conclusion
In concluding this investigation into the market dynamics of Non-Fungible Tokens (NFTs), the central argument posits that the valuation trends of NFTs are influenced by a complex interplay of digital scarcity, artist reputation, and community sentiment, which collectively contribute to a volatile yet forecastable market landscape. The utilization of time-series analysis, specifically the ARIMA model, has facilitated a deeper understanding of these trends, providing predictive insights that are valuable to various stakeholders within the digital economy.
However, the study acknowledges its limitations, particularly the challenge of accounting for the rapid evolution of the NFT market and the speculative nature of its assets. The unpredictable impact of high-profile events and shifting market sentiments poses difficulties in extending the predictive accuracy of the models over longer periods. Additionally, the inherent constraints of data accessibility related to blockchain transactions may curtail the depth of analysis. Despite these limitations, the research contributes a foundational analysis of NFT market dynamics, offering a data-driven perspective that is scarce in existing literature. It opens avenues for future research, particularly in refining predictive models to accommodate the unique attributes of NFTs and in exploring the sociological aspects of digital asset ownership. Further investigation could also consider the integration of real-time blockchain data to enhance analytical precision and explore the potential of alternative econometric models to better capture the market's non-linear dynamics. The findings of this study serve as a stepping stone for subsequent research, providing a structured framework for analyzing NFT markets and contributing to the emergent body of knowledge that seeks to understand the valuation of digital art and collectibles within the broader context of the digital economy.
References
[1]. Regner, F., Urbach, N., & Schweizer, A. (2019). NFTs in practice–non-fungible tokens as core component of a blockchain-based event ticketing application.
[2]. Horky, F., Rachel, C., & Fidrmuc, J. (2022). Price determinants of non-fungible tokens in the digital art market. Finance Research Letters, 48, 103007.
[3]. Nadini, M., Alessandretti, L., Di Giacinto, F., Martino, M., Aiello, L. M., & Baronchelli, A. (2021). Mapping the NFT revolution: market trends, trade networks, and visual features. Scientific reports, 11(1), 20902.
[4]. Kireyev, P. (2022). NFT marketplace design and market intelligence.
[5]. Zhang, Z. J. (2023). Cryptopricing: Whence comes the value for cryptocurrencies and NFTs?. International Journal of Research in Marketing, 40(1), 22-29.
[6]. Dowling, M. (2022). Is non-fungible token pricing driven by cryptocurrencies? Finance Research Letters, 44, 102097.
[7]. Apostu, S. A., Panait, M., Vasa, L., Mihaescu, C., & Dobrowolski, Z. (2022). NFTs and Cryptocurrencies—The Metamorphosis of the Economy under the Sign of Blockchain: A Time Series Approach. Mathematics, 10(17), 3218.
[8]. Devastator, T. (2022). NFT Top Collections (timeseries). Retrieved from http://www.kaggle.com/datasets/thedevastator/nft-top-collections?resource=download&select=NFT_Top_Collections.csv
[9]. Siami-Namini, S., Tavakoli, N., & Namin, A. S. (2018). A comparison of ARIMA and LSTM in forecasting time series. In 2018 17th IEEE international conference on machine learning and applications (ICMLA). IEEE. 1394-1401.
[10]. Wang, W., & Yildirim, G. (2021). Applied time-series analysis in marketing. In Handbook of Market Research. Cham: Springer International Publishing. 469-513.
Cite this article
Chen,H. (2024). Time Series Analysis of Market Dynamics within Top NFT Collection. Advances in Economics, Management and Political Sciences,84,172-181.
Data availability
The datasets used and/or analyzed during the current study will be available from the authors upon reasonable request.
Disclaimer/Publisher's Note
The statements, opinions and data contained in all publications are solely those of the individual author(s) and contributor(s) and not of EWA Publishing and/or the editor(s). EWA Publishing and/or the editor(s) disclaim responsibility for any injury to people or property resulting from any ideas, methods, instructions or products referred to in the content.
About volume
Volume title: Proceedings of the 2nd International Conference on Management Research and Economic Development
© 2024 by the author(s). Licensee EWA Publishing, Oxford, UK. This article is an open access article distributed under the terms and
conditions of the Creative Commons Attribution (CC BY) license. Authors who
publish this series agree to the following terms:
1. Authors retain copyright and grant the series right of first publication with the work simultaneously licensed under a Creative Commons
Attribution License that allows others to share the work with an acknowledgment of the work's authorship and initial publication in this
series.
2. Authors are able to enter into separate, additional contractual arrangements for the non-exclusive distribution of the series's published
version of the work (e.g., post it to an institutional repository or publish it in a book), with an acknowledgment of its initial
publication in this series.
3. Authors are permitted and encouraged to post their work online (e.g., in institutional repositories or on their website) prior to and
during the submission process, as it can lead to productive exchanges, as well as earlier and greater citation of published work (See
Open access policy for details).
References
[1]. Regner, F., Urbach, N., & Schweizer, A. (2019). NFTs in practice–non-fungible tokens as core component of a blockchain-based event ticketing application.
[2]. Horky, F., Rachel, C., & Fidrmuc, J. (2022). Price determinants of non-fungible tokens in the digital art market. Finance Research Letters, 48, 103007.
[3]. Nadini, M., Alessandretti, L., Di Giacinto, F., Martino, M., Aiello, L. M., & Baronchelli, A. (2021). Mapping the NFT revolution: market trends, trade networks, and visual features. Scientific reports, 11(1), 20902.
[4]. Kireyev, P. (2022). NFT marketplace design and market intelligence.
[5]. Zhang, Z. J. (2023). Cryptopricing: Whence comes the value for cryptocurrencies and NFTs?. International Journal of Research in Marketing, 40(1), 22-29.
[6]. Dowling, M. (2022). Is non-fungible token pricing driven by cryptocurrencies? Finance Research Letters, 44, 102097.
[7]. Apostu, S. A., Panait, M., Vasa, L., Mihaescu, C., & Dobrowolski, Z. (2022). NFTs and Cryptocurrencies—The Metamorphosis of the Economy under the Sign of Blockchain: A Time Series Approach. Mathematics, 10(17), 3218.
[8]. Devastator, T. (2022). NFT Top Collections (timeseries). Retrieved from http://www.kaggle.com/datasets/thedevastator/nft-top-collections?resource=download&select=NFT_Top_Collections.csv
[9]. Siami-Namini, S., Tavakoli, N., & Namin, A. S. (2018). A comparison of ARIMA and LSTM in forecasting time series. In 2018 17th IEEE international conference on machine learning and applications (ICMLA). IEEE. 1394-1401.
[10]. Wang, W., & Yildirim, G. (2021). Applied time-series analysis in marketing. In Handbook of Market Research. Cham: Springer International Publishing. 469-513.