


1. Introduction
The study of housing prices is of great significance to the economy, society, and individuals. Because not only housing prices are an important macroeconomic indicator that directly reflects the state of economic activity, but also, they affect people's quality of life and social stability straightaway. Over the past few decades, researchers from various disciplines such as economics, urban planning, geography, political science, and computer science have been committed to exploring themes related to housing prices to gain a deeper understanding of the impact of real estate value in different socio-economic environments [1].
For housing price research, time is a very thought-provoking factor. This is because the real estate market is often influenced by seasonal factors and economic cycles, and time series analysis can reveal seasonal and cyclical changes in housing price data. However, research methods based on non-time series, such as cross-sectional studies and panel data analysis, are also very important. According to Lancaster's theory of demand characteristics, consuming a product essentially involves consuming the inherent composite attributes of the product, because consumers do not directly derive utility from the product, but rather from specific attributes related to the product [2]. He proposed that the value of a product can be divided into its attribute values. Assuming that each attribute has a different implicit price, the pricing of a commodity in an equilibrium market can be explained as the cumulative sum of attribute prices, which means that pricing can be modeled based on its characteristics [3]. Based on the above theory, it is reasonable and feasible to predict housing prices using information such as residential area, location, and number of bathrooms based on the characteristics of the house. This method can be used to analyze the influencing factors of housing prices, such as population structure, employment level, educational resources, transportation convenience, etc. Through panel data analysis and other methods, the degree and mechanism of the impact of these factors on housing prices can be discovered, providing a basis for the government and market participants to formulate real estate policies and investment decisions.
Recently, machine learning has become a crucial prediction method, particularly with the increasing emphasis on big data. It predicts housing prices solely based on their attributes, without relying on historical data, thereby improving the accuracy of predictions. Many studies have delved into this issue and affirmed the effectiveness of machine learning in this field [4]. In 2018, Ghosalkar used linear regression algorithm to predict housing prices in Mumbai by taking physical conditions, concepts, and locations as inputs [5]. At the same time, Čeh applied two modeling techniques, traditional linear regression models and a new technology in this field - the random forest model, to predict the housing prices of Ljubljana. They found that using the random forest algorithm can achieve better prediction results [6]. Similar conclusion has been made by a South Krea group leading by Hong when they conduct research on Gangnam area [7]. However, according to the article of Ho, due to the research is based on the specific dataset, the best model is hard to reach a conclusion [8]. In addition to individual typical machine learning models, less popular yet complex models are also considered as an option. In Truong’s study, the optimal solutions of methods such as random forest, XGBoost, and LightGBM with two techniques in machine learning: mixed regression and stacked generalized regression were compared and analyzed. They pointed out that the random forest method has the smallest error on the training set, but is prone to overfitting [4]. Other scholars are also considering using improved versions of traditional algorithms such as Least Squares Support Vector Regression, Classification and Regression Tree, or combining traditional machine learning with modern deep learning such as neural networks to predict housing prices more accurately [9, 10].
With the continuous deepening of housing price research, more and more new algorithms have emerged in this field. In the era of frequent introduction of new algorithms, the popularity of typical machine learning methods as research tools for predicting housing prices is questioned. However, traditional machine learning algorithms continue to maintain their popularity. They offer significant advantages in interpretability, data efficiency, computational efficiency, and other aspects, setting them apart from other algorithms.
In short, housing price prediction has attracted many scholars to discuss and propose new ideas. This article will mainly use the random forest algorithm and linear regression algorithm to predict the housing prices of Ames and compare the advantages and disadvantages of these two algorithms.
2. Methods
2.1. Data Source
The dataset used in this paper is fetched from the Kaggle website (House Prices - Advanced Regression Techniques), collected by Dean De Cock. It was from 2006 to 2010, with a total of 1460 observations and 79 explanatory variables. The original dataset remained in .csv format.
2.2. Variable Selection
Due to the large number of explainable variables in the original data and the high data loss rate of some variables such as PoolQC, MiscFeature, Alley and so on, this article chooses to delete variables with a data loss rate greater than 15%, and focuses on the top 10 variables with the highest correlation coefficient with housing prices. As shown in the following figure 1.
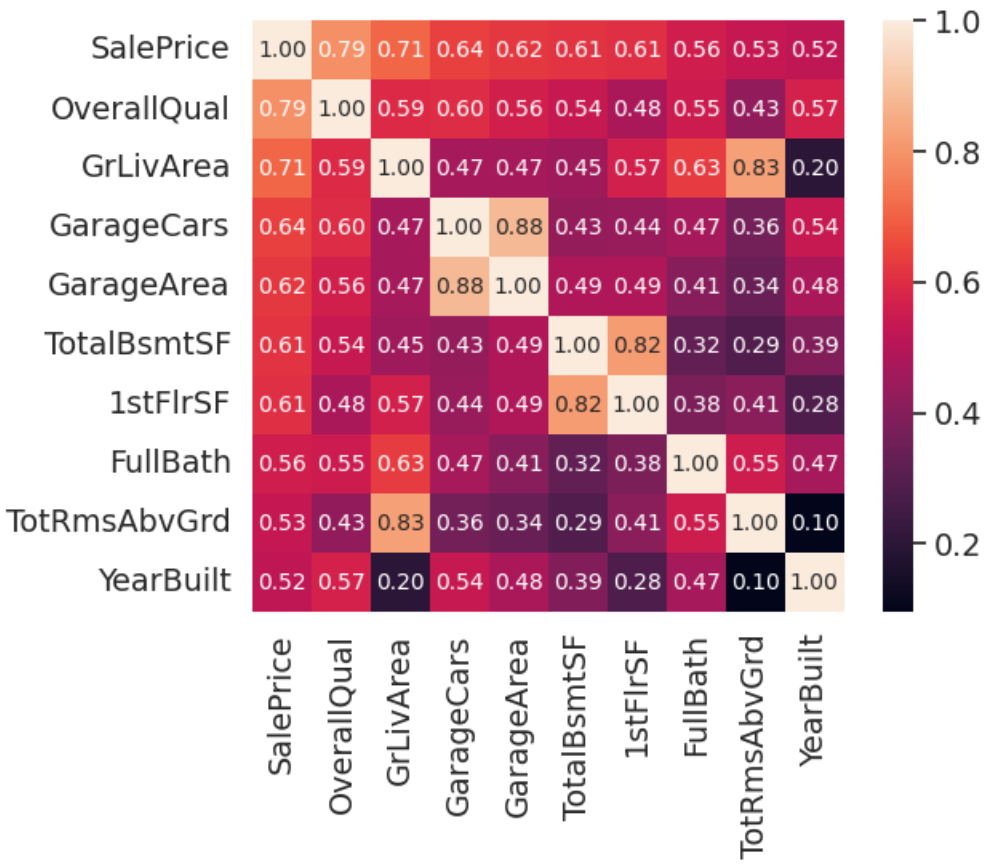
Figure 1: The correlation matrix of 10 variables.
According to Figure 1, these 10 variables revealed a high correlation between three pairs of variables, namely: GarageCars and GarageArea, TotalBsmtSF and 1stFloor, and TotRmsAbvGrd and GrLivArea. Among these three pairs of strongly correlated variables, only one variable needs to be selected to replace the other variable in the subsequent calculation process. The final selected variables are shown in Table 1:
Table 1: List of variables.
Variable | Continuity | Meaning |
OverallQual | Discrete | Overall material and finish quality |
GrLivArea | Continuous | Above grade (ground) living area square feet |
GarageCars | Discrete | Size of garage in car capacity |
TotalBsmtSF | Continuous | Total square feet of basement area |
FullBath | Discrete | Full bathrooms above grade |
YearBuilt | Continuous | Original construction date |
SalePrice | Continuous | Total Housing prices in Ames |
2.3. Model Selection
This article will use multiple linear regression models and random forest models respectively to predict housing prices, and compare the results of the two algorithms.
2.3.1. Random Forest
Random Forest is an ensemble learning method that constructs multiple decision trees and integrates them together for prediction. It was proposed by Leo Breiman and Adele Cutler in 2001 and is a powerful and widely used machine learning algorithm. It is based on a decision tree algorithm that splits based on the values of features, with each node representing a feature and each leaf node representing a category or value.
2.3.2. Multiple Linear Regression
Multiple linear regression is a commonly used predictive modeling technique in statistics and machine learning, used to establish a linear relationship between the independent variable (feature) and the dependent variable (target). It is an extension of simple linear regression, allowing the use of multiple independent variables in the model to predict the values of the dependent variable.
3. Results and Discussion
3.1. Data Processing
Firstly, six scatter plots between SalePrice and related variables should be drawn to more intuitively observe the relationship between SalePrice and related variables.
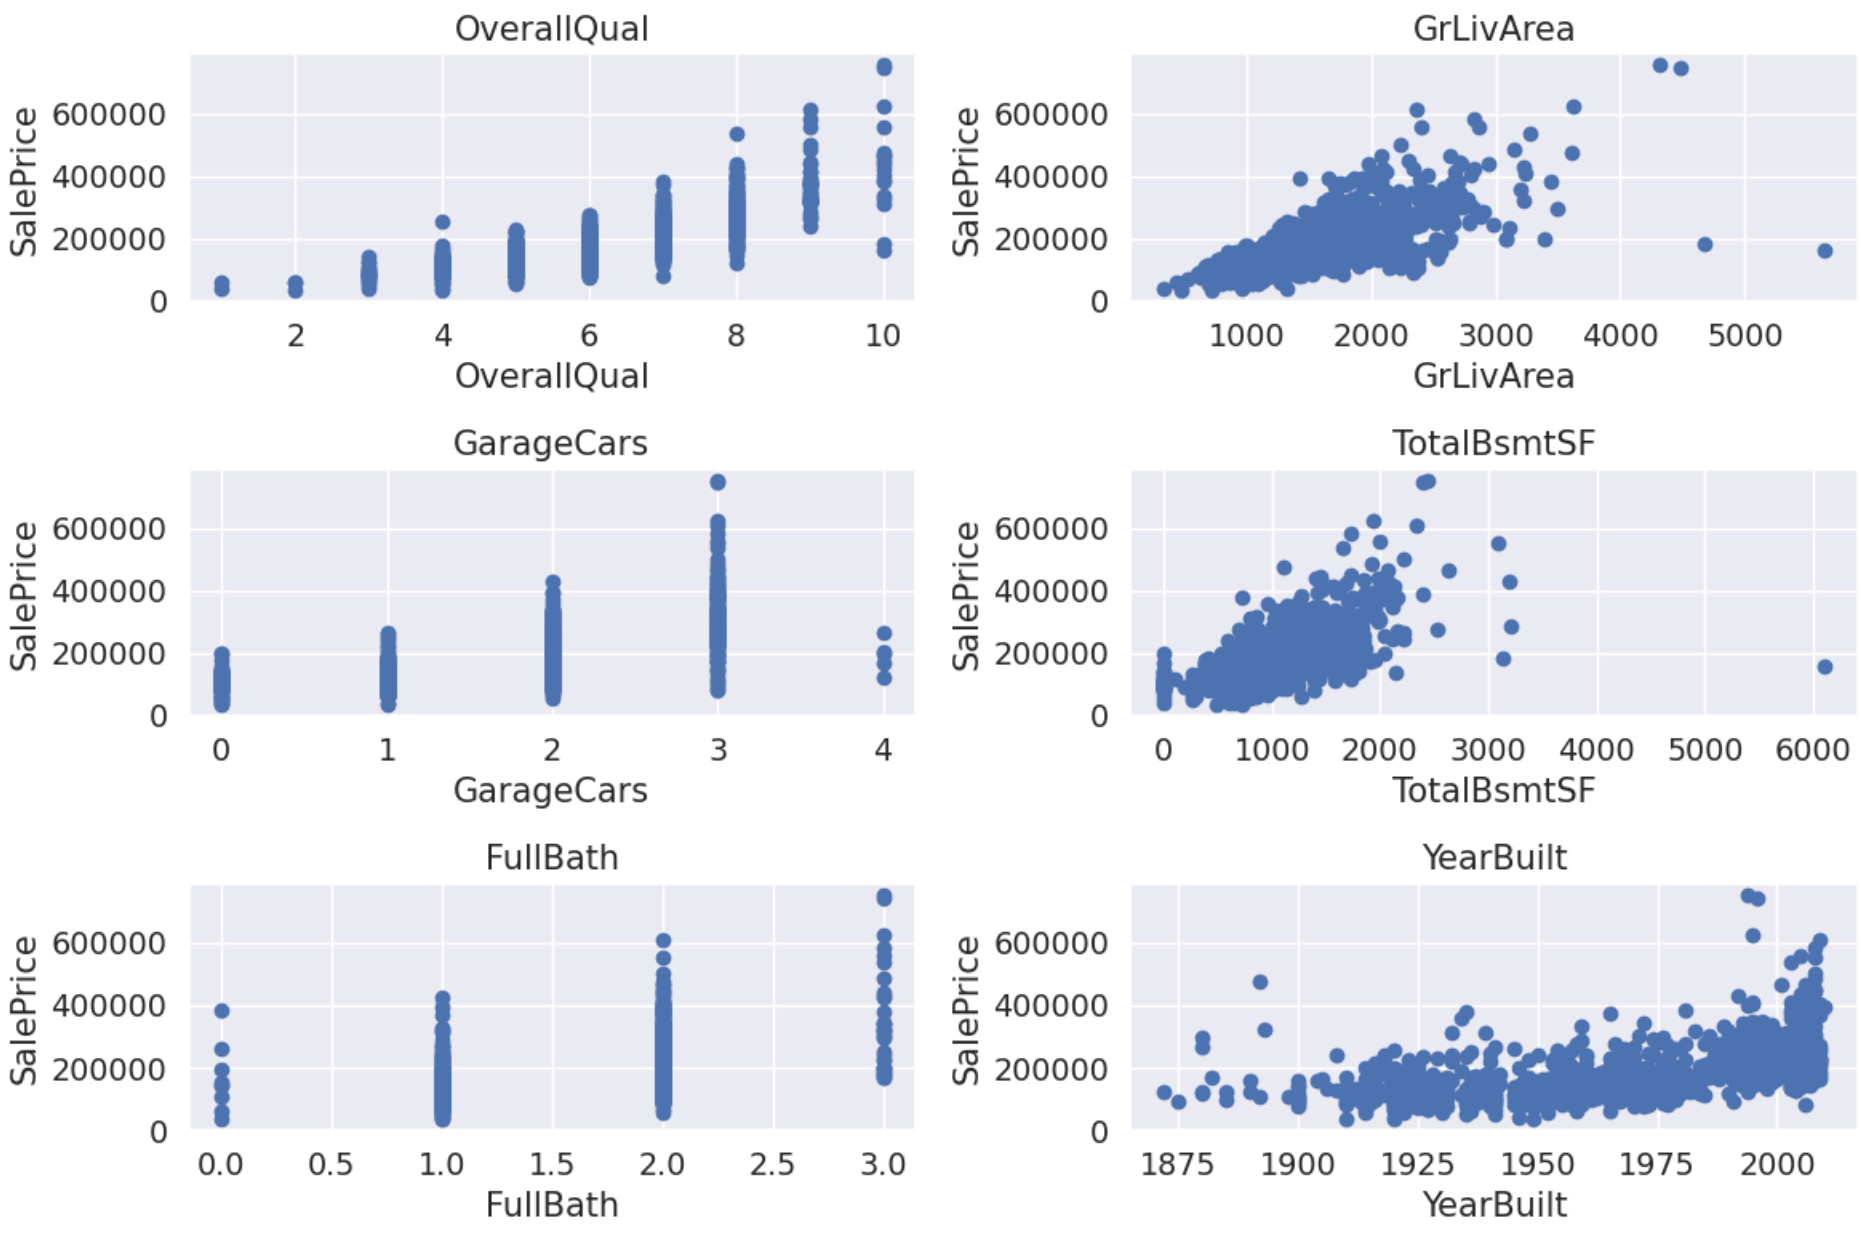
Figure 2: Scatter plots between SalePrice and related variables.
In Figure 2, the left side shows scatter plots of discrete variables, and the right side shows those of continuous variables. Overall, both discrete and continuous variables increase in price as the value of the variable increases. However, there are still exceptions in some variables, such as points with a numerical variable of 4 in GarageCars, points with a variable value greater than 6000 in TotalBsmtSF, and points with a value greater than 4000 and the SalesPrice less than 200000 in GrLivArea. For the first variable, there are many points that do not conform to the overall trend, so this part of the data will be kept unchanged. For the following two variables, as there are only one or two exceptions, these points will be removed. In addition to the above observations, the image relationship in the plot of GrLivArea and TotalBsmtSF is also worth exploring. As shown in Figure 1, there may be a strong linear relationship between GrLivArea and SalePrice, and the same situation exists between TotalBsmtSF and SalePrice.
Next, before applying multivariate statistical methods, the normality of the parameter should be checked. Normality, which means they should follow the normal distribution. Many classic statistical methods, such as t-tests and linear regression, are based on the assumption of normality in the data. If the data does not follow a normal distribution, these methods may lead to bias or inaccurate inference results. Thus, ensuring that the data conforms to the assumption of normal distribution helps to ensure the accuracy and reliability of these statistical inference methods. Although in general, univariate normality cannot guarantee multivariate normality, if a variable follows a normal distribution and there is a strong linear relationship with another variable, it can be inferred that the other variable may also follow a normal distribution. Therefore, in addition to detecting the normality of the target variable SalePrice, it is also worth paying attention to whether GrLivArea and TotalBsmtSF conform to a normal distribution.
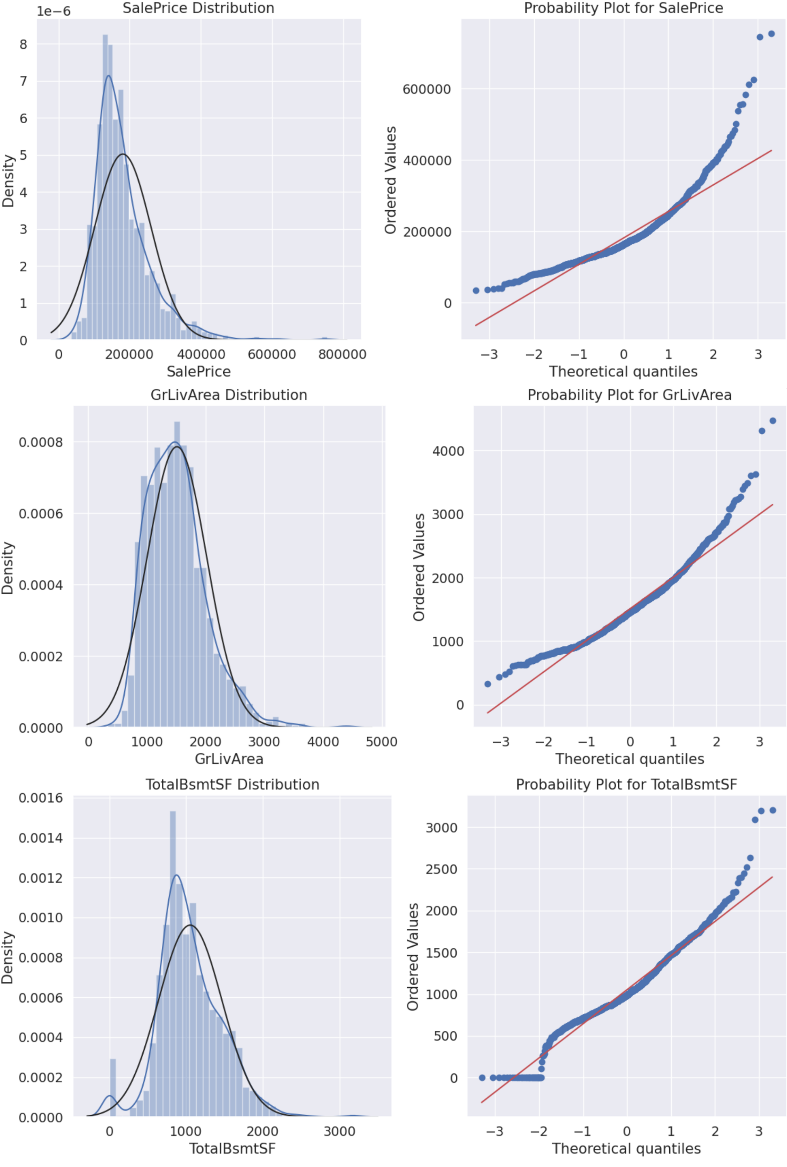
Figure 3: Distribution plot and probability plot.
Histograms and normal probability plots are used in the normality test. A histogram is a graph used to represent the distribution of data by dividing it into a series of continuous intervals (or boxes) and calculating the frequency or frequency of data within each interval to display the distribution of data. It can visually display the concentration trend, dispersion degree, and possible deviations and outliers of data. A normal probability plot is a graphical method used to test whether data conforms to a normal distribution, evaluating the normality of data by comparing its quantiles with those of a normal distribution. If the data points fall on a straight line, it indicates that the data fits the normal distribution well. If the data points deviate from the straight line, it may indicate a deviation in the data distribution.
In Figure 3, the left part is the distribution plot whose blue and black lines represent the actual distribution curve, fitted normal distribution curve respectively. And the right part is the normal probability plot with a red line as the diagonal line. In the left plot, all of them show the data distribution is olive shaped, which means there are fewer maximum and minimum values, with the majority being the middle value. The peaks of SalePrice and TotalBsmtSF far exceed the peaks of the fitted normal distribution curve. Besides, all three images show a positive skewness, with the tail of the data distribution extending longer on the right and relatively shorter on the left. This means that there are more larger values in the data, while the number of smaller values is smaller. From the right part of Figure 3, it is evident that none of the three sets of data follow a diagonal distribution. Among them, TotalBsmtSF is closest to the diagonal.
According to statistical knowledge, the application of logarithmic transformation can compress the differences in large values, thereby making the data closer to a normal distribution. However, for TotalBsmtSF, there are a few zero points in it and the number of them can not be ignored. It is not possible to perform logarithmic transformation on TotalBsmtSF. So only GrLivArea and SalePrice are taken logarithmic transformation. The following figure 4 is obtained.
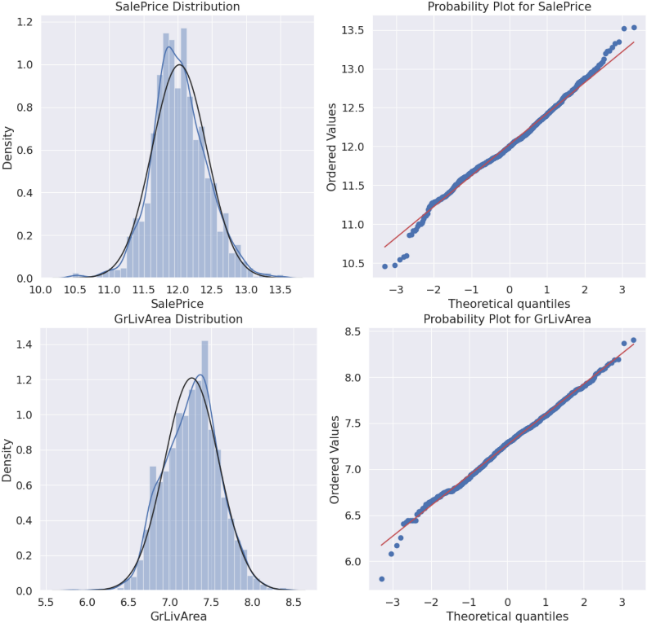
Figure 4: New distribution plots and probability plots of SalePrice and GrLivArea.
Based on the Figure 4, it can be seen that after logarithmic transformation, both data items follow a diagonal distribution, showing a good normal distribution effect.
3.2. Application of Two Models
Figure 5 shows the prediction of linear regression and random forest. Comparing their MSE values, it obviously shows that the result of the linear regression is better than that of the random forest.
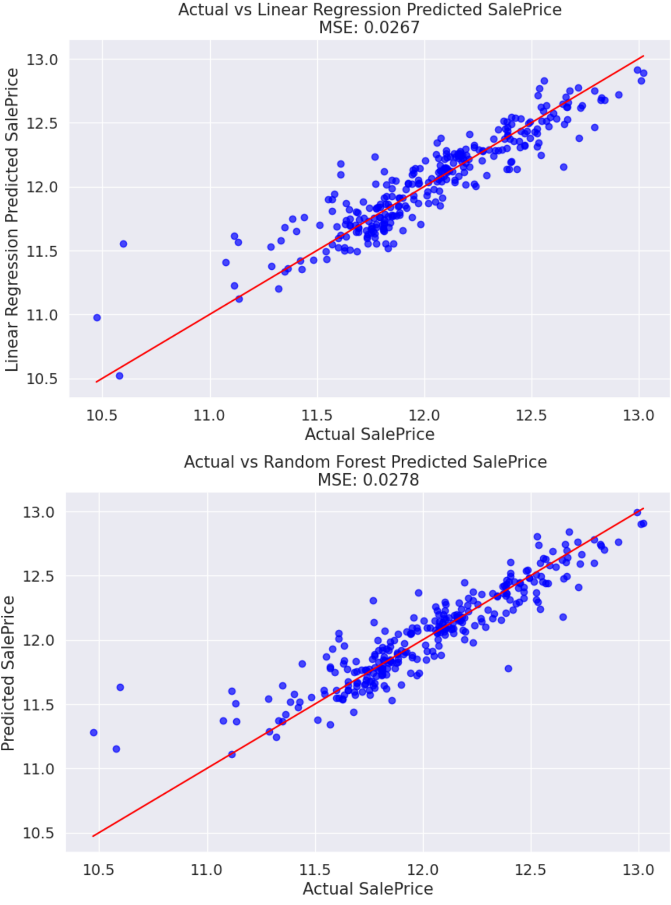
Figure 5: The results of linear regression and random forest.
One possible explanation is that when dealing with data with strong linear relationships, linear regression models have an advantage over random forest models. Table 2 shows the contributions of different features in the random forest model and linear regression model. In the random forest model, OverallQual has the highest importance, possibly because it ranks first in influencing prices and has a high correlation with other features (see Figure 1). Therefore, it can reflect the quality and characteristics of multiple aspects inside the house, and provide a lot of information gain. However, in linear regression models, GrLivArea has the highest coefficient. This is not only because GrLivArea is the second most influential variable on price, but also because linear regression models can more accurately capture the relationship between GrLivArea and target features, thereby improving its fitting performance. Therefore, when dealing with data with strong linear relationships, linear regression models have more advantages over random forest models.
Table 2: The importance of feature.
Feature | Importance in Random Forest | Importance in Linear Regression |
OverallQual | 0.558011 | 0.249955 |
GrLivArea | 0.176276 | 0.300731 |
GarageCars | 0.066961 | 0.112408 |
TotalBsmtSF | 0.124949 | 0.161237 |
FullBath | 0.006042 | -0.027251 |
YearBuilt | 0.067760 | 0.148418 |
4. Conclusion
The study selected 1460 samples from 2006 to 2010 from the data set, which has 6 variables. In the data processing stage, this article conducts normality tests on the target parameter SalePrice and the variables that have a strong linear relationship with it, GrLivArea and TotalBsmtSF, based on the normality assumption of linear regression. By performing logarithmic transformation on the data, the variables SalePrice and GrLivArea are closer to a normal distribution, thereby improving the predictive performance of the model. This indicates that data preprocessing has a significant impact on the accuracy and reliability of the model. In the model comparison stage, this article compared two common housing price prediction models, linear regression and random forest, and found that the linear regression model performed better than the random forest model in predicting housing prices. This may be because there is a strong linear relationship between housing prices and GrLivArea, and linear regression models can better capture this relationship.
With the research, model selection should be based on the characteristics of the data and the needs of the problem. Linear regression suits clear linear relationships, while random forests are better for complex data relationships. Although this study provides a preliminary exploration of the problem of predicting housing prices, there are also some shortcomings. In the study, the data processing is not comprehensive enough. Although logarithmic transformation was applied to some data in the study to satisfy the normality assumption, consistency was not applied to all variables. In practice, more data processing methods may be needed to cope with different types and distributions of data. To improve these shortcomings, more comprehensive variable selection and feature engineering processing are needed.
References
[1]. Kang, Y., Zhang, F., Peng, W., et al. (2021) Understanding house price appreciation using multi-source big geo-data and machine learning. Land Use Policy, 111, 104919.
[2]. Lancaster, K.J. (1966) A new approach to consumer theory. Journal of political economy, 74(2), 132-157.
[3]. Rosen, S. (1974) Hedonic prices and implicit markets: product differentiation in pure competition. Journal of political economy, 82(1), 34-55.
[4]. Truong, Q., Nguyen, M., Dang, H., et al. (2020) Housing price prediction via improved machine learning techniques. Procedia Computer Science, 174, 433-442.
[5]. Ghosalkar, N. N., Dhage, S. N. (2018) Real estate value prediction using linear regression. 2018 fourth international conference on computing communication control and automation (ICCUBEA). IEEE, 1-5.
[6]. Čeh, M., Kilibarda, M., Lisec, A., et al. (2018) Estimating the performance of random forest versus multiple regression for predicting prices of the apartments. ISPRS international journal of geo-information, 7(5), 168.
[7]. Hong, J., Choi, H., Kim, W. (2020) A house price valuation based on the random forest approach: The mass appraisal of residential property in South Korea. International Journal of Strategic Property Management.
[8]. Ho, W.K.O., Tang, B.S., Wong, S.W. (2021) Predicting property prices with machine learning algorithms. Journal of Property Research, 38(1), 48-70.
[9]. Pai, P.F., Wang, W.C. (2020) Using machine learning models and actual transaction data for predicting real estate prices. Applied Sciences, 10(17), 5832.
[10]. Phan, T.D. (2018) Housing price prediction using machine learning algorithms: The case of Melbourne city, Australia. 2018 International conference on machine learning and data engineering (iCMLDE). IEEE, 35-42.
Cite this article
Ren,K. (2024). House Price Prediction Based on Machine Learning Algorithms - Taking Ames as an Example. Advances in Economics, Management and Political Sciences,85,181-189.
Data availability
The datasets used and/or analyzed during the current study will be available from the authors upon reasonable request.
Disclaimer/Publisher's Note
The statements, opinions and data contained in all publications are solely those of the individual author(s) and contributor(s) and not of EWA Publishing and/or the editor(s). EWA Publishing and/or the editor(s) disclaim responsibility for any injury to people or property resulting from any ideas, methods, instructions or products referred to in the content.
About volume
Volume title: Proceedings of the 2nd International Conference on Management Research and Economic Development
© 2024 by the author(s). Licensee EWA Publishing, Oxford, UK. This article is an open access article distributed under the terms and
conditions of the Creative Commons Attribution (CC BY) license. Authors who
publish this series agree to the following terms:
1. Authors retain copyright and grant the series right of first publication with the work simultaneously licensed under a Creative Commons
Attribution License that allows others to share the work with an acknowledgment of the work's authorship and initial publication in this
series.
2. Authors are able to enter into separate, additional contractual arrangements for the non-exclusive distribution of the series's published
version of the work (e.g., post it to an institutional repository or publish it in a book), with an acknowledgment of its initial
publication in this series.
3. Authors are permitted and encouraged to post their work online (e.g., in institutional repositories or on their website) prior to and
during the submission process, as it can lead to productive exchanges, as well as earlier and greater citation of published work (See
Open access policy for details).
References
[1]. Kang, Y., Zhang, F., Peng, W., et al. (2021) Understanding house price appreciation using multi-source big geo-data and machine learning. Land Use Policy, 111, 104919.
[2]. Lancaster, K.J. (1966) A new approach to consumer theory. Journal of political economy, 74(2), 132-157.
[3]. Rosen, S. (1974) Hedonic prices and implicit markets: product differentiation in pure competition. Journal of political economy, 82(1), 34-55.
[4]. Truong, Q., Nguyen, M., Dang, H., et al. (2020) Housing price prediction via improved machine learning techniques. Procedia Computer Science, 174, 433-442.
[5]. Ghosalkar, N. N., Dhage, S. N. (2018) Real estate value prediction using linear regression. 2018 fourth international conference on computing communication control and automation (ICCUBEA). IEEE, 1-5.
[6]. Čeh, M., Kilibarda, M., Lisec, A., et al. (2018) Estimating the performance of random forest versus multiple regression for predicting prices of the apartments. ISPRS international journal of geo-information, 7(5), 168.
[7]. Hong, J., Choi, H., Kim, W. (2020) A house price valuation based on the random forest approach: The mass appraisal of residential property in South Korea. International Journal of Strategic Property Management.
[8]. Ho, W.K.O., Tang, B.S., Wong, S.W. (2021) Predicting property prices with machine learning algorithms. Journal of Property Research, 38(1), 48-70.
[9]. Pai, P.F., Wang, W.C. (2020) Using machine learning models and actual transaction data for predicting real estate prices. Applied Sciences, 10(17), 5832.
[10]. Phan, T.D. (2018) Housing price prediction using machine learning algorithms: The case of Melbourne city, Australia. 2018 International conference on machine learning and data engineering (iCMLDE). IEEE, 35-42.