


1. Introduction
Science and technology play an important role in the economy and profoundly impact economic development. Among them, the progress and innovation of science and technology play a key impact on economic growth [1]. For many leading technology companies, using stock data to understand the stock price increase caused by technological innovation is efficient. Similarly, as soon as the news about Apple's Vision Pro product in 2023 came out, it quickly triggered an increase in Apple's stock price. But whether the growth of stock prices can be predicted is a hot topic being discussed by many mathematicians and data scientists. Therefore, people are also constantly trying to integrate multiple academics for more effective research.
Time series forecasting makes calculations and processing of statistics more efficient than ever. As a result, this type of data analysis has been extended to many academic fields, especially finance and health care [2]. When predicting the epidemiological trend of COVID-2019, many scholars have used case data and Autoregressive Integrated Moving Average Model models in recent years to conduct research [3]. Likewise, stock prediction is also based on time series analysis. Research whether predicting stocks or epidemics is based on time series forecasting, so the Autoregressive Integrated Moving Average Model (ARIMA) is suitable for this type of analysis [4]. The ARIMA model is simple to use and stable. It is more suitable for processing relatively stable data with a certain linear relationship. In recent years, although some more models and methods are competent for the ARIMA model, its stability has met the needs of this article for stock prediction [5]. On the other hand, stock prediction itself needs to consider a large number of influencing factors, and individual stocks also establish many complex correlations with the securities market. The ARIMA model is efficient in making short-term predictions of financial data, such as stocks, without considering these complex factors. Many scholars in the field of finance also love it [6].
ARIMA is an excellent mathematical model, but stock prediction is a complex task. Predicting stock prices requires considering not only the complexity of the mathematical model but also various factors in real life and business [7]. Therefore, Stock prediction itself is also full of unknowns and challenges. Thus, the ARIMA model must have its drawbacks and flaws. As time goes by, the nonlinear trend and structure of stock data will only become more and more complex [8]. For such difficult situations, ARIMA cannot perform better. ARIMA cannot be separated from the updating of original data, which means that its long-term forecast is bad [9]. Technology is still constantly evolving and updating. Today's machine learning models and deep learning models can better understand and analyze complex data such as stocks [10]. However, based on the theme of this article, this type of improvement plan production statement, this article only discusses the process of analysis using ARIMA.
To sum up, stock prediction has always been a problem that attracts people's attention. People have also been trying to use better models and methods to make accurate predictions. This article will mainly use the ARIMA model to predict and analyze Apple stock and, based on the future, evaluate the prediction results and give reasonable suggestions.
2. Methods
2.1. Data Source
The data is from the closing price of Apple's stock in the United States in the past five years. The data is in U.S. dollars, and the data set starts on December 6, 2018, and ends on December 5, 2023.
2.2. Observation Data
Apple is a technology company that gets a lot of attention. The digital electronic products designed and sold by Apple are world-famous. Electronic product sales and software services create huge revenue for Apple. As a result, Apple's stock has shown a gradual upward trend, which has kept it at the leading level globally. However, technological innovation and other environmental factors will also cause Apple's market value to fluctuate. Therefore, before making any investment decision, investors must have a thorough understanding of the stock market. Figure 1 is a time series chart of Apple's stock closing price data from December 6, 2018, to December 5, 2023.
It can be seen from the time series chart that Apple's stock price in the past five years has generally shown a linear growth trend. The overall fluctuation range of the stock is not too large, and it is a relatively healthy stock curve. In the first half of 2023, Apple's stock growth rate is obvious; it is not difficult to think of the new product Vision Pro announced by Apple. Also, in 2020, Apple released its own processor chip, M1, causing its stock price to continue to soar. By analyzing the trends and data in charts, it is easy to observe the general trend and situation of Apple's stock price. Next, these data will be analyzed and processed in detail (Figure 1).
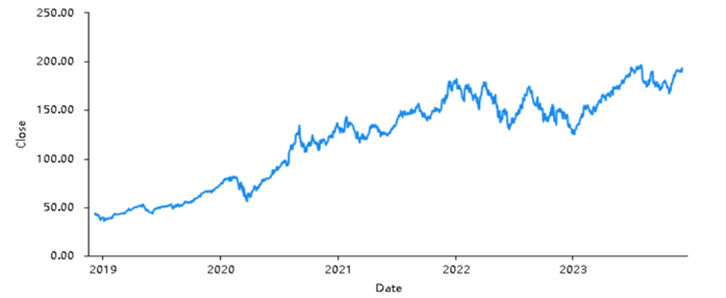
Figure 1: APPL closing price data.
2.3. Model Selection
The Apple stock data selected in this article has a time series. In the face of time-sequential data for stock price prediction, the ARIMA model can meet this situation well. ARIMA is an autoregressive moving average, which has three components: AR, I, and MA. First, autoregression (AR) uses the current value to establish a relationship with previously observed data and uses the linear combination of these two values to predict the future. In summary, an autoregressive model is built using previous observations. Second, by performing difference (I) processing on the observed values, the obvious trend or periodicity of the unbalanced data in the long term is reduced, making the data more stable. Stationary data makes building models and predictions easier. Finally, a moving average (MA) calculates the relationship between the current value and the calculated error term, using a weighted average of past observed values to predict future values.
The ARIMA model is more suitable for processing linear time series data. For the five-year closing price data of Apple used in this article, the overall trend of the stock is linear growth, but it cannot perfectly meet the linear requirement. Therefore, this article selects the best parameters of the model to make a simple prediction of Apple stock, trying to get the best results possible using the model.
3. Results and Discussion
3.1. Data Processing
ARIMA requires stable stock data to operate stably. First, analyze the data and use the ADF card to determine whether the data needs to be differentially processed to make it more stable. The results of the ADF analysis are shown in Table 1.
Table 1: Close-ADF Inspection form.
Differential order | t | p | Critical value (1%,5%,10%) | ||
0 | -0.998 | 0.754 | -3.436 | -2.864 | -2.568 |
1 | -36.867 | 0.000 | -3.436 | -2.864 | -2.568 |
Assume that the time series is non-stationary. After performing the first-order difference calculation based on this assumption, since the absolute value of the t statistic is much greater than the critical value at all significant levels, the p-value is also much smaller than the significance level. It shows that the hypothesis that the time series is stationary can be rejected.
To sum up, according to the results of ADF detection, it can be considered that when the difference order is 1, the time series is stationary. The following is the ACF chart and PACF chart of the reorganized data when the difference order is 1. As shown in Figure 2 and 3 below.
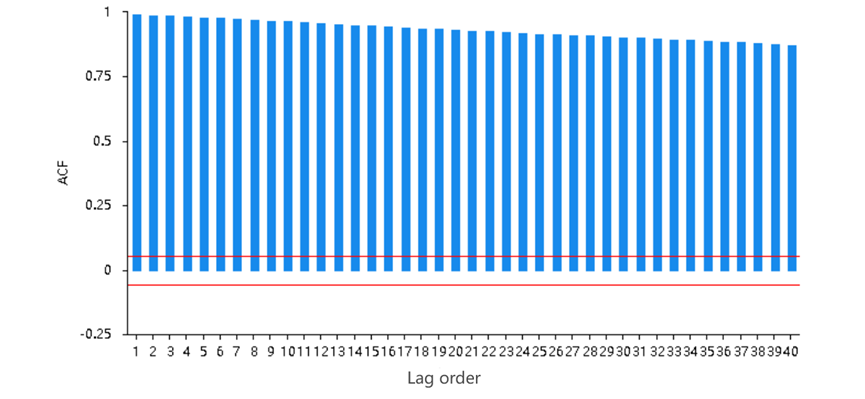
Figure 2: ACF Chart
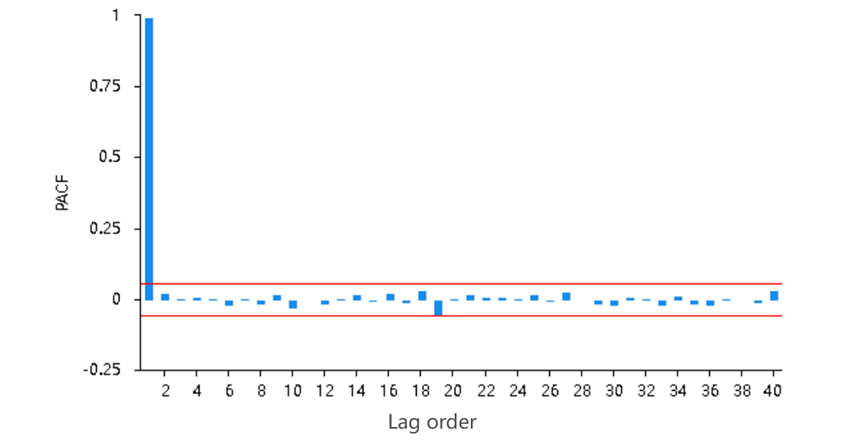
Figure 3: PACF Chart
The effect of the first-order difference is obvious, and this set of stock data becomes smoother. Stationary time series data is exactly what the ARIMA model requires. The fact that the autocorrelation in the ACF graph approaches 1 proves that the current data set has become stationary. This is also proved by the fact that the PACF values of other orders of the PACF diagram approach 0. These data have been processed as described above to meet the requirements of the ARIMA model, improving its fitting ability.
3.2. Model Fitting
An accurate model is a direct reflection of the predictive ability and directly affects the credibility of the results. In the field of stock prediction, slight improvements in the accuracy of prediction results can also bring huge benefits. During the model fitting process, this article simply selected several different RMSE and AIC parameter combinations for comparison. And find the best AR (p) and MA (q) data through comparison of multiple sets of data.
Table 2: Model evaluation
ARIMA | MSE | RMSE | AIC |
(0,1,0) | 5.7094 | 2.3894 | 5761.056 |
(1,1,0) | 5.6998 | 2.3874 | 5760.935 |
(1,1,1) (2,1,0) | 5.6953 5.6960 | 2.3865 2.3866 | 5761.952 5762.104 |
(2,1,1) | 5.6949 | 2.3864 | 5763.860 |
(3,1,1) | 5.6944 | 2.3863 | 5765.747 |
(3,1,0) | 5.6945 | 2.3863 | 5763.766 |
(3,1,2) | 5.6655 | 2.3802 | 5761.635 |
(4,1,0) | 5.6941 | 2.3862 | 5765.673 |
(4,1,1) | 5.6612 | 2.3793 | 5760.442 |
This article conducted a trade-off in model selection based on the data in Table 2. These data include the complexity of the model (reflected by AIC), the size of the prediction error (reflected by MSE and RMSE), and the degree of fit of the model. Ultimately, this article chose the (1, 1, 1) model because it has the best overall performance in AIC value, MSE, and RMSE, and the model complexity is relatively low.
3.3. Model Prediction
Based on the above data processing and analysis, this article uses ARIMA (1, 1, 1) to predict stock prices, as shown in the figure 4:
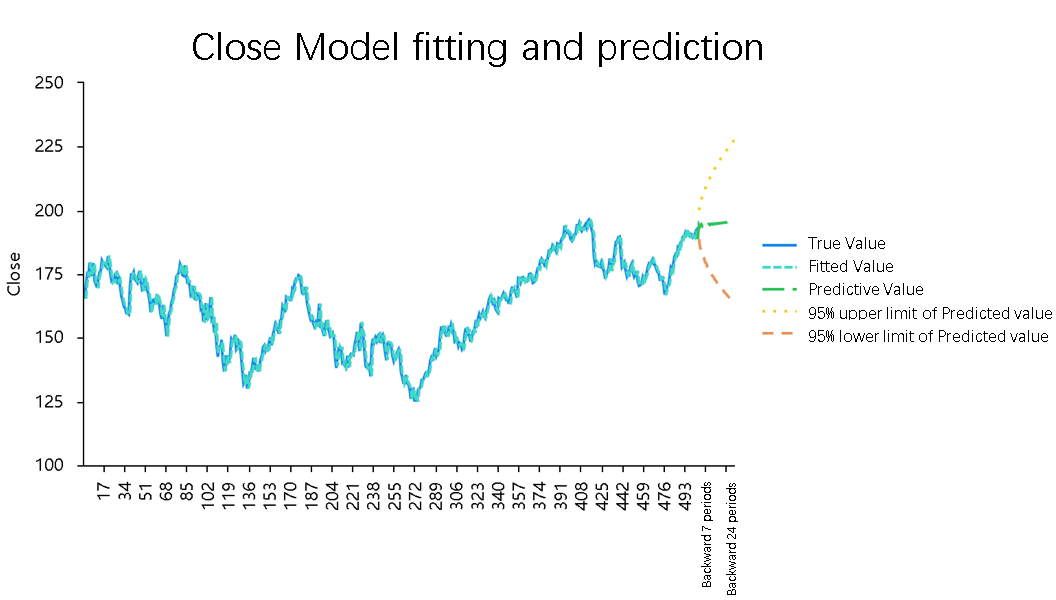
Figure 4: Close Model fitting and prediction.
Table 3: Predictive value (6 issues)
Predict | 1 | 2 | 3 | 4 | 5 | 6 | ||||||
Closing price | 194.472 | 193.629 | 194.501 | 193.822 | 194.546 | 194.000 |
The short-term forecast results are shown in the Table 3. The model predicts that Apple stock will show a slow growth trend over the next 30 days, increasing over time. The following describes the shortcomings of this model in prediction through different aspects. This article only predicts the closing price of Apple's stock over the next 30 days using this model. Due to space constraints, the predicted results are presented using data from Apple's stock close price over the past three years..
3.4. Discussion
The prediction results of the AIRIMA model are not that optimistic. Because when it leaves the support of data, all future predictions are based on a single increase or decrease in the model's own analysis results. Below are three points to illustrate the problems and bottlenecks encountered in using this model in this article.
First, the ARIMA model is a linear model, which assumes that the time series data are linearly related. However, most stock data exhibit non-linear relationships over time. This makes the ARIMA model unable to obtain stationary time series data and unable to capture all characteristics of the data. Second, the ARIMA model can introduce seasonal terms to handle the seasonal data of Apple stocks. But Apple's stock data has very complex seasonality. This requires more specialized model processing work to capture the complex seasonal changes in Apple stocks. Finally, ARIMA can only perform short-term predictions, and the results of ARIMA are not desirable for long-term data predictions because the ARIMA model is not very flexible. It cannot adapt well to the complex structure of data or non-linear relationships.
4. Conclusion
In summary, the ARIMA model can only predict the closing price of Apple stock in the short term. Due to the complexity of Apple's closing price data in the past five years, ARIMA cannot make accurate long-term forecasts for it alone. Although the ARIMA model has some limitations, it is also an efficient and practical tool in time series analysis.
In the future, competition in the technology industry will only become more intense. Artificial intelligence companies represented by OpenAI and Google are opening up new development directions on the technology track. The application of artificial intelligence in the market will become more common. The ARIMA model used in this article has many shortcomings. However, there is still significant room for improvement in future stock forecasts. With the continuous development of machine learning and artificial intelligence technology. There will be more advanced models that make stock prediction possible.
References
[1]. Chen, M. and Wang, H. (2022) Import technology sophistication and high-quality economic development: Evidence from city-level data of China. Economic research-Ekonomska istraživanja, 35(1), 1106-1141.
[2]. Kontopoulou, V. I., Panagopoulos, A. D., Kakkos, I. and Matsopoulos, G. K. (2023) A review of ARIMA vs. machine learning approaches for time series forecasting in data-driven networks. Future Internet, 15(8), 255.
[3]. Benvenuto, D., Giovanetti, M., Vassallo, L., Angeletti, S. and Ciccozzi, M. (2020) Application of the ARIMA model on the COVID-2019 epidemic dataset. Data in brief, 29, 105340.
[4]. Khan, S. and Alghulaiakh, H. (2020) ARIMA model for accurate time series stock forecasting. International Journal of Advanced Computer Science and Applications, 11(7).
[5]. Elsaraiti, M. and Merabet, A. (2021) A comparative analysis of the ARIMA and LSTM predictive models and their effectiveness for predicting wind speed. Energies, 14(20), 6782.
[6]. Khanderwal, S. and Mohanty, D. (2021) Stock price prediction using ARIMA model. International Journal of Marketing & Human Resource Research, 2(2), 98-107.
[7]. Kobiela, D., Krefta, D., Król, W. and Weichbroth, P. (2022) ARIMA vs LSTM on NASDAQ stock exchange data. Procedia Computer Science, 207, 3836-3845.
[8]. Mahadik, A., Vaghela, D. and Mhaisgawali, A. (2021) Stock price prediction using lstm and arima. In 2021 Second International Conference on Electronics and Sustainable Communication Systems (ICESC), IEEE, 1594-1601.
[9]. Meher, B. K., Hawaldar, I. T., Spulbar, C. M. and Birau, F. R. (2021) Forecasting stock market prices using mixed ARIMA model: A case study of Indian pharmaceutical companies. Investment Management and Financial Innovations, 18(1), 42-54.
[10]. Ma, Q. (2020) Comparison of ARIMA, ANN and LSTM for stock price prediction. In E3S Web of Conferences. EDP Sciences, 218, 1026.
Cite this article
Xia,Z. (2024). Research on AAPL Stock Price Prediction Using ARIMA Model. Advances in Economics, Management and Political Sciences,88,151-157.
Data availability
The datasets used and/or analyzed during the current study will be available from the authors upon reasonable request.
Disclaimer/Publisher's Note
The statements, opinions and data contained in all publications are solely those of the individual author(s) and contributor(s) and not of EWA Publishing and/or the editor(s). EWA Publishing and/or the editor(s) disclaim responsibility for any injury to people or property resulting from any ideas, methods, instructions or products referred to in the content.
About volume
Volume title: Proceedings of the 2nd International Conference on Management Research and Economic Development
© 2024 by the author(s). Licensee EWA Publishing, Oxford, UK. This article is an open access article distributed under the terms and
conditions of the Creative Commons Attribution (CC BY) license. Authors who
publish this series agree to the following terms:
1. Authors retain copyright and grant the series right of first publication with the work simultaneously licensed under a Creative Commons
Attribution License that allows others to share the work with an acknowledgment of the work's authorship and initial publication in this
series.
2. Authors are able to enter into separate, additional contractual arrangements for the non-exclusive distribution of the series's published
version of the work (e.g., post it to an institutional repository or publish it in a book), with an acknowledgment of its initial
publication in this series.
3. Authors are permitted and encouraged to post their work online (e.g., in institutional repositories or on their website) prior to and
during the submission process, as it can lead to productive exchanges, as well as earlier and greater citation of published work (See
Open access policy for details).
References
[1]. Chen, M. and Wang, H. (2022) Import technology sophistication and high-quality economic development: Evidence from city-level data of China. Economic research-Ekonomska istraživanja, 35(1), 1106-1141.
[2]. Kontopoulou, V. I., Panagopoulos, A. D., Kakkos, I. and Matsopoulos, G. K. (2023) A review of ARIMA vs. machine learning approaches for time series forecasting in data-driven networks. Future Internet, 15(8), 255.
[3]. Benvenuto, D., Giovanetti, M., Vassallo, L., Angeletti, S. and Ciccozzi, M. (2020) Application of the ARIMA model on the COVID-2019 epidemic dataset. Data in brief, 29, 105340.
[4]. Khan, S. and Alghulaiakh, H. (2020) ARIMA model for accurate time series stock forecasting. International Journal of Advanced Computer Science and Applications, 11(7).
[5]. Elsaraiti, M. and Merabet, A. (2021) A comparative analysis of the ARIMA and LSTM predictive models and their effectiveness for predicting wind speed. Energies, 14(20), 6782.
[6]. Khanderwal, S. and Mohanty, D. (2021) Stock price prediction using ARIMA model. International Journal of Marketing & Human Resource Research, 2(2), 98-107.
[7]. Kobiela, D., Krefta, D., Król, W. and Weichbroth, P. (2022) ARIMA vs LSTM on NASDAQ stock exchange data. Procedia Computer Science, 207, 3836-3845.
[8]. Mahadik, A., Vaghela, D. and Mhaisgawali, A. (2021) Stock price prediction using lstm and arima. In 2021 Second International Conference on Electronics and Sustainable Communication Systems (ICESC), IEEE, 1594-1601.
[9]. Meher, B. K., Hawaldar, I. T., Spulbar, C. M. and Birau, F. R. (2021) Forecasting stock market prices using mixed ARIMA model: A case study of Indian pharmaceutical companies. Investment Management and Financial Innovations, 18(1), 42-54.
[10]. Ma, Q. (2020) Comparison of ARIMA, ANN and LSTM for stock price prediction. In E3S Web of Conferences. EDP Sciences, 218, 1026.