


1. Introduction
Nowadays, companies are increasingly leveraging data analysis techniques to gain insights into customer behavior and preferences. As a result, different programming languages have been used by analysts in enterprises, including Python, R, SPSS and so on. Based on previous researches, reliability and validity, ANOVA, Chi Square are some of the most often tools. Whereas, data has not been converted to useful information as finely as the way it’s processed to another form of data. Therefore, by presenting a few linear regression analyses conducted for Talent Games (TG), a company seeking to identify the five best video game players to feature in a series of commercials and to uncover valuable tendencies related to customer traits, this paper applies conclusions from psychology and sociology to numerous users of TG online. The database of player data, including gaming habits, demographics, and other relevant metrics is given [1]. Moreover, this paper delves into the findings and implications of the linear regression models presented in the report, shedding light on the potential applications for recognizing customers’ traits in the context of companies’ marketing. Furthermore, the research aims not only to reveal patterns and correlations that can guide business decisions, but also to discuss on the paradox of the notions and norms of distinct subjects, where the data skewnesses are thought in different ways. In addition, for elaboration purposes, the problems are pointed out through both a data analyst’s and a psychologist’s view at the end of each regression.
2. Related Work
The combination of business data analysis and theories emphasizing mass media and communication is not a new direction but has not been paid lots of attention to for some time. In 2009, Steven G. Rogelberg pointed out in “Journal of Business and Psychology: A New Direction” this new field [2]. “A Cognitive Interpretation of Data Analysis” published in 2014 argued that data analysis tasks closely resemble the cognitive process known as sense-making [3]. Milan Zafirovski also brings up the concept of “economic sociology” in his book named as the same in 2018 [4], in which he applied a sociological method to analyzing economic actors, activities, processes, and outcomes, in particular business enterprises and markets. Methodologically, this paper referred to some of the papers that elaborate on the challenge of big data in social research, such as the work of Rainer Diaz-Bone, Kenneth Horvath and Valeska Cappel, “Social Research in Times of Big Data” [5] and “Social Research Methods” [6], the work of Alan Bryman and Edward Bell, whose insights of quantitative methods shed some light on my work followed.
3. Methodology
The information on the database mentioned in this paper is given in the link [1], with its codebook affiliated. Single regression and multivariate regressions are conducted in the experiments elaborated below, also R Studio delivered the coordinate positions of numerous points and formed into a few scatter diagrams——each represents a behavior of a customer, so quantitative examination especially linear regression coupled with visualization is the main method.
SLC (Single Linear Regression) is designed to gain insight into how intense the two factors are correlated, usually used to verify some common knowledge in the experiment. MLR (Multiple Linear Regression) entails the simultaneous analysis of three or more variables, or is to determine how much of the variation in the dependent variable is to determine how much of the variation in the dependent variable is explained or predicted by the independent variables. For example, As is illustrated in the “Beer and Nappies Effect” and the Apriori algorithm, some habits affect the whole experience, which could be transformed to business intelligence through data analysis in a large number of times, because the difficulty is to find the strongest “x” behind the “y”. It could be concluded that the competing tensions of quantitative methods and explanations by mass media and communication characterize what data analysts will face in the future challenges, as so it is vital to form an organizing model that strikes a balance between ration and sense-making for data analysts. These insights from this kind of model could be significantly helpful for those who work as consultants, statisticians and the teacher of them.
4. Regressions
4.1. Regression 1
Firstly, it was hoped to grasp the correlation between the elements of each group as a whole and venture a guess as to the hidden reasons. So after checking each pair of group, the finding begins with introducing the first single linear regression analysis, which examines the correlation between players’ self-assessment of their performance (best) and their actual performance in terms of total wins (totalwins).
> lm(best~totalwins)
Call:
lm(formula = best ~ totalwins)
Coefficients:
(Intercept) totalwins
4.036717 -0.001378
And here’s the formulation given by R:
cor(best,totalwins)
[1] -0.03040852
>lm(formula = best ~ totalwins)
best = -0.001378X+4.036717
The correlation coefficient of -0.03040852 indicates a very weak correlation between these variables. Furthermore, the negative slope of the regression line suggests that as totalwins increase, players' self-assessment of their performance decreases. This finding implies that players tend to overestimate their performance, particularly after transitioning from the novice stage. The report suggests that this psychological phenomenon could be leveraged by TG to provide customized feedback or awards tailored to different player groups. For example, the report proposes keeping moderately skilled players overconfident while ensuring that they experience losses, which could extend their engagement with the games.
The conclusion leads to a further speculation that could be psychologically explained. According to the depiction of Figure 1, there are 3 kinds of states of mind. Those who get 0 - 150 totalwins are “noobs”. They’re still learning so it’s common to score low. Most players score themselves between 150 - 200 get a little achievement and they’ll feel full of themselves, getting conceited. For the true veterans that score above 200, they just keep low because they know there’s always someone that’s better. It’s interesting that normal distribution exists everywhere like the curve in 1-2 shows, even in the way people deliver an internal self-assessment on games and the internal assessments form into an external characterization of a typical pattern.
Despite the low correlation scores mentioned earlier, these two variables actually presented stronger correlation scores than two other random variables when the variables were selected. It should be noticed that data in reality is not always ideal, so experimentally high correlation coefficients cannot be obtained with this data set. It is the comparison with other groups that appears more cogent.
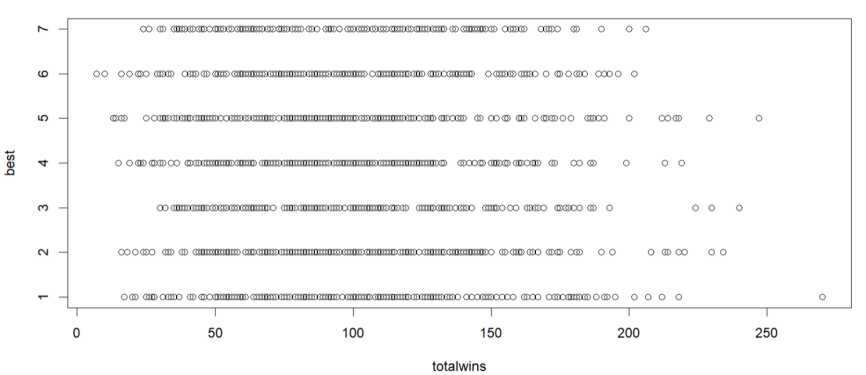
Figure 1: Scatter Plot of “Best” and “Totalwins”
4.2. Regression 2
The second regression analysis explores the relationship between the number of hours played per week (hoursweek) and players’ age. The scatterplot in Figure 2 provides a clearer picture of the distribution of player choices.
Call:
lm(formula = hoursweek ~ age)
Coefficients:
(Intercept) age
90.9323 0.1139
> lm(hoursweek~age)
> hoursweek = 0.1139X+90.9323
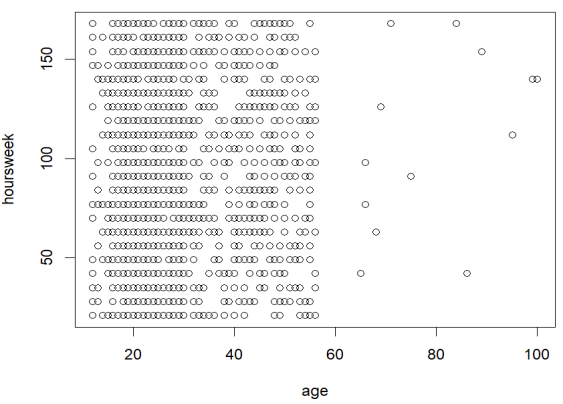
Figure 2: Scatter Plot of “Hoursweek” and “Age”
The positive coefficient of 0.1139 indicates that age has a significant impact on the amount of time players spend on gaming. The analysis categorizes players into three groups: teenagers, adults, and the elderly. It highlights the potential market dominance of teenagers, the presence of dedicated adult players, and the untapped potential of the elderly demographic. The report suggests that TG could capitalize on the elderly demographic by developing and promoting games tailored to their preferences, considering their ample resources and leisure time.
While from a sociological perspective, the phenomenon of a significant age gap in game players, particularly in the older age group, while the market predominantly focuses on teenagers and adults around 30, can be analyzed through various factors. Companies may assume a few reasons to slow the march into older generations, for example, lower access to and familiarity with technology, stereotypes associated with aging can bring a decline in physical abilities and conservative marketing strategies. As a result, the youth market is often perceived as more profitable due to their higher disposable income and greater inclination towards novelty and trends. However, the chance of innovation in business strategies always lies in groups excluded from the predominant target groups. That is to say, data analysts should rebuild a mindset that doesn’t always follow how predecessors draw conclusions to a processed dataset and contribute to a more inclusive and diverse users’ community. The problem is that people believe they collect useful information but are merely innovating on data analysis instead of on the value behind data, which is what is called “inertia” in work.
4.3. Regression 3
The third regression study uses a multiple linear regression model to analyze the impact of some selected independent variables on the number of games purchased by consumers (totalgames), as shown in Figure 3.
> lm( totalgames ~ yearjoin + like + passion + popcom + tgwell)
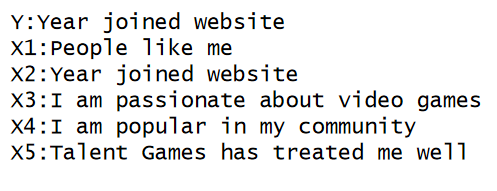
Figure 3: Selected in Dependent Variables
As the model shows, we’ve got an equation: totalgames = -0.33X1 + 0.10X2 + 0.50X3 + 0.24X4 + 1.39X5. After tries and adjustments, the independent variables that have the largest impact on the dependent variable are identified. Coefficients of the model reveal how variables such as customers’ love and passion for games, the company's ability to foster customer loyalty, the year of joining the gaming community, and the overall well-being of customers vary in the degree of influence on game purchases. The linear relation equation outlines the significance of customers’ love and passion for games the most direct driver of purchases. It also recommends that TG should focus on enhancing customer satisfaction, community engagement, and brand advocacy to increase game purchases.
The MLR (multilinear regression) method actually recalls a famous ethological and psychological theory, the beer and nappies effect, with solid numbers. This effect depicts a move of anti-intuition correlation of two products given by intuition. The theory derives from a story where a man tends to buy a bottle of beer after purchasing diapers so that markets could raise their profits by putting these two products adjacently. Likewise, during the regressions it is found out that the model is more credible when an MLR is applied than the situations where each “x” and “y” are correlated. Thus, there is an intrinsic correlation between the events stated by the independent variables, which has hardly been suggested in previous research on topics related to human ethics.
4.4. Regression 4
The last regression analysis introduces a multiple linear regression model to determine the factors influencing the selection of spokespeople for the company’s commercials. As is shown in the equation below as well as in Figure 4, the model incorporates variables related to player performance, community engagement, and demographic characteristics. The coefficients provide insights into the considerations for selecting pokes people, including their performance, experiences, community reputation, and inclusivity. The report emphasizes the importance of considering candidates' reputation in the gaming community, acknowledging top performers, promoting diversity, and ensuring political correctness in the selection process and answers the request of the company, which is to choose the five most representative candidates to be invited to a party held by TG. Eventually, five candidates are selected, with their detailed information shown on the Table 1 below.
> lm(formula = recm ~ totalwins + totalgames + yearjoin + genadv + ethadv + age )
The equation R gives: recm = 0.24X1 + 0.03totalgames - 0.62yearjoin -6.23genadv -1.86ethadv -0.57age
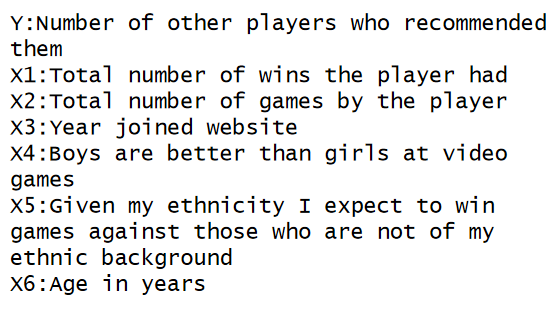
Figure 4: Model Incorporates Variables
Table 1: Detailed Information of Five Candidates
Player | Logins | hours day | hours week | total wins | total games | recmd | genadv | ethadv | passion | tg love | Ethnicity | Gender | Age |
792 | 32 | 13 | 91 | 114 | 229 | 999 | 1 | 1 | 7 | 2 | 5 | 1 | 25 |
857 | 23 | 22 | 154 | 52 | 173 | 976 | 1 | 3 | 7 | 5 | 2 | 2 | 21 |
704 | 19 | 7 | 49 | 180 | 298 | 994 | 4 | 1 | 2 | 4 | 4 | 2 | 48 |
426 | 21 | 9 | 63 | 74 | 189 | 982 | 1 | 1 | 7 | 4 | 1 | 1 | 18 |
1323 | 83 | 20 | 140 | 144 | 234 | 975 | 3 | 1 | 6 | 4 | 2 | 3 | 27 |
Overall, the report's findings underscore the potential of linear regression models using R to recognize customers' traits and inform strategic business decisions. By leveraging these models, TG can gain a deeper understanding of its customer base, tailor marketing strategies to different player groups, and optimize the selection of spokespeople for promotional activities. The insights derived from the regression analyses provide valuable guidance for enhancing customer engagement, driving game sales, and fostering a vibrant gaming community.
5. Reflections and Progressions
The deficiency lies in the p-value of the regressions as the behavior of samples in reality is quite random and lacks a larger-sized sample. P-value tells the credibility of a model, it might be lower if researchers try other means such as a t-test in further analysis or preprocess the raw data with a few data cleaning methods. On the other hand, the defective data may be different from a psychologist’s, a sociologist’s, or an ethologist’s point of view because new interdisciplinary ideas are proposed precisely in the defective data models where there is a plurality of thoughts and choices. For example, when p-values are less than perfect, correlations of independent values are proposed, which may be what affects p-values. In brief, interdisciplinary thinking encourages the breakdown of boundaries to help reach new cognitive level.
6. Conclusion
The research demonstrates that using the linear regression models with R presents significant opportunities for companies like TG to recognize and leverage customers' traits in the context of video game marketing. Through the analysis of extensive datasets, the paper has uncovered underlying patterns and trends in customer behavior, providing valuable insights for companies to formulate precise marketing strategies and informed business decisions. In particular, the analysis of skewness, distributions, and lope levels has yielded important insights for understanding customer needs, enhancing product design, and refining services. Therefore, it is recommended that companies continue to embrace data mining and analytical techniques in their future marketing and business operations. Doing so will not only enhance customer satisfaction and drive sales growth but also establish a competitive advantage within the dynamic gaming industry. These efforts are essential for companies seeking to effectively navigate market challenges and achieve sustainable growth.
References
[1]. TG Game Database. https://kdocs.cn/l/ckrIt2PZf3U1 (TG Game Codebook: https://kdocs.cn/l/ciZYbMIj1cVe)
[2]. Rogelberg, Steven G. “Journal of Business and Psychology: A New Direction.” Journal of Business and Psychology, vol. 24, no. 1, 2009, pp. 1–3.
[3]. Grolemund, Garrett, and Hadley Wickham. “A Cognitive Interpretation of Data Analysis.” International Statistical Review / Revue Internationale de Statistique, vol. 82, no. 2, 2014, pp. 184–204.
[4]. Milan Zafirovski: Economic Sociology, Routledge, 22 October 2018
[5]. Diaz-Bone, Rainer, et al. “Social Research in Times of Big Data. The Challenges of New Data Worlds and the Need for a Sociology of Social Research.” Historical Social Research / Historische Sozialforschung, vol. 45, no. 3, 2020, pp. 314–41.
[6]. Alan Bryman,Edward Bell: Social Research Methods, Oxford University Press
Cite this article
Zhang,Z. (2024). A Sociological Try of Linear Regression with R to Recognize Customers’ Traits. Advances in Economics, Management and Political Sciences,91,21-26.
Data availability
The datasets used and/or analyzed during the current study will be available from the authors upon reasonable request.
Disclaimer/Publisher's Note
The statements, opinions and data contained in all publications are solely those of the individual author(s) and contributor(s) and not of EWA Publishing and/or the editor(s). EWA Publishing and/or the editor(s) disclaim responsibility for any injury to people or property resulting from any ideas, methods, instructions or products referred to in the content.
About volume
Volume title: Proceedings of the 2nd International Conference on Management Research and Economic Development
© 2024 by the author(s). Licensee EWA Publishing, Oxford, UK. This article is an open access article distributed under the terms and
conditions of the Creative Commons Attribution (CC BY) license. Authors who
publish this series agree to the following terms:
1. Authors retain copyright and grant the series right of first publication with the work simultaneously licensed under a Creative Commons
Attribution License that allows others to share the work with an acknowledgment of the work's authorship and initial publication in this
series.
2. Authors are able to enter into separate, additional contractual arrangements for the non-exclusive distribution of the series's published
version of the work (e.g., post it to an institutional repository or publish it in a book), with an acknowledgment of its initial
publication in this series.
3. Authors are permitted and encouraged to post their work online (e.g., in institutional repositories or on their website) prior to and
during the submission process, as it can lead to productive exchanges, as well as earlier and greater citation of published work (See
Open access policy for details).
References
[1]. TG Game Database. https://kdocs.cn/l/ckrIt2PZf3U1 (TG Game Codebook: https://kdocs.cn/l/ciZYbMIj1cVe)
[2]. Rogelberg, Steven G. “Journal of Business and Psychology: A New Direction.” Journal of Business and Psychology, vol. 24, no. 1, 2009, pp. 1–3.
[3]. Grolemund, Garrett, and Hadley Wickham. “A Cognitive Interpretation of Data Analysis.” International Statistical Review / Revue Internationale de Statistique, vol. 82, no. 2, 2014, pp. 184–204.
[4]. Milan Zafirovski: Economic Sociology, Routledge, 22 October 2018
[5]. Diaz-Bone, Rainer, et al. “Social Research in Times of Big Data. The Challenges of New Data Worlds and the Need for a Sociology of Social Research.” Historical Social Research / Historische Sozialforschung, vol. 45, no. 3, 2020, pp. 314–41.
[6]. Alan Bryman,Edward Bell: Social Research Methods, Oxford University Press