


1. Introduction
Amid the rapid globalization of economies, the role of currencies transcends beyond mere mediums of exchange, evolving into pivotal instruments reflecting a country's economic health and its global financial integration. Today's China is one of the world's largest economies and foreign trade body, with the further rapid development of China's economy and the gradual liberalization of foreign financial controls, China's growing importance in the global economy and financial system, the yuan has been widely used in trade in China with neighboring countries, and the rise of China's economy and influence, more inspired people thinking about the possibility of the internationalization of the RMB [1]. Hong Kong's trading market, not only serves as a vital link for RMB's global usage expansion but also as a vibrant laboratory for studying the currency's international dynamics [2].
By charting this unexplored territory, the research not only contributes to the academic discourse on currency globalization but also offers practical insights for navigating the complexities of international finance. It underscores the critical importance of understanding market dynamics, liquidity, volatility, and the impact of China's financial policies, crucial for predicting future exchange rates and for navigating the RMB's path towards becoming a formidable global currency.
The primary objective of this study is to compare the efficiency and accuracy of future exchange rate predictions between the CNY Non-Deliverable Forward (NDF) market and its deliverable counterpart, the onshore CNY market. By substituting the onshore CNY with the offshore CNH, the research further extends to contrast the onshore and offshore markets. This approach aims to dissect the variations in forecast accuracy and efficiency between these distinct markets and examine the robustness of the unbiasedness hypothesis across them. The investigation seeks to determine whether the differing contract types—NDFs, onshore deliverables (CNY), and offshore deliverables (CNH)—offer consistent or divergent projections regarding the yuan's future valuation.
To achieve these goals, the study meticulously analyzes previously collected trading data within the Hong Kong market, focusing on 1-month, 3-month, and 6-month maturities for both the offshore non-deliverable forwards and the corresponding deliverable contracts. By examining these segments, the research endeavors to assess the market efficiency and the precision of factual predictions made by each market type. Through this comprehensive comparison, the paper aims to shed light on the effectiveness of the onshore and offshore yuan markets in forecasting future exchange rates, providing insights into the underlying dynamics that govern their performance.
2. Methodology
2.1. Data Collection
The statistical data compiled consist of the prices of the contract's maturity and actual foreign exchange rates at these exact periods. The research also obtain historical exchange rate data for the RMB, which has just been labeled the Hong Kong market exchange rate. To portray this, the transaction statistics in January 2024 were 74,725, compared to December 2023, where 67,192 transactions were noted, which signifies the market activity and the possible shift in the exchange rate prediction. With this novel data, the paper also examines the rate trend to determine how long the rate was valid and if the par value was exchanged against the real current exchange rate as expected.
2.2. Analysis of Markets
Analysis of Markets focus on the depth of transaction volumes and liquidity of CNH and CNY NDF markets. Take, for example, the numbers of July 2023, where only 42,757 transactions were conducted, compared to the inflated ones of June with 17,158 transactions , which may be a sign of some volatility in the market. Thus, according to figure 1, recognizing increases and decreases in volatility and the connection of such disturbances to external events will help to understand the market dynamics and the influence of these factors such as transaction volumes,market liquidity and external events on RMB value.
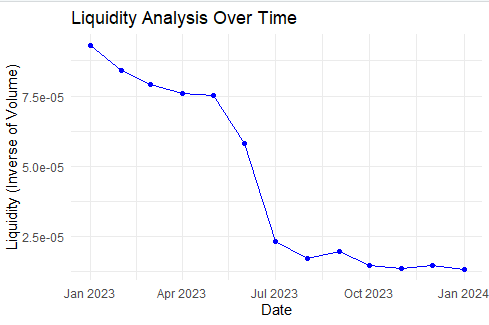
Figure 1: Temporal Liquidity Trend: Inverse Volume Analysis
2.2.1. Comparative Analysis of Markets
The choice between one deliverable market and another will be about the degree to which bonds from these two markets vary based on the reading materials found on each. In the first scenario,where there is a considerable divergence in bond prices between the onshore (CNY) and offshore (CNH) markets, analysis will concentrate on the market with the larger variations as they provide more significant insights for evaluating prediction accuracy. These substantial deviations are crucial for our study as they reflect differing market conditions and investor behaviors. Conversely, in the second scenario,when the discrepancy in bond prices between the two markets is marginal, the analysis will utilize both markets interchangeably to validate the consistency of the results across similar market conditions.
Table1: Market Rates Fluctuation Summary: Periodic Minimum, Maximum, and Range Analysis
Market Interaction and Impact Analysis | |||
Period | Minimum Rate | Maximum Rate | Range |
2013-07-05 to 2013-08-22 | 6.2007 | 6.2028 | 0.0021 |
2011-09-11 to 2011-10-22 | 6.3712 | 6.3858 | 0.0146 |
2010-09-24 to 2010-09-30 | 6.7905 | 6.7989 | 0.0084 |
2010-06-28 to 2010-07-06 | 6.8198 | 6.8230 | 0.0032 |
2009-07-14 to 2009-07-27 | 6.8312 | 6.8314 | 0.0002 |
2011-12-07 to 2012-01-16 | 6.3610 | 6.4326 | 0.0716 |
2013-11-12 to 2013-12-27 | 6.1334 | 6.1619 | 0.0285 |
2009-01-19 to 2009-02-05 | 6.8974 | 7.0455 | 0.1481 |
2012-06-08 to 2012-08-02 | 6.3579 | 6.4350 | 0.0771 |
2009-01-19 to 2009-03-14 | 6.9005 | 7.0259 | 0.1254 |
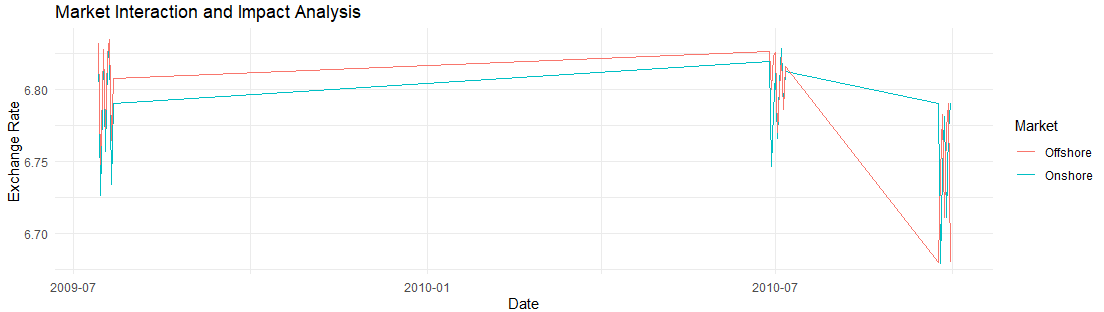
Figure 2: Comparative Exchange Rate Analysis: Onshore vs. Offshore Market Trends
The time periods when the onshore and offshore Renminbi markets move synchronously, as depicted in Table 1, suggest periods of aligned investor sentiment across both markets. These synchronized movements are particularly evident from 2013-07-05 to 2013-08-22 and from 2011-09-11 to 2011-10-22, where the minimum and maximum rates show a narrow range, indicating less volatility and a more unified market state.In contrast, the periods showing a significant difference in minimum and maximum rates, such as from 2012-06-08 to 2012-08-02 and from 2009-01-19 to 2009-02-05, may indicate contrasting market states due to factors such as divergent investors' sentiment, liquidity constraints, or the influence of regulatory measures.
As shown in Figure 2, beginning around July 2009, the graph shows that the onshore and offshore exchange rates start in close alignment and maintain this proximity until the middle of the same year. There is also a brief period at the start of 2010 where the two rates converge significantly. This is followed by a more extended phase from late 2010 into early 2011, during which the onshore and offshore rates exhibit almost identical trajectories. Lastly, there is a prolonged interval from late 2011 through to the middle of 2012 where the exchange rates once again demonstrate a tight correlation, moving in close concert with one another.
The Table 1 and the Figure 2 help illustrate the differences in volatility and liquidity between the CNY NDF and CNH currency markets.In essence, the selection between bonds from the deliverable CNY and CNH markets may depend on the degree of rate fluctuation and the range of exchange rates highlighted in the Error Analysis table. A period of higher volatility might lead to the selection of bonds that can potentially offer greater returns at higher risk, while more stable periods might incline investors towards bonds that offer less risk and stable returns.
2.2.2. Impact of Financial Policies
Geography continues to shape the character and promise of Hong Kong’s financial sector. Its physical and human links to the heartland of China made it a natural center for trade in goods and services [3]. The variations in the exchange rates driven by monetary policies and regulatory changes within the Hong Kong SAR and mainland China generate a lot of disruption in the financial economy, for instance, the relative exchange rates between the HKD and RMB (Renminbi).
According to the new regulations [4], changing policies and policy updates in the onshore and offshore Renminbi markets will cause expensive currency rates that, in turn, will significantly impact trading strategies, investment flows, economic sentiments, and many other things. For example, actions that would exploit China's financial markets or put restrictive capital controls can directly impact the market's liquidity and value, negatively affecting Hong Kong. China's financial strategy is two-fold. On one hand, it focuses on keeping the country's financial system stable to ensure economic security. On the other hand, it aims to make China an attractive destination for foreign investors. This approach means that while China works to maintain a steady and reliable economic environment, it also adopts policies designed to draw in investment from around the world. This balancing act is crucial for the country's goal of becoming a major player in the global economy, but it can also lead to changes in currency values as the market reacts to these dual objectives.Still, the new regulations, changing policies, and policy updates in the onshore and offshore Renminbi markets, as well as China's two-fold financial strategy of maintaining financial stability and attracting foreign investment are bound to result in relative currency valuation changes at the end of the day.
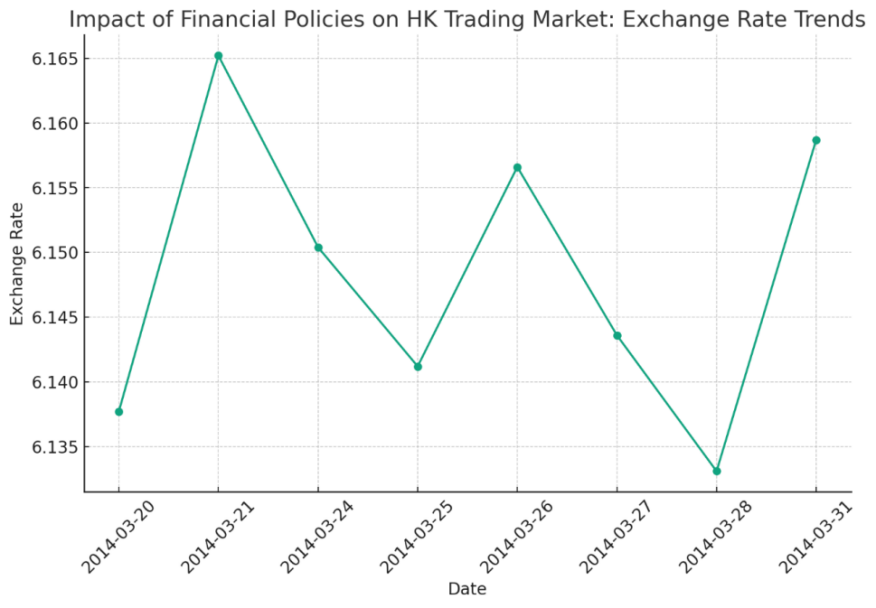
Figure 3: Exchange Rate Volatility Analysis: Influence of Financial Policies on Hong Kong Market
2.2.3. Time Series and Regression Analysis
The Figure 4 specifically showcases these interrelationships, showing how exchange rates vary due to financial policies, regulatory changes, and the economy. Financial policies, regulatory changes, and the economy results in a more significant influence on the Hong Kong market and the RMB. The Figure 4 provides the basis for tracing the dynamic trends that lead to the emergence of either positive or negative changes, as well as the community's sensitivity to policy adjustments.
The possibility of using contract rates to predict actual foreign exchange (FX) rates provides evidence for the efficiency of the cross-currency Non-Deliverable Forwards (NDF), offshore Yuan (CNH), and onshore Yuan (CNY) markets. If these specific markets—NDF, CNH, and CNY—are indeed efficient, analysts can predict future exchange rates effectively by comparing the contract rates at their maturity with the actual observed exchange rates. This effectiveness is due to the assumption that the contract rates encapsulate all available information. However, in scenarios where forecasts based on these contract rates significantly deviate from the actual exchange rates, such inaccuracies suggest the influence of additional factors not incorporated into the contract rates, thus affecting the exchange rate predictions.
As in Figure 4, the Hong Kong process offers an instrument for directly interpreting of the data and detecting insights about the Efficient market process.
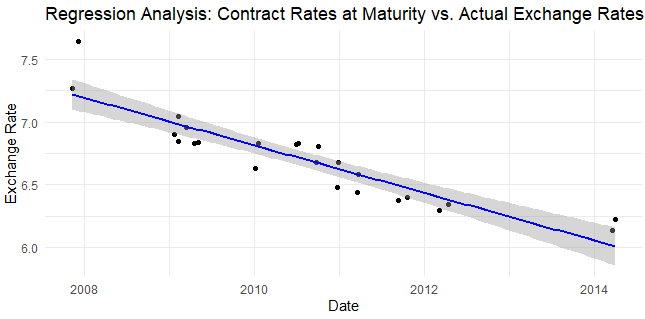 Figure 4: Time Series Regression Analysis: Projected vs. Actual Exchange Rates Comparison
Table 2: Exchange Rate Error Metrics: Minimum, Maximum, and Range Data Analysis
Error Analysis | |||
Period | Minimum Rate | Maximum Rate | Range |
2010-08-19 to 2010-09-05 | 6.6779 | 6.7899 | 0.1120 |
2009-02-06 to 2009-03-20 | 6.8483 | 6.9188 | 0.0705 |
2012-08-03 to 2012-09-20 | 6.3448 | 6.4121 | 0.0673 |
2012-12-06 to 2013-01-18 | 6.2777 | 6.3182 | 0.0405 |
2010-04-12 to 2010-05-20 | 6.7944 | 6.8037 | 0.0093 |
2011-03-19 to 2011-04-11 | 6.5803 | 6.5687 | -0.0116 |
2010-12-21 to 2011-01-14 | 6.6410 | 6.6251 | -0.0159 |
2007-11-10 to 2007-12-03 | 7.6420 | 7.5712 | -0.0708 |
2009-10-22 to 2009-11-20 | 6.8236 | 6.6566 | -0.1670 |
2010-01-16 to 2010-02-05 | 6.8207 | 6.5156 | -0.2051 |
The Table 2 lists the lowest and highest exchange rates for different time periods from 2007 to 2013, and the difference between these two exchange rates, namely the range. These data reflect the volatility of the exchange rates across the time periods. Some of these range values are negative, which usually indicates that currency fluctuations in that particular time period are not routine. The negative range between March 19 and April 11,2011 may be due to inflation concerns or expectations of currency appreciation playing a role. China's exchange rate formation regime has been gradually reformed, and the RMB exchange rate has gradually become more flexible. It is also noted that the actual appreciation of the yuan can be achieved through nominal appreciation or inflation, which has potential political consequences and different effects on different socioeconomic groups[5].
Unlike HKD, CNH and CNY vary with the supply and demand of the offshore and onshore RMB markets. Still, the CNH operates in a floating exchange rate system and is more exposed to international market forces than the CNY, which is mainly managed by the Chinese authorities. The arbitrage between these two markets implies a situation of abnormal disparities between their exchange rates. The appreciation of forecast errors in both financial markets is, by any means, something to consider by investors, traders, policymakers, and economists who work on upgrading their economic models and strategies.
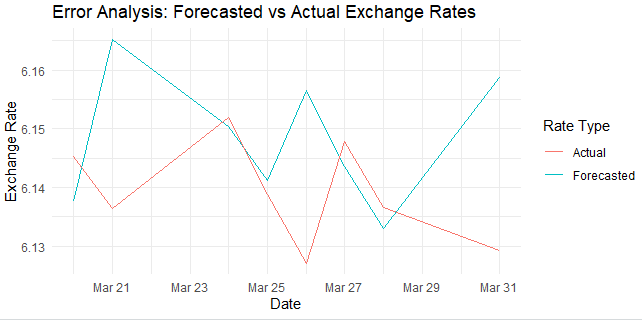
Figure 5: Forecast Accuracy Assessment: Actual vs. Predicted Exchange Rate Deviations
The Figure 5 compares two sets of exchange rate data over a brief period at the end of March.From the Figure 5, we can see that the actual and forecasted rates exhibit a degree of volatility, with the exchange rates fluctuating over the days presented. Notably, on March 25 and March 29, there are significant deviations between the forecasted and actual rates, indicating errors in the forecast. On other days, such as March 21 and March 31, the predicted and actual rates are closer, suggesting more accurate forecasts.
2.2.4. Liquidity and Volatility Analysis
The volatility analysis evaluates the stability of the Renminbi (RMB) by examining its exchange rate movements in both the onshore Yuan (CNY) Non-Deliverable Forwards (NDF) and offshore Yuan (CNH) currency markets. By doing so, the analysis measures the severity of the currency's appreciation and depreciation, providing insight into the impact of external events on market behavior. This methodical approach helps to assess the associated risks and uncertainties, thereby shedding light on the RMB's volatility within these significant financial arenas.
The previous sections outlined how economic and policy changes influence the RMB within the CNY NDF and CNH markets.The Figure 6 visually details RMB exchange rate volatility and its drivers, such as economic and geopolitical events.
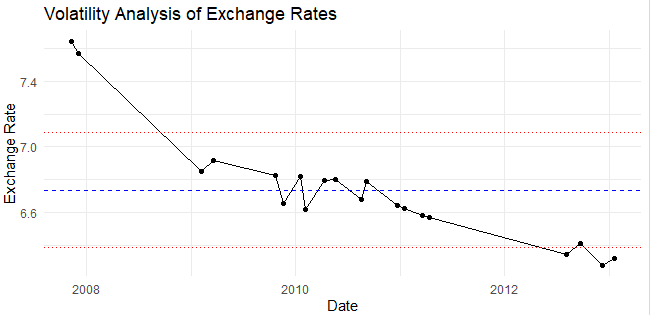
Figure 6: Exchange Rate Volatility Trend Analysis: Historical Overview
The Figure 6 depicts the analysis's purpose of explaining exchange rate volatility using economic and policy-related factors and geopolitical events as possible explanatory factors of market balance deviation. Being able to grasp the reason behind this fluctuation is of pivotal significance for investors and market players to take confident steps forward.
Several component transaction compositions in the CNH market are similar to the TLC investment business. From the analysis of the daily transaction volumes and the ETF spreads over time, we can accordingly evaluate the ETF market depth and its ability to absorb rapidly the rising size of trades without significant adverse effects. Rapid trade executions that welcome large amounts of trade (high liquidity) and a low impact on the exchange rate are evident in market cities where the transaction volume is high and the bid-ask spreads are narrow.
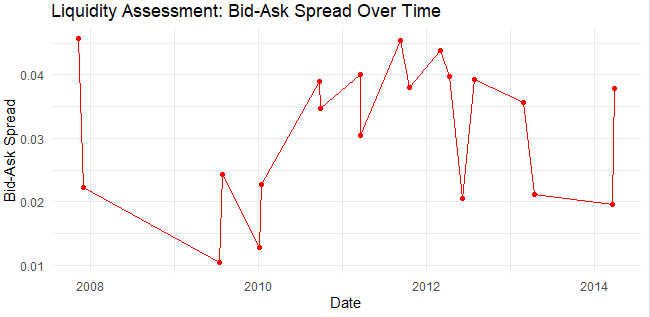
Figure 7: Market Liquidity Trend: Bid-Ask Spread Temporal Analysis
The Figure 7 plots the bid-ask spread of a financial instrument from 2008 to 2014. The bid-ask spread is a conventional measure of market liquidity, with a lower spread indicating higher liquidity and a tighter market where buying and selling can occur more seamlessly.However, the opposite might also be the case – more unstable price dynamics might be expected in case of low market liquidity, which affects the size of the order made by the investor.
This part assesses the RMB's exchange rate volatility in CNY NDF and CNH markets through standard deviation analysis. This section highlights Hong Kong's significant role in RMB internationalization, emphasizing the need to understand market dynamics and China’s financial policies for accurate exchange rate forecasting. The analysis concludes that market liquidity and volatility are pivotal in shaping the RMB's trajectory in global finance.
2.3. Substituting for Market Validation
2.3.1. Inter-market Comparison
The inter-market comparison would be vital for a better understanding of the amount of efficiency and dynamics of the New York Hedging and Beijing Hiding markets.Beijing and New York are both trading centers, and the study of these two markets is representative. By placing data in different lays of time, we can analyze the stability and forecast horizon of those rates within those markets.
Table 3: Intermarket Rate Differential: Comparative Spread Analysis
Market Comparisons | |||
Date | Market1Rate | Market2Rate | Spread |
2014-03-20 | 6.1331 | 6.1587 | 0.0256 |
2014-03-31 | 6.2232 | 6.1784 | -0.0448 |
2012-03-03 | 6.2939 | 6.2973 | 0.0034 |
2012-04-11 | 6.3417 | 6.3243 | -0.0174 |
2013-11-12 | 6.1334 | 6.1416 | 0.0082 |
2013-12-30 | 6.2009 | 6.1613 | -0.0396 |
2011-09-11 | 6.3712 | 6.3773 | 0.0061 |
2011-10-22 | 6.4622 | 6.4005 | -0.0617 |
2012-06-08 | 6.3516 | 6.3581 | 0.0065 |
2012-08-02 | 6.3814 | 6.3907 | 0.0093 |
2010-09-24 | 6.6791 | 6.6831 | 0.0040 |
2010-09-30 | 6.8087 | 6.7905 | -0.0182 |
2007-11-10 | 7.2704 | 7.4693 | 0.1989 |
2007-12-03 | 7.6420 | 7.6079 | -0.0341 |
2013-02-25 | 6.2893 | 6.3196 | 0.0303 |
2013-04-17 | 6.3302 | 6.3278 | -0.0024 |
From Table 3, we can see that the spread varies over time, indicating fluctuating differences between the two market rates. Positive values in the Spread column indicate that Market1 Rate was higher than Market2 Rate, while negative values indicate that Market1 Rate was lower.
The variability in the spreads between the two market rates substantiates the discussion on the stability and predictability of these rates. It highlights the challenges in forecasting within markets that are subject to fluctuating differences, underlining the complexity of making accurate future rate predictions.
2.3.2. Longitudinal Study and Regression Analysis
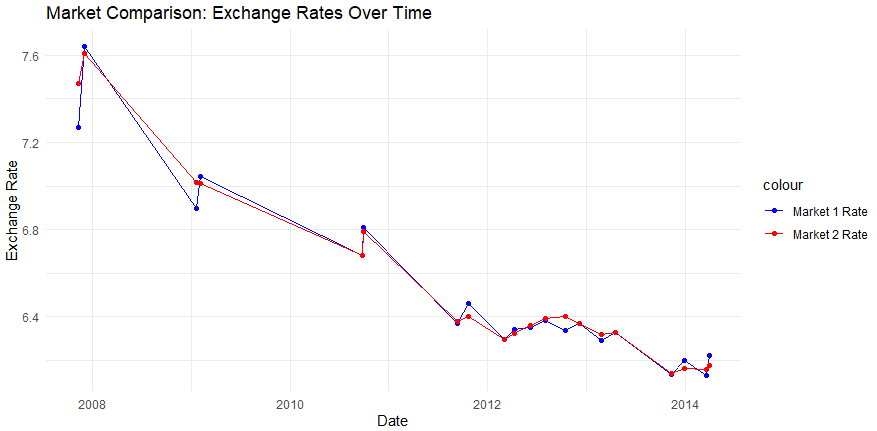
Figure 8: Dual Market Exchange Rate Dynamics: A Longitudinal Study
Initially, in 2007, there was a significant gap between the two markets' rates, with Market 1 having a notably higher rate than Market 2. This gap narrows over time as both rates decrease, and by the end of the observed period, the two rates appear to converge, indicating that the difference in exchange rates between the two markets has become smaller.The graph also shows that the rate of decrease is not uniform; there are periods of steeper decline and periods of relative stability.
The trends in exchange rates between 2007 and 2014, as illustrated in the Figure 8 , could be influenced by several significant global events. After the 2008 financial crisis, the rapid rise of China's money supply did not cause high inflation, which was manifested as the failure of the monetary quantity theory[6].Since the end of 2009, the sovereign debt crisis has begun to surface, which diminished confidence in European markets and influenced global currency exchange rates[7]. Since March 2009, the Fed has turned to quantitative monetary policy, also known as quantitative easing,which introduced additional dynamics into the global financial system [8]. These factors likely contributed to the converging trends of the two markets' rates seen in the graph, indicating related external influences on both markets during this period.
2.3.3. Advanced Regression Analysis: Unveiling Market Bias and Predictive Strength
We will replicate regression analysis to investigate the absence of bias in the market and will focus on the maturities of 1 and 3 months for CNY NDF and six months for CNY and CNH.The aim of the regression analysis for market unbiasedness is to assess how effectively future exchange rates can be realized and to test the theory that forward contracts predict these rates without bias. This analysis is based on the time series data presented in the graphic, which requires a detailed examination. Similarly, the objective of the time series analysis for market dynamics is to explore the variability in exchange rates and the valuation of deliverable and non-deliverable financial instruments.This technique helps to identify the directional influences, lead-lag relationships, and time lags between exchange rates and contract prices.
Table 4: Chronological Exchange Rate Analysis: Spot Rate Fluctuations
Regression Analysis | |
Date | Exchange Rate |
2012-03-03 | 6.2939 |
2012-04-11 | 6.3417 |
2010-06-28 | 6.8198 |
2010-07-06 | 6.8287 |
2014-03-20 | 6.1331 |
2014-03-31 | 6.2232 |
2009-02-06 | 6.8483 |
2009-03-12 | 6.9581 |
2009-04-17 | 6.8326 |
2009-05-02 | 6.8350 |
2011-03-19 | 6.4377 |
2011-03-21 | 6.5842 |
2007-11-10 | 7.2704 |
2007-12-03 | 7.6420 |
From a cursory look at the exchange rates, it seems there's a general declining trend, with the earliest date in 2007 showing the highest exchange rate of 7.2704, and rates generally decreasing over time to a low of 6.1331 in 2014. This could indicate a strengthening of the currency over time relative to its pair, or it could be reflective of broader economic trends impacting the currency's value.
Table 5: Periodic Exchange Rate Volatility: Min-Max Range Assessment
Volatility Analysis | |||
Period | Minimum Rate | Maximum Rate | Range |
2007-11-10 to 2007-12-03 | 7.5712 | 7.6420 | 0.0708 |
2009-01-19 to 2009-02-05 | 6.8974 | 6.9820 | 0.0846 |
2009 02-06 to 2009-03-20 | 6.8483 | 6.9188 | 0.0705 |
2010-01-04 to 2010-02-05 | 6.8267 | 6.9665 | 0.1398 |
2010-04-12 to 2010-05-20 | 6.7944 | 6.8037 | 0.0093 |
2010-09-24 to 2010-10-22 | 6.7905 | 6.8087 | 0.0182 |
2010-12-21 to 2011-01-14 | 6.6410 | 6.6463 | 0.0053 |
2011-03-19 to 2011-04-11 | 6.5803 | 6.5687 | 0.0116 |
2011-09-11 to 2011-10-22 | 6.3712 | 6.4347 | 0.0635 |
2012-03-03 to 2012-04-11 | 6.2939 | 6.3161 | 0.0222 |
2012-08-03 to 2012-09-20 | 6.3448 | 6.4121 | 0.0673 |
2014-03-20 to 2014-03-31 | 6.1377 | 6.1587 | 0.0210 |
There is variability in the range column, suggesting that the volatility of the exchange rate was not constant over time. For instance, the period from 2009-01-19 to 2009-02-05 shows a relatively high range (0.0846), which indicates a high level of volatility during that time frame.Comparatively, the period from 2010-12-21 to 2011-01-14 exhibits a much lower range (0.0053), suggesting a very stable exchange rate during those dates.The latest period shown, from 2014-03-20 to 2014-03-31, has a low range (0.021), which might indicate a stable exchange rate in that very short period of time.
The volatility in exchange rates, as seen in the provided periods, could reflect the impact of various economic and political events globally. During times of high volatility, such as the period from 2009-01-19 to 2009-02-05, the world was grappling with the aftermath of the 2008 financial crisis, which saw significant fluctuations in global markets. This crisis led to widespread economic uncertainty and affected currency values as investors sought safer assets. In contrast, periods of low volatility, like from 2010-12-21 to 2011-01-14, may coincide with times of relative economic stability or the effectiveness of policy interventions aimed at stabilizing the markets. These ranges in exchange rate fluctuations can also be influenced by specific events in the countries whose currencies are being analyzed, including changes in interest rates by central banks, announcements of economic reforms, or shifts in trade policies.
3. Conclusion
This article conducts deliverable and non-deliverable contracts in Hong Kong's trading market, dissects the intricacies and dynamic nature of financial markets against the backdrop of globalization and policy shifts, aiming to reveal the impact on the Chinese Yuan, and concludes with insights into the market's adaptability and the Yuan's potential trajectory from 2007 to 2014. By examining various factors such as liquidity, volatility, market sentiment, and the impact of regulatory measures, this study contributes valuable insights into the efficiency and predictability of these markets. The findings underscore the critical role of Hong Kong as a pivotal hub for RMB internationalization, reflecting broader trends in global finance and offering implications for traders, policymakers, and investors.Depending on the initial findings, the onshore (CNY) deliverable market may be replaced with the offshore (CNH) deliverable market for secondary analysis to test the results' consistency across different deliverable markets. Onshore and offshore (CNY) deliverables (CNH) have similar fundamental roles but differing market dynamics. Both represent the Chinese yuan in forward contracts but operate in different market environments. Due to the changing regulatory policies and economic environment in recent years, the research results made using the data may not be of great reference significance to the current situation. This paper adopts a relatively single research and test method, which has certain limitations and cannot conduct a comprehensive and accurate analysis. This case study not only enhances our understanding of the specific mechanics at play in the deliverable and non-deliverable forward markets but also sets the stage for future research on currency internationalization and market dynamics in the evolving landscape of global trade and investment.
References
[1]. Ma, G., Ho, C., & McCauley, R. N.** (2004). The markets for non-deliverable forwards in Asian currencies. *BIS Quarterly Review*, June.
[2]. Li Daokui, and Liu Linlin. "RMB internationalization: measurement research and policy analysis. Financial Research 11 (2008): 1-16.
[3]. Hong Kong Monetary Authority, (2022). “Price Disparities between China’s Onshore and Offshore Financial Markets,” Half-Yearly Monetary and Financial Stability Report, (March), pp. 48—51.
[4]. Pauly, Louis W. " Hong Kong as a regional and global financial hub."Hong Kong Magazine (Carnegie Endowment for International Peace) 21 (2011)
[5]. Huang, Yiping. (2010). "Misperceptions about the RMB and Chinese Exchange Rate Policy." East Asia Forum. April 11.Retrieved from https://eastasiaforum.org/2010/04/11/misperceptions-about-the-rmb-and-chinese-exchange-rate-policy/.
[6]. Chen Yanbin, Guo Yumei, & Chen Weize. (2015). Study on the Failure of China after the 2008 Financial Crisis. Economic research, 4.
[7]. Huang Yongzhong. (2011). The root cause and impact of the European debt crisis and its enlightenment. Search, 3,86-87.
[8]. Cui Shaozhong. (2011). The enlightenment of US monetary policy in the post-financial crisis (Doctoral dissertation).
Cite this article
Wang,J. (2024). Comparative Analysis of Deliverable and Non-Deliverable Contracts in the Hong Kong Trading Market - Taking RMB as an Example. Advances in Economics, Management and Political Sciences,91,130-141.
Data availability
The datasets used and/or analyzed during the current study will be available from the authors upon reasonable request.
Disclaimer/Publisher's Note
The statements, opinions and data contained in all publications are solely those of the individual author(s) and contributor(s) and not of EWA Publishing and/or the editor(s). EWA Publishing and/or the editor(s) disclaim responsibility for any injury to people or property resulting from any ideas, methods, instructions or products referred to in the content.
About volume
Volume title: Proceedings of the 2nd International Conference on Management Research and Economic Development
© 2024 by the author(s). Licensee EWA Publishing, Oxford, UK. This article is an open access article distributed under the terms and
conditions of the Creative Commons Attribution (CC BY) license. Authors who
publish this series agree to the following terms:
1. Authors retain copyright and grant the series right of first publication with the work simultaneously licensed under a Creative Commons
Attribution License that allows others to share the work with an acknowledgment of the work's authorship and initial publication in this
series.
2. Authors are able to enter into separate, additional contractual arrangements for the non-exclusive distribution of the series's published
version of the work (e.g., post it to an institutional repository or publish it in a book), with an acknowledgment of its initial
publication in this series.
3. Authors are permitted and encouraged to post their work online (e.g., in institutional repositories or on their website) prior to and
during the submission process, as it can lead to productive exchanges, as well as earlier and greater citation of published work (See
Open access policy for details).
References
[1]. Ma, G., Ho, C., & McCauley, R. N.** (2004). The markets for non-deliverable forwards in Asian currencies. *BIS Quarterly Review*, June.
[2]. Li Daokui, and Liu Linlin. "RMB internationalization: measurement research and policy analysis. Financial Research 11 (2008): 1-16.
[3]. Hong Kong Monetary Authority, (2022). “Price Disparities between China’s Onshore and Offshore Financial Markets,” Half-Yearly Monetary and Financial Stability Report, (March), pp. 48—51.
[4]. Pauly, Louis W. " Hong Kong as a regional and global financial hub."Hong Kong Magazine (Carnegie Endowment for International Peace) 21 (2011)
[5]. Huang, Yiping. (2010). "Misperceptions about the RMB and Chinese Exchange Rate Policy." East Asia Forum. April 11.Retrieved from https://eastasiaforum.org/2010/04/11/misperceptions-about-the-rmb-and-chinese-exchange-rate-policy/.
[6]. Chen Yanbin, Guo Yumei, & Chen Weize. (2015). Study on the Failure of China after the 2008 Financial Crisis. Economic research, 4.
[7]. Huang Yongzhong. (2011). The root cause and impact of the European debt crisis and its enlightenment. Search, 3,86-87.
[8]. Cui Shaozhong. (2011). The enlightenment of US monetary policy in the post-financial crisis (Doctoral dissertation).