


1. Introduction
Against the backdrop of global economic development, accelerating the implementation of an innovation-driven development strategy has become an inevitable choice for Chinese enterprises to achieve high-quality and leapfrog development. However, enterprises require persistent and substantial capital investment in the early stages of innovation projects, and the time for transforming innovation outcomes is lengthy. Once the funding is interrupted, innovation activities will be severely obstructed [1]. This high-risk characteristic deters many financially strapped and difficulty-financing enterprises from engaging in innovation activities. In order to promote economic structural transformation, the Chinese government has successively promulgated a series of economic intervention policies to incentivize innovation. This paper will focus on the “Measures for the Administration of Recognition of High and New Technology Enterprises” (HTE) jointly issued by the Chinese government on April 14, 2008 [2].
This study aims to examine the role of the High and New Technology Enterprise Certification Policy (HTE) in fostering involvement in technological innovation among Chinese businesses. The academic debate presents two conflicting perspectives regarding the efficacy of such policy support. According to one perspective, the inherent high risks associated with innovation activities necessitate government intervention. This intervention, through significant resource infusion, could rectify market deficiencies, thereby encouraging companies to innovate [3]. Conversely, another standpoint argues against the government's ability to distribute resources effectively. Instead, it suggests that direct government meddling, the creation of unfair competitive advantages, and biased support could potentially stifle entrepreneurial innovation [4]. The existing body of research has primarily scrutinized individual industry policies or specific policy instruments, offering scant comprehensive evaluation of China's broader High and New Technology Enterprise Certification Policy.
The contributions of this study are outlined as follows: 1. The prevailing body of work examining China’s policy for certifying high-tech enterprises predominantly examines aspects related to the stock market and investment strategies [5], often utilizing a constrained set of data and neglecting potential biases in research and development reporting [6]. This study improves upon previous research by filtering out entities suspected of skewing research and development data, thereby securing a more accurate dataset that reflects the genuine innovative activities of high-tech companies. This approach enables a nuanced empirical analysis of the proposed hypotheses at a granular level. 2. Our empirical investigation distinguishes between different types of patents—namely, invention, utility model, and design patents. It conducts a comparative analysis of the aggregate patent applications and specifically the invention patent submissions by firms, using these as dependent variables to solidify the findings' credibility. 3. Additionally, this research acknowledges the varied effects across different enterprises, offering a deeper insight into how broad economic policies translate into specific impacts within microeconomic environments.
The organization of this document is delineated as follows: Section 2 delves into the theoretical framework and posits research propositions, contextualized within the backdrop of the relevant policy. In Section 3, the methodology employed for the study is outlined, detailing the criteria for sample selection, the definitions of the variables, and a summary of the statistical data. Section 4 is dedicated to showcasing the findings from the empirical analysis. Finally, Section 5 concludes the study with a summary of the key findings and offers recommendations for policy formulation.
2. Theoretical Analysis and Research Hypotheses
Innovation investment directly affects a company’s future profitability and market competitiveness [7]. However, unlike ordinary investments, research and development (R&D) investment involves high input, high risk, high uncertainty, and delayed returns [8], leading to hesitation among enterprises regarding innovation investment. In response to this situation, the government has begun to utilize fiscal subsidies and administrative control measures to participate in the innovation activities of private enterprises [9]. Overall, the government encourages enterprises to apply for high-tech enterprise certification by utilizing the following benefit models.
2.1. Direct Benefits
According to the “People’s Republic of China Tax Collection and Administration Law,” enterprises obtaining high-tech enterprise certification can enjoy preferential tax rates of 15% on income tax, additional deductions for R&D expenses, and tax deductions for energy-saving and environmental protection equipment, among other tax incentives. The reduction of tax burden to a certain extent reduces the outflow of cash from enterprises and enhances the internal financing capability of enterprises for innovation activities [10]. Secondly, certified high-tech enterprises can enjoy various incentive policies provided by local governments, such as government subsidies, facilitation in financing approvals, and preferential land leasing [11]. Finally, high-tech enterprise certification makes it easier for enterprises to apply for other policy supports and rewards, thereby enhancing their innovation capabilities. For example, certified high-tech enterprises are more likely to obtain recognition as “specialized, refined, special, and new” enterprises and receive further support from the state [12].
Hypothesis 1: High-tech enterprise certification can promote enterprise innovation through direct benefits.
2.2. Indirect Benefits
The propensity of a business to innovate, regarded as a strategic investment choice, hinges on its governance framework. Often, the stumbling block to innovation within corporations is not the absence of advantageous circumstances but a deficit in incentivization [13]. A notable instance is how the divergence between ownership and managerial control in public companies gives rise to the “principal-agent” dilemma. This situation sees managers prioritizing risk aversion to maintain consistent operational results [14], a stance that diverges from the interests of long-term organizational growth. Nonetheless, the policy for certifying companies as high-tech entities serves as an indirect catalyst for bolstering innovation efforts.
To begin with, the degree to which a company's culture is receptive to innovation plays a pivotal role in fostering or hindering innovative undertakings [15]. An environment that prizes innovation is likely to see a greater allocation of resources towards inventive projects [16]. The certification policy for high-tech businesses plays a crucial role in enlightening company leaders about the substantial benefits of innovation, thereby mitigating their inclination towards short-termism. Moreover, the requirement for high-tech certified companies to enhance transparency via an information disclosure mechanism, set up in collaboration with various regulatory bodies, simplifies the process for these entities to draw investment and media spotlight, thereby encouraging innovative endeavors. Lastly, achieving high-tech status bolsters a firm's human capital, enhancing its ability to both retain and attract top-tier research talent [17].
Hypothesis 2: High-tech enterprise certification can promote enterprise innovation through indirect benefits.
2.3. The Influence of Enterprise Heterogeneity on the Effectiveness of High-Tech Enterprise Certification
The "Administrative Measures" introduced in 2008 were designed to extend the benefits of high-tech enterprise certification to all enterprises within China. However, the impact of this policy is not uniform across all entities, attributed to variations in enterprise characteristics. This research aims to investigate how different factors, including the type of enterprise ownership, the structure of corporate governance, and the level of market competition, influence the policy's effectiveness.
Particularly, private firms, which often grapple with limited resources and issues of unequal information distribution [18], exhibit a stronger inclination towards innovation and more effectively transform resources into innovative outcomes [19]. As a result, such enterprises tend to experience more pronounced improvements in innovation performance following high-tech certification. Furthermore, regarding corporate governance, the adoption of equity-based incentives is shown to more closely align the objectives of managers with those of shareholders than conventional performance incentives [20]. This approach mitigates the negative impacts associated with the principal-agent dilemma and bolsters the firm's capacity to withstand risks [21]. In the context of market competition, firms operating in less monopolistic and more competitive sectors are generally more stimulated by external pressures to pursue technological advancements [22]. Evidence suggests that a balanced level of competition can spur enterprises to enhance their offerings, technologies, and overall market standing [23].
Hypothesis 3: High-tech enterprise certification has a greater impact on the innovation performance of private enterprises, equity incentive enterprises, and enterprises facing fierce market competition.
2.4. The Influence of Research and Development Manipulation on the Effectiveness of High-Tech Enterprise Certification
High-tech enterprise certification is based on the forward-looking information provided by enterprises [24]. Therefore, to meet policy requirements, enterprises may engage in deceptive behavior driven by “policy support orientation,” such as conducting “pseudo” research and development or engaging in “strategic” innovation to obtain relevant policy preferences [25]. Therefore, it is necessary to effectively identify and exclude these “pseudo” high-tech enterprises, so that the remaining “true” high-tech enterprises can achieve better innovation performance.
Hypothesis 4: After excluding samples of enterprises engaged in research and development manipulation, high-tech enterprise certification has a significantly positive impact on enterprise innovation.
3. Research Design
3.1. Sample Selection
The information for this analysis was primarily sourced from the Wind database, the Torch Center of the Ministry of Science and Technology (accessible at http://www.ctp.gov.cn/), and the official site for High-Tech Enterprise Certification Management (found at http://www.innocom.gov.cn/). Additional data concerning high-tech enterprise certification and research and development (R&D) activities were meticulously compiled through a manual review of certification announcements and the annual disclosures of companies listed on the stock exchanges. The study's dataset encompasses all corporations listed on the Shanghai and Shenzhen Stock Exchanges over the period from 2006 to 2022, with the starting point chosen due to the implementation of revised accounting standards in China that year, leading to a more consistent reporting of R&D expenditures by listed entities.
Upon completion of the selection process, the research compiled a dataset comprising 27,730 observations across 2,387 firms. Out of these, 1,110 firms have disclosed their involvement in high-tech enterprise certification initiatives and are subsequently categorized as high-tech enterprises for the purposes of this investigation.
3.2. Definition of Variables
The detailed definitions of relevant variables in this study are shown in Table 1.
Table 1: Definition of Key Variables
Variable | Variable Name | Definition |
LnPatent | Innovation Indicator (Total Patent Applications of Enterprises) | The total number of patent applications, including invention patent applications, utility model patent applications, and design patent applications. The natural logarithm of (1 + total patent applications) is taken to form a measure of ln(1 + total patent applications). |
LnInvention | Innovation Indicator (Total Invention Patent Applications of Enterprises) | ln(1 + total invention patent applications) |
HTE | High-Tech Enterprise Certification Status | A dummy variable indicating whether the enterprise has obtained high-tech enterprise certification (Yes=1, No=0). |
Size | Company Size | Ln (Total Assets of the Company). |
Age | Company Establishment Time | Ln (2021 - Year of Company Establishment + 1). |
State | Ownership Status | A dummy variable indicating whether the enterprise is state-owned (Yes=1, No=0). |
IndRat | Proportion of Independent Directors | Number of independent directors / Total number of directors |
Dual | Whether the Chairman is also the CEO | A dummy variable indicating whether the chairman and CEO of the enterprise are the same person (Yes=1, No=0). |
Institution | Proportion of Institutional Investors | Number of shares held by institutional investors / Total shares of the company |
MarkShar | Product Market Share | Sales volume of the company’s products / Sales volume of similar products in the market |
ROA | Return on Assets | Net profit / Total assets |
Leverage | Leverage Ratio | Total liabilities / Total assets |
Fixed | Fixed Asset Ratio | Net value of fixed assets / Total assets |
Liquidity | Liquidity | (Current Assets - Current Liabilities/Total Assets) |
Growth | Revenue Growth | (Current year’s revenue - Last year’s revenue) / Last year’s revenue |
Industry | Industry | Industry to which the enterprise belongs |
Year | Time | Year corresponding to the sample data |
Province | Province | Province where the enterprise is located |
3.3. Statistical Summary
Table 2 presents the basic statistical parameters summary of variables for companies that have obtained high-tech enterprise certification (N=1110) and companies that have not obtained high-tech enterprise certification (N=1276).
Table 2: Summary of Key Variable Statistics
Certified High-Tech Enterprises | Non-certified High-Tech Enterprises | |||||
Variable | Mean | Standard Deviation | Median | Mean | Standard Deviation | Median |
Patent | 48.1194 | 286.7455 | 6.0000 | 43.1698 | 410.0977 | 0.0000 |
LnPatent | 11.5662 | 40.5093 | 2.0794 | 8.5668 | 38.3582 | 1.0000 |
Invention | 20.3613 | 173.1195 | 2.0000 | 12.9860 | 135.7331 | 0.0000 |
LnInvention | 3.9818 | 11.3476 | 1.0986 | 2.5775 | 9.7471 | 1.0000 |
Size | 21.9769 | 1.1782 | 21.8213 | 22.5951 | 1.4699 | 22.4099 |
Age | 10.3595 | 9.4739 | 3.0445 | 13.7084 | 10.5788 | 15.0000 |
MarkShar | 0.0747 | 0.0849 | 0.0459 | 0.0646 | 0.0839 | 0.0342 |
ROA | 0.0407 | 0.0617 | 0.0390 | 0.0347 | 0.0640 | 0.0326 |
Fix | 0.2185 | 0.1396 | 0.1957 | 0.2365 | 0.1885 | 0.1932 |
Leverage | 0.4176 | 0.1985 | 0.4117 | 0.4922 | 0.2120 | 0.4954 |
Liquidity | 0.2347 | 0.2324 | 0.2277 | 0.1450 | 0.2560 | 0.1339 |
Growth | 0.1853 | 0.4049 | 0.1237 | 0.1829 | 0.5148 | 0.0947 |
State | 0.3566 | 0.4790 | 0.0000 | 0.5452 | 0.4980 | 1.0000 |
IndRat | 0.3725 | 0.0526 | 0.3333 | 0.3733 | 0.0540 | 0.3571 |
Dual | 0.2738 | 0.4459 | 0.0000 | 0.1921 | 0.3939 | 0.0000 |
Institution | 0.2186 | 0.2438 | 0.0970 | 0.3246 | 0.2946 | 0.2678 |
Note: This table summarizes key variables from 2006 to 2022, with variable definitions provided in Table 1.
From the sample perspective, companies with high-tech enterprise certification exhibit more intensive innovation activities, and the number of “substantial” innovations is also higher: certified companies apply for 48 patents per year, including 20 invention patents, while non-certified companies apply for 43 patents per year, with only 12 being invention patents.
4. Empirical Analysis
4.1. Benchmark Regression Test
To investigate the relationship between high-tech enterprise certification and corporate innovation, this paper establishes a benchmark model.
LnPatentit = α + βHTEi + β’Xit + ΣYear +ΣIndustry + ΣProvince + εit (1)
LnInventionit = α + βHTEi + β’Xit + ΣYear + ΣIndustry + ΣProvince + εit (2)
The dependent variable LnPatentit represents the natural logarithm of one plus the total number of patent applications for enterprise i in year t; LnInventionit represents the natural logarithm of one plus the total number of invention patent applications for enterprise i in year t, reflecting the level of innovation. The main explanatory variable is HTEi, where HTEi equals 1 if enterprise i obtains high-tech enterprise certification, and 0 otherwise. Xit is the vector set of control variables. The regression also controls for year fixed effects (Year), industry fixed effects (Industry), and province fixed effects (Province), εit represents the residual.
To test the fourth hypothesis, the analysis initially omits firms recognized as high-tech entities starting from 2010, creating a focused subgroup. The rationale behind this selection will be elaborated upon further in the document. Subsequent regressions are applied to both the comprehensive dataset and the narrowed subgroup, with findings presented in Table 3.
Table 3: Analysis of Explanatory Variables
Total Sample | Subsample | |||
Explanatory Variable | LnPat | LnInv | LnPat | LnInv |
HTE | 4.5522*** | 1.9309*** | 5.7740*** | 2.4709*** |
(7.4352) | (10.5668) | (7.1590) | (10.2476) | |
Size | 6.1632*** | 1.6396*** | 6.2048*** | 1.6198*** |
(20.2572) | (19.5081) | (17.8637) | (16.6611) | |
Age | -0.5671*** | -0.1189*** | -0.8331*** | -0.1714*** |
(-5.9748) | (-4.6485) | (-7.1625) | (-5.5329) | |
Markshar | 9.4457*** | 3.4245*** | 5.9144* | 2.3836** |
(3.3975) | (4.0042) | (1.6744) | (2.2331) | |
ROA | 7.1552* | 3.1458** | 1.7793 | 0.5998 |
(1.6798) | (2.4732) | (0.3421) | (0.3837) | |
Fix | -2.3039 | -0.5274 | -0.6581 | 0.6908 |
(-1.1245) | (-0.8891) | (-0.2695) | (0.9702) | |
Leverage | -0.8162 | 0.9930* | -2.7397 | 0.8929 |
(-0.4425) | (1.9368) | (-1.2721) | (1.4979) | |
Liquidity | 2.6462* | 2.0372*** | 0.8581 | 2.3362*** |
(1.6816) | (4.4929) | (0.4501) | (4.3221) | |
Growth | -1.6298*** | -0.4524*** | -1.2362** | -0.1876 |
(-3.0847) | (-3.0357) | (-1.9682) | (-1.0109) | |
State | 3.1461*** | 0.9842*** | 2.0802*** | 0.6119*** |
(5.4204) | (5.8689) | (3.2650) | (3.3145) | |
IndRat | 12.8546** | 4.7510*** | 12.6159* | 5.2836** |
(2.3404) | (2.8839) | (1.8106) | (2.5594) | |
Dual | -1.3934*** | -0.2984* | -2.7838*** | -0.4227** |
(-2.6216) | (-1.9155) | (-4.0246) | (-2.0541) | |
Institution | 13.0600*** | 2.7100*** | 13.4024*** | 2.7064*** |
(7.7710) | (5.7124) | (6.5291) | (4.7076) | |
Constant | -163.0590*** | -46.5357*** | -162.0742*** | -46.5547*** |
(-21.9246) | (-21.3871) | (-18.8910) | (-18.3775) | |
Year | Yes | Yes | Yes | Yes |
Industry | Yes | Yes | Yes | Yes |
Province | Yes | Yes | Yes | Yes |
Number of obs | 27730 | 27730 | 19797 | 19797 |
Pseudo R2 | 0.0235 | 0.0304 | 0.0265 | 0.0343 |
Note: ***、** and * respectively represent the significant levels of 1%, 5%, and 10%. The T statistic is in parentheses (T = (x - μ) / (s / √n)).
Analysis of the data presented in Table 3 reveals several key findings. Initially, the positive and statistically significant coefficients for HTE indicate that acquiring high-tech enterprise status contributes to an overall increase in a firm's innovation levels. Furthermore, the analysis shows that the effect sizes for the subsample exceed those observed in the full dataset. This difference can be attributed to certain enterprises that, despite their lower innovation capabilities, artificially inflate their research and development expenditures to qualify for the tax advantages linked to high-tech certification [26]. This phenomenon is tied to the certification's eligibility requirements, which assess a company's performance over the preceding three fiscal years. Thus, firms that engaged in such manipulative practices were unlikely to achieve certification prior to 2010, given that the “Management Measures” were only implemented in 2008. Consequently, including these enterprises in the total sample dilutes the observable beneficial impact of the high-tech certification on innovation.
In summary, by excluding companies certified after 2010 in the aforementioned subsample, potential participants in research and development manipulation are screened out. The HTE-related coefficients in the excluded sample are more significant, thus validating Hypothesis 4. To ensure the effectiveness of subsequent analyses, this paper will continue the analysis based on the subsample.
4.2. Robustness Test
4.2.1. Analysis Based on PSM-DID Method
This study addresses potential sample distortions such as confounding variables and the issue of reverse causality, which could skew the findings, by applying the PSM-DID approach for a more accurate analysis. The underlying principle of this method is the assumption that, prior to receiving high-tech enterprise certification, if a company resembles another firm within the same sector in key respects, then the certification status would be the decisive factor influencing their disparity in innovation performance.
The initial phase involves the application of propensity score matching (PSM), aiming to align companies based on their propensity scores, which are derived from essential business attributes. This is achieved by focusing on primary characteristics such as the total and the growth rate of patent filings (represented by LnPatent and PatGrowth, respectively). The paper then pairs the treatment and control groups within identical industries and years. The effectiveness of this matching is depicted in Figure 1, showing the score densities before and after the matching process. The post-matching comparison reveals a notable convergence in the distribution of scores between the two groups, significantly widening the overlap in their score ranges.
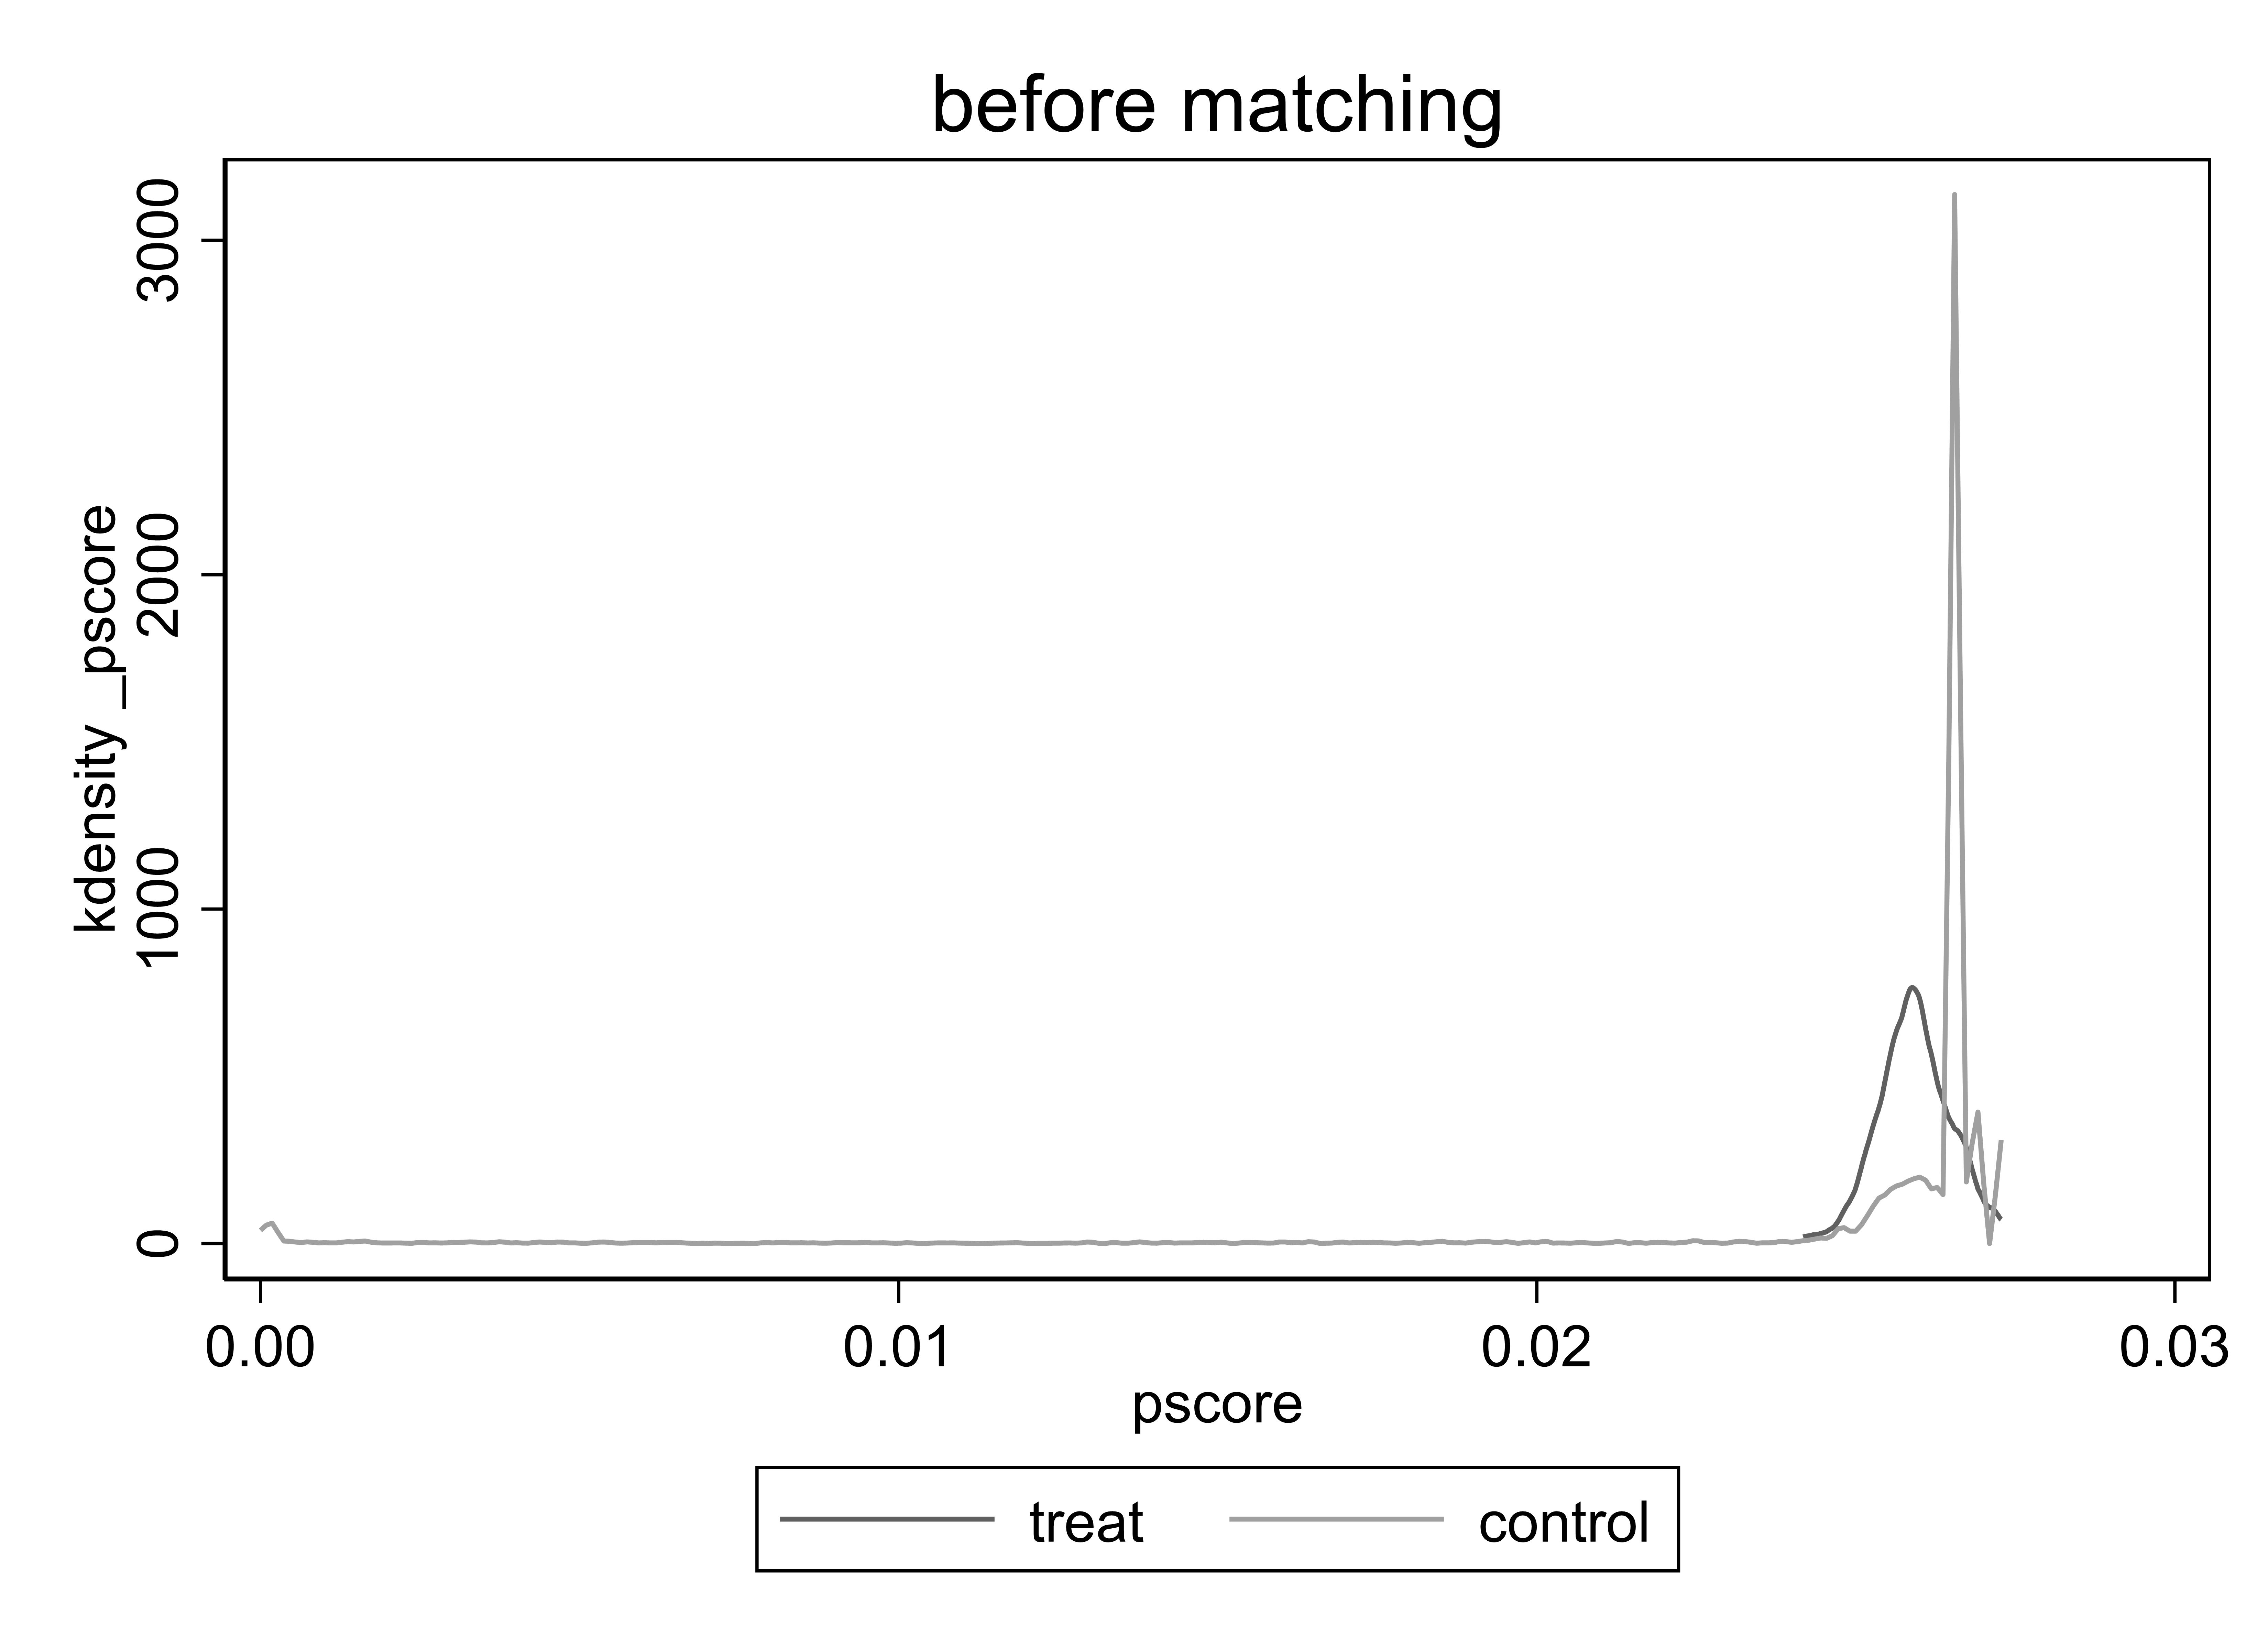
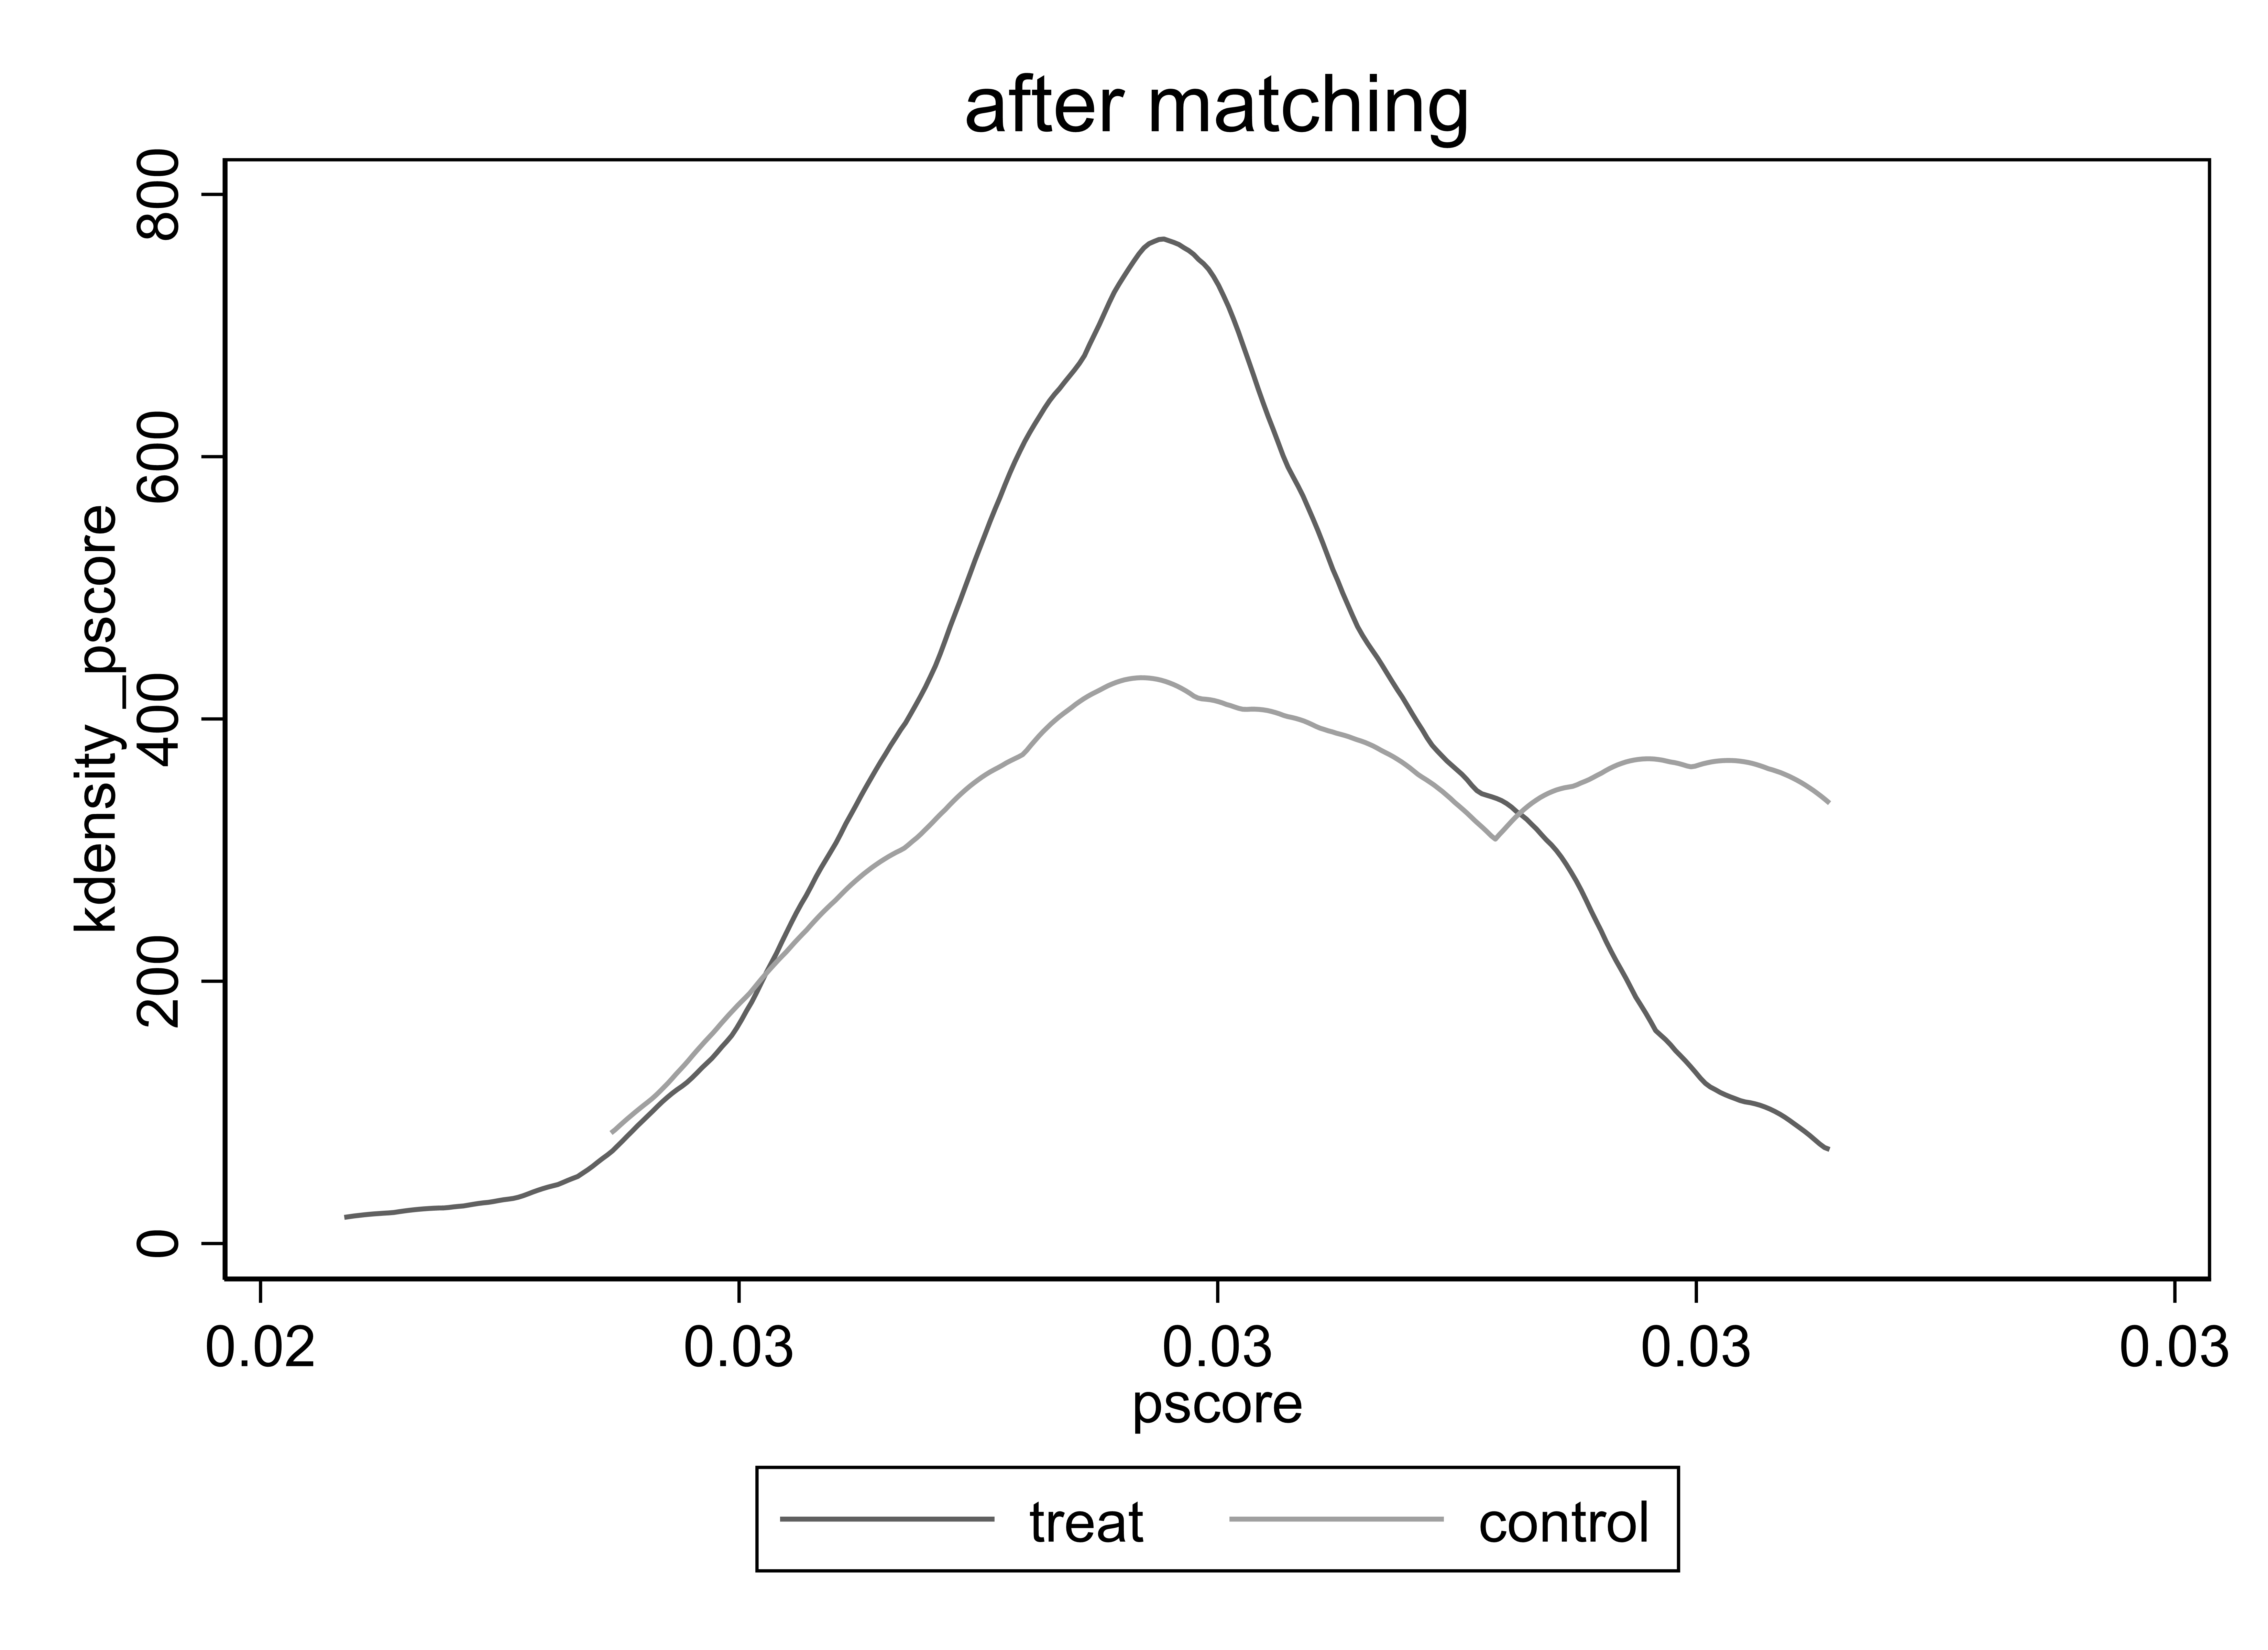
(Generated by Stata)
Figure 1: Effect of Propensity Score Matching
The second step is the Double Difference (DID) method. Using the sample matched by PSM, a DID model is constructed to examine the causal relationship between high-tech enterprise certification and corporate innovation, with the model as follows:
LnPatentit = α + βHTEi × Afterit+ β’Xit + ΣYear +ΣFirm + εit (3)
LnInventionit = α + βHTEi × Afterit+ β’Xit + ΣYear +ΣFirm + εit (4)
Table 4 reports the regression results. Regardless of whether the dependent variable is the total number of patent applications or the number of invention patent applications, the coefficient of HTE × Afterit is significant and positive. This demonstrates that after controlling for relevant confounding factors, the promotion effect of high-tech enterprise certification on corporate innovation output remains evident.
Table 4: Robustness Test Results Based on PSM-DID
LnPatent | LnInvention | |
HTE×After | 5.3598** | 1.9960*** |
(2.3705) | (2.7185) | |
Year | Yes | Yes |
Firm | Yes | Yes |
Control | Yes | Yes |
Constant | -83.3026*** | -31.0526*** |
(-4.8985) | (-6.4017) | |
Observations | 19797 | 19797 |
Pesudo R2 | 0.0532 | 0.0775 |
Note: ***、** and * respectively represent the significant levels of 1%, 5%, and 10%. The T statistic is in parentheses (T = (x - μ) / (s / √n)).
4.2.2. Further Robustness Test
In this section, the implementation intensity of the high-tech enterprise certification policy is measured by the number of times the sample companies are certified as high-tech enterprises within a certain period. The more times a company is certified, the deeper the impact of the certification policy on the company. Based on the theoretical analysis and empirical conclusions mentioned above, we infer that the growth in the number of certifications will further exacerbate the impact on innovation. The specific derivation model is described below:
LnPatentit = α + βInsi,t-1 + β’Xit + ΣYear +ΣIndustry + εit (5)
LnInventionit = α + βInsi,t-1 + β’Xit + ΣYear +ΣIndustry + εit (6)
The validity period of high-tech enterprise certification is three years. After expiration, the certification can be renewed multiple times. Insi,t-1 represents the cumulative number of times company i obtained high-tech enterprise certification in year t-1. Other variables are defined as in the previous text. Table 5 shows that the coefficient of Insi,t-1 is significant and positive. This result once again confirms that high-tech enterprise certification can promote corporate innovation, and the positive correlation strengthens as the number of certifications obtained by the company increases.
Table 5: Further Robustness Test Results
LnPatent | LnInvention | |
Insi,t-1 | 0.0743*** | 0.0757*** |
(7.7817) | (7.5331) | |
Control | Yes | Yes |
Year | Yes | Yes |
Industry | Yes | Yes |
Province | Yes | Yes |
Constant | -15.1291*** | -15.8413*** |
(-18.0303) | (-16.9232) | |
Observations | 3118 | 3118 |
Pesudo R² | 0.1904 | 0.1780 |
Note: ***、** and * respectively represent the significant levels of 1%, 5%, and 10%. The T statistic is in parentheses (T = (x - μ) / (s / √n)).
4.3. Mechanism Test and Heterogeneity Analysis
Drawing upon the theoretical insights and empirical data discussed earlier, it becomes apparent that the certification of enterprises as high-tech entities can influence their innovative processes, both directly and indirectly. This portion of the paper methodically explores these underlying pathways.
4.3.1. Direct Benefits
The direct benefits primarily stem from the tax incentives, R&D subsidies, and bank credit that enterprises can obtain to support their innovation activities. This paper uses the formula TaxPref = Tax * (25%/r - 1)/EBITDA [27] to measure the degree of tax preference for high-tech enterprises, where r is the current income tax rate of the certified enterprise, and 25% is the unified corporate income tax rate in China. Subtracting 1 from the ratio of the two yields the proportion of the preferential tax rate obtained by the enterprise, which is then multiplied by its current income tax expenditure to obtain the specific tax incentive amount, finally adjusted by its EBITDA. R&D subsidies (LnSubsidy) represent the total subsidies received by a company for research and development. Bank credit (Ldebt) is the amount of long-term borrowing of a company. Specifically, based on the baseline model (1), this paper establishes the following mediation model to test hypothesis one.
Directit = α + βHTEit + β’Xit + Σ + εit (7)
LnPatentit = α + β1Directit + βHTEit + β’Xit + Σ + εit (8)
LnInventionit =α + β1Directit + βHTEit + β’Xit + Σ + εit (9)
Directit generates the summary of direct benefits obtained by high-tech enterprise i in year t, including tax incentives, R&D subsidies, and bank credit. The definitions of other variables are consistent with the previous text. Table 8 reports the test results. It can be observed from the table that high-tech enterprise certification significantly improves the tax incentives and R&D subsidies of enterprises but does not affect bank credit. For tax incentives and R&D subsidies, the coefficient β1 in equations (8) and (9) is significant and positive, with the value of β being lower than that in equation (1). This indicates the existence of direct (beneficial) support, primarily through tax incentives and R&D subsidies. The insignificance of bank credit reflects that the Chinese financial market has not yet been able to meet the needs of high-tech enterprises.
Based on the above arguments, hypothesis 1 is established.
Table 6: Mechanism Test: Direct Benefits
Tax Incentives | R&D Subsidies | |||||
Taxpref | LnPatent | LnInvention | Subsidy | LnPatent | LnInvention | |
HTE | 0.2904*** | 5.7100*** | 2.4234*** | 1.2407*** | -5.3988*** | -1.0672*** |
(4.9538) | (6.8444) | (9.7592) | (14.2104) | (-4.7952) | (-3.0513) | |
Direct | 0.8087** | 0.3551*** | 0.7472*** | 0.2355*** | ||
(2.2240) | (2.6788) | (7.9637) | (8.4017) | |||
Control | Yes | Yes | Yes | Yes | Yes | Yes |
Year | Yes | Yes | Yes | Yes | Yes | Yes |
Industry | Yes | Yes | Yes | Yes | Yes | Yes |
Province | Yes | Yes | Yes | Yes | Yes | Yes |
Constant | 0.9740*** | -40.4755*** | -14.8409*** | -11.6825*** | -152.7515*** | -43.5093*** |
(3.9877) | (-9.9366) | (-11.2152) | (-11.7392) | (-18.1375) | (-17.4380) | |
Observations | 19797 | 19797 | 19797 | 19797 | 19797 | 19797 |
Pesudo R² | 0.0228 | 0.0239 | 0.0314 | 0.1695 | 0.0268 | 0.0349 |
Note: ***、** and * respectively represent the significant levels of 1%, 5%, and 10%. The T statistic is in parentheses (T = (x - μ) / (s / √n)).
4.3.2. Indirect Benefits
To verify hypothesis two, this study selects R&D capital and R&D personnel input as alternative variables for testing.
InDirectit = α + βHTEit + β’Xit + Σ + εit (10)
LnPatentit = α + β1InDirectit + βHTEit + β’Xit + Σ + εit (11)
LnInventionit =α + β1InDirectit + βHTEit + β’Xit + Σ + εit (12)
Here, InDirectit generates the summary of indirect benefits obtained by high-tech enterprise i in year t, derived from the intensity of R&D investment (RDC, R&D capital/operating income) and the proportion of R&D technical personnel (RDP, number of R&D technical personnel/total number of employees). The definitions of other variables are consistent with the previous text. According to the test results in Table 7, high-tech enterprise certification significantly improves the intensity of R&D investment and the proportion of R&D technical personnel. In other words, high-tech enterprise certification enhances the enthusiasm of enterprises to engage in more technological innovation activities.
Based on the above arguments, hypothesis 2 is established.
Table 7: Mechanism Test: Indirect Benefits
R&D Investment Intensity | Proportion of R&D Technical Personnel | |||||
RDC | LnPatent | LnInvention | RDP | LnPatent | LnInvention | |
HTE | 1.1195*** | 2.1436*** | 1.6957*** | 3.5117*** | 4.0064*** | 2.1882*** |
(16.5889) | (2.6758) | (7.0503) | (13.5622) | (4.7769) | (8.6010) | |
InDirect | 1.2355*** | 0.2609*** | 0.1556*** | 0.0246* | ||
(5.8209) | (4.3823) | (3.0915) | (1.7876) | |||
Control | Yes | Yes | Yes | Yes | Yes | Yes |
Year | Yes | Yes | Yes | Yes | Yes | Yes |
Industry | Yes | Yes | Yes | Yes | Yes | Yes |
Province | Yes | Yes | Yes | Yes | Yes | Yes |
Constant | -7.8590*** | -160.5360*** | -46.2037*** | -107.6119*** | -161.2720*** | -46.4158*** |
(-2.08) | (-34.99) | (-33.89) | (-25.75) | (-35.20) | (-34.43) | |
Observations | 19797 | 19797 | 19797 | 19797 | 19797 | 19797 |
Pesudo R² | 0.1772 | 0.0267 | 0.0345 | 0.1668 | 0.0265 | 0.0344 |
Note: ***、** and * respectively represent the significant levels of 1%, 5%, and 10%. The T statistic is in parentheses (T = (x - μ) / (s / √n)).
4.3.3. Further Analysis - The Impact of Enterprise Heterogeneity on the Effectiveness of High-Tech Enterprise Certification
To investigate hypothesis three, the influence of enterprise heterogeneity on the implementation of high-tech enterprise certification policy, the following empirical analysis was conducted. Firstly, the interaction between the dummy variable for enterprise ownership (state-owned or private) (State) and the dummy variable for high-tech enterprise certification was examined. Secondly, this study tested the interaction between the dummy variable for equity incentives (EqIn; 1 if there are equity incentives, 0 otherwise) and the dummy variable for high-tech enterprise certification. Thirdly, the Herfindahl-Hirschman Index (HHI) was calculated based on the company’s operating income. HHI is an indicator of industry concentration, with a larger index indicating greater industry concentration and lower market competition levels. The interaction between HHI and the dummy variable for high-tech enterprise certification was tested. Table 8 lists all the results.
Table 8: Heterogeneity Analysis Results
Ownership | Equity Incentive | Market Competitiveness | ||||
LnPatent | LnInvention | LnPatent | LnInvention | LnPatent | LnInvention | |
HTE | 7.5603*** | 2.1381*** | 4.8758*** | 2.2125*** | 16.4461*** | 5.4467*** |
(8.0255) | (7.9847) | (5.3447) | (8.1501) | (20.7007) | (22.2947) | |
State*HTE | -3.5929*** | 0.7112** | ||||
(-2.7935) | (2.2659) | |||||
EqIn*HTE | 3.0184*** | 0.8796*** | ||||
(3.0977) | (3.1609) | |||||
HHI*HTE | -0.2669*** | -0.0818*** | ||||
(-5.5907) | (-5.2441) | |||||
Control | Yes | Yes | Yes | Yes | Yes | Yes |
Year | Yes | Yes | Yes | Yes | Yes | Yes |
Industry | Yes | Yes | Yes | Yes | Yes | Yes |
Province | Yes | Yes | Yes | Yes | Yes | Yes |
Constant | -43.0761*** | -46.6561*** | -162.2955*** | -46.6237*** | -140.8894*** | -40.1816*** |
(-10.5308) | (-18.4019) | (-18.8978) | (-18.3883) | (-17.8366) | (-17.8905) | |
Observations | 19797 | 19797 | 19797 | 19797 | 19797 | 19797 |
Pesudo R² | 0.0240 | 0.0343 | 0.0265 | 0.0344 | 0.0188 | 0.0259 |
Note: ***、** and * respectively represent the significant levels of 1%, 5%, and 10%. The T statistic is in parentheses (T = (x - μ) / (s / √n)).
The analysis of the data leads to several key findings. Initially, it is evident that across all examined groups, a high-tech enterprise designation correlates positively and significantly with enhanced innovation within corporations. In line with the anticipations set forth by the third hypothesis, three specific insights emerge: To begin, the interaction between a company's ownership structure and its high-tech enterprise status shows a notable and negative coefficient. This suggests that, relative to state-owned entities, private firms benefit more substantially from high-tech certification in terms of innovation stimulation. Next, the interaction between the implementation of equity-based incentives and high-tech certification reveals a positive and significant coefficient, indicating that firms with equity incentives are better positioned to leverage high-tech certification for improving their innovation output. Lastly, the analysis of the interaction between market competition (measured by the HHI) and high-tech certification yields a significant negative coefficient, demonstrating that companies in more competitive industries experience a stronger enhancement in innovation due to high-tech certification.
These findings collectively affirm the validity of the third hypothesis.
5. Conclusion
5.1. Research Conclusion
The role of corporate innovation as a key area of interest for both policy makers and scholars is well acknowledged. This research leverages the guidelines from the "Management Measures" enacted in 2008 to examine patent application trends among Chinese firms, specifically excluding entities suspected of inflating their research and development efforts. It was discovered that the High-tech Enterprise (HTE) certification notably encourages innovative activities within Chinese companies, particularly enhancing the generation of invention patents. Furthermore, this study sheds light on the dynamics through which HTE certification drives innovation, highlighting both direct incentives and indirect advantages. Additionally, the investigation reveals that variables such as company ownership, the presence of equity incentives, and the level of competition within the industry play crucial roles in determining the impact of High-tech Enterprise certification on innovation.
5.2. Policy Recommendations
The findings from this research underscore the significant influence that the High-tech Enterprise certification policy has on fostering innovation within corporations. Initially, it is evident that while the policy indeed facilitates innovation among authentic high-tech firms, its efficacy is diminished by the presence of entities masquerading as high-tech enterprises. To address this, it is imperative to refine the criteria and processes for certification to accurately evaluate a company's innovative potential and minimize the opportunities for misrepresenting research and development efforts. Moreover, there's a necessity for improved ongoing oversight and evaluation to promptly identify and mitigate the effects of inauthentic high-tech enterprises, ensuring a fair distribution of resources in the marketplace. Furthermore, the strategic deployment of policies, including tax breaks and subsidies for research and development, must be judiciously managed to bolster both the internal capabilities and the external conditions favorable to corporate innovation. Essentially, reinforcing the ethos of self-driven innovation within companies is crucial. Additionally, tailoring policies to fit the distinct attributes of enterprises suggests that adaptability in policy application, acknowledging the diversity among private and state-owned entities, is crucial for effectiveness. Lastly, the evolution of China's financial markets plays a vital role. Enhancing investor comprehension and support for corporate innovative endeavors is key to cultivating an environment conducive to widespread innovation.
5.3. Research Reflection
The insights gained from this analysis prompt several considerations for ongoing scholarly inquiry. Initially, the reliance on patent records as the sole indicator of a company's innovativeness is acknowledged as potentially limiting, highlighting the need for a more encompassing metric to gauge corporate creativity and innovation. Additionally, the relationship between macroeconomic factors and their effects on individual entities presents a nuanced area of study. Despite efforts to decode this complexity in the present study, a more refined method for measuring both the direct and ancillary benefits is warranted. Furthermore, the methodology that excludes entities obtaining certification post-2010 might unintentionally overlook genuinely innovative firms. Thus, a critical objective for subsequent research is the development of more precise techniques for distinguishing between genuine innovation and manipulative practices in research and development efforts.
References
[1]. Jiang, L. C. (2008). On the technical innovation in the development process of Chinese small and medium-sized enterprises—Problems and strategic choices. Journal of Guiyang College (Natural Science Edition), 3(04), 16-23. DOI: 10.16856/j.cnki.52-1142/n.2008.04.005.
[2]. Shi, B., & Fang, J. H. (2022). Evaluation of the innovation effect of “high-tech enterprise certification”—Based on empirical evidence from fuzzy breakpoint regression. Journal of Shanghai Business School, 23(02), 60-74. DOI: 10.19941/j.cnki.cn31-1957/f.2022.02.005.
[3]. David, P. A., Hall, B. H., & Toole, A. A. (2000). Is public R&D a complement or substitute for private R&D? A review of the econometric evidence. Research Policy, 29(4-5), 497-529.
[4]. Yu, M. G., Fan, R., & Zhong, H. J. (2016). China’s industrial policy and enterprise technological innovation. China Industrial Economics, No. 345(12), 5-22. DOI: 10.19581/j.cnki.ciejournal.
[5]. Yang, G., Liu, J., Lian, P., & Yan, M. (2017). Tax preferences, R&D manipulation and R&D performance. Economic Research Journal, 52(08), 110-124.
[6]. Xu, L. L. (2017). High-tech enterprise certification, political connections and technological innovation of private enterprises. Management Review, 29(09), 84-94. DOI: 10.14120/j.cnki.cn11-5057/f.2017.09.008.
[7]. Manso, G. (2011). Motivating innovation. The Journal of Finance, 66(5), 1823-1860.
[8]. Dosi, G., Marengo, L., & Pasquali, C. (2006). How much should society fuel the greed of innovators? Research Policy, 35(8), 1110-1121.
[9]. Rao, N. (2016). Do tax credits stimulate R&D spending? The effect of the R&D tax credit in its first decade. Journal of Public Economics, 140, 1-12.
[10]. Duchin, R., Ozbas, O., & Sensoy, B. A. (2010). Costly external finance, corporate investment, and the subprime mortgage credit crisis. Journal of Financial Economics, 97(3), 418-435.
[11]. Hangzhou Science and Technology Bureau, Hangzhou Finance Bureau. (2022). Notice on the issuance of “Several Policy Measures to Build the Preferred Place for the Transfer and Transformation of Scientific and Technological Achievements” (Hangkece [2022] No. 136).
[12]. Dong, Z. Y., & Li, C. M. (2021). Trend and path selection of high-quality development of “specialized and innovative” small and medium-sized enterprises. Reform, No. 332(10), 1-11.
[13]. Frenkel, A. (2000). Can regional policy affect firms’ innovation potential in lagging regions? The Annals of Regional Science, 34(3), 315-341.
[14]. Bertrand, M., & Mullainathan S. (2003). Enjoying the quiet life? Corporate governance and managerial preferences. Journal of Political Economy, 111(5), 1043-1075.
[15]. Deshpandé, R., Farley, J. U., & Webster, F. E. (1993). Corporate culture, customer orientation, and innovativeness in Japanese firms: A quadrad analysis. The Journal of Marketing, 57(1), 23-37.
[16]. Hurley, R. F., & Hult, G. T. M. (1998). Innovation, market orientation, and organizational learning: An integration and empirical examination. The Journal of Marketing, 62(3), 42-54.
[17]. Zheng, S. L. (2014). Institutional comfort and competition for high-tech talents: An analysis based on talent attraction strategies. Journal of Humanities, (09), 106-113. DOI: 10.15895/j.cnki.rwzz.2014.09.034.
[18]. Greve, H. R. (2003). A behavioral theory of R&D expenditures and innovations: Evidence from shipbuilding. Academy of Management Journal, 46(6), 685-702.
[19]. Carman, J. M., & Dominguez, L. V. (2001). Organizational transformations in transition economies: Hypotheses. Journal of Macromarketing, 21(2), 164-180.
[20]. Wu, J., & Tu, R. (2007). CEO stock option pay and R&D spending: A behavioral agency explanation. Journal of Business Research, 60(5), 482-492.
[21]. Atanassov, J. (2013). Do hostile takeovers stifle innovation? Evidence from antitakeover legislation and corporate patenting. The Journal of Finance, 68(3), 1097-1131.
[22]. Wang, Y. B. (2021). Managerial overconfidence, market competition, and corporate innovation behavior [Doctoral dissertation, Jilin University]. DOI: 10.27162/d.cnki.gjlin.2021.000950.
[23]. Zucker, L. G., & Darby, M. R. (2007). Star scientists, innovation and regional and national immigration. National Bureau of Economic Research.
[24]. Cai, Z. M. (2022). The impact of tax incentives for high-tech enterprise certification on corporate innovation output [Doctoral dissertation, Southwestern University of Finance and Economics]. DOI: 10.27412/d.cnki.gxncu.2022.002679.
[25]. Chen, Z., Liu, Z., Serrato, J. C. S., et al. (2018). Notching R&D investment with corporate income tax cuts in China. National Bureau of Economic Research.
[26]. Yang, G. C., Liu, J., Lian, P., et al. (2017). Tax preferences, R&D manipulation and R&D performance. Economic Research Journal, 52(08), 110-124.
[27]. Li, W. J., & Zheng, M. N. (2016). Substantive innovation or strategic innovation?—The impact of macro-industrial policies on micro-enterprise innovation. Economic Research, 51(04), 60-73.
Cite this article
Zan,H. (2024). Research on the Impact of High-Tech Enterprise Certification Policy on Corporate Technological Innovation: An Empirical Study Based on Listed Company Data. Advances in Economics, Management and Political Sciences,87,9-23.
Data availability
The datasets used and/or analyzed during the current study will be available from the authors upon reasonable request.
Disclaimer/Publisher's Note
The statements, opinions and data contained in all publications are solely those of the individual author(s) and contributor(s) and not of EWA Publishing and/or the editor(s). EWA Publishing and/or the editor(s) disclaim responsibility for any injury to people or property resulting from any ideas, methods, instructions or products referred to in the content.
About volume
Volume title: Proceedings of the 2nd International Conference on Management Research and Economic Development
© 2024 by the author(s). Licensee EWA Publishing, Oxford, UK. This article is an open access article distributed under the terms and
conditions of the Creative Commons Attribution (CC BY) license. Authors who
publish this series agree to the following terms:
1. Authors retain copyright and grant the series right of first publication with the work simultaneously licensed under a Creative Commons
Attribution License that allows others to share the work with an acknowledgment of the work's authorship and initial publication in this
series.
2. Authors are able to enter into separate, additional contractual arrangements for the non-exclusive distribution of the series's published
version of the work (e.g., post it to an institutional repository or publish it in a book), with an acknowledgment of its initial
publication in this series.
3. Authors are permitted and encouraged to post their work online (e.g., in institutional repositories or on their website) prior to and
during the submission process, as it can lead to productive exchanges, as well as earlier and greater citation of published work (See
Open access policy for details).
References
[1]. Jiang, L. C. (2008). On the technical innovation in the development process of Chinese small and medium-sized enterprises—Problems and strategic choices. Journal of Guiyang College (Natural Science Edition), 3(04), 16-23. DOI: 10.16856/j.cnki.52-1142/n.2008.04.005.
[2]. Shi, B., & Fang, J. H. (2022). Evaluation of the innovation effect of “high-tech enterprise certification”—Based on empirical evidence from fuzzy breakpoint regression. Journal of Shanghai Business School, 23(02), 60-74. DOI: 10.19941/j.cnki.cn31-1957/f.2022.02.005.
[3]. David, P. A., Hall, B. H., & Toole, A. A. (2000). Is public R&D a complement or substitute for private R&D? A review of the econometric evidence. Research Policy, 29(4-5), 497-529.
[4]. Yu, M. G., Fan, R., & Zhong, H. J. (2016). China’s industrial policy and enterprise technological innovation. China Industrial Economics, No. 345(12), 5-22. DOI: 10.19581/j.cnki.ciejournal.
[5]. Yang, G., Liu, J., Lian, P., & Yan, M. (2017). Tax preferences, R&D manipulation and R&D performance. Economic Research Journal, 52(08), 110-124.
[6]. Xu, L. L. (2017). High-tech enterprise certification, political connections and technological innovation of private enterprises. Management Review, 29(09), 84-94. DOI: 10.14120/j.cnki.cn11-5057/f.2017.09.008.
[7]. Manso, G. (2011). Motivating innovation. The Journal of Finance, 66(5), 1823-1860.
[8]. Dosi, G., Marengo, L., & Pasquali, C. (2006). How much should society fuel the greed of innovators? Research Policy, 35(8), 1110-1121.
[9]. Rao, N. (2016). Do tax credits stimulate R&D spending? The effect of the R&D tax credit in its first decade. Journal of Public Economics, 140, 1-12.
[10]. Duchin, R., Ozbas, O., & Sensoy, B. A. (2010). Costly external finance, corporate investment, and the subprime mortgage credit crisis. Journal of Financial Economics, 97(3), 418-435.
[11]. Hangzhou Science and Technology Bureau, Hangzhou Finance Bureau. (2022). Notice on the issuance of “Several Policy Measures to Build the Preferred Place for the Transfer and Transformation of Scientific and Technological Achievements” (Hangkece [2022] No. 136).
[12]. Dong, Z. Y., & Li, C. M. (2021). Trend and path selection of high-quality development of “specialized and innovative” small and medium-sized enterprises. Reform, No. 332(10), 1-11.
[13]. Frenkel, A. (2000). Can regional policy affect firms’ innovation potential in lagging regions? The Annals of Regional Science, 34(3), 315-341.
[14]. Bertrand, M., & Mullainathan S. (2003). Enjoying the quiet life? Corporate governance and managerial preferences. Journal of Political Economy, 111(5), 1043-1075.
[15]. Deshpandé, R., Farley, J. U., & Webster, F. E. (1993). Corporate culture, customer orientation, and innovativeness in Japanese firms: A quadrad analysis. The Journal of Marketing, 57(1), 23-37.
[16]. Hurley, R. F., & Hult, G. T. M. (1998). Innovation, market orientation, and organizational learning: An integration and empirical examination. The Journal of Marketing, 62(3), 42-54.
[17]. Zheng, S. L. (2014). Institutional comfort and competition for high-tech talents: An analysis based on talent attraction strategies. Journal of Humanities, (09), 106-113. DOI: 10.15895/j.cnki.rwzz.2014.09.034.
[18]. Greve, H. R. (2003). A behavioral theory of R&D expenditures and innovations: Evidence from shipbuilding. Academy of Management Journal, 46(6), 685-702.
[19]. Carman, J. M., & Dominguez, L. V. (2001). Organizational transformations in transition economies: Hypotheses. Journal of Macromarketing, 21(2), 164-180.
[20]. Wu, J., & Tu, R. (2007). CEO stock option pay and R&D spending: A behavioral agency explanation. Journal of Business Research, 60(5), 482-492.
[21]. Atanassov, J. (2013). Do hostile takeovers stifle innovation? Evidence from antitakeover legislation and corporate patenting. The Journal of Finance, 68(3), 1097-1131.
[22]. Wang, Y. B. (2021). Managerial overconfidence, market competition, and corporate innovation behavior [Doctoral dissertation, Jilin University]. DOI: 10.27162/d.cnki.gjlin.2021.000950.
[23]. Zucker, L. G., & Darby, M. R. (2007). Star scientists, innovation and regional and national immigration. National Bureau of Economic Research.
[24]. Cai, Z. M. (2022). The impact of tax incentives for high-tech enterprise certification on corporate innovation output [Doctoral dissertation, Southwestern University of Finance and Economics]. DOI: 10.27412/d.cnki.gxncu.2022.002679.
[25]. Chen, Z., Liu, Z., Serrato, J. C. S., et al. (2018). Notching R&D investment with corporate income tax cuts in China. National Bureau of Economic Research.
[26]. Yang, G. C., Liu, J., Lian, P., et al. (2017). Tax preferences, R&D manipulation and R&D performance. Economic Research Journal, 52(08), 110-124.
[27]. Li, W. J., & Zheng, M. N. (2016). Substantive innovation or strategic innovation?—The impact of macro-industrial policies on micro-enterprise innovation. Economic Research, 51(04), 60-73.