


1. Introduction
International trade plays an indispensable role in the economic framework of any country.. It has a time of growth and decline,At the same time, after the 2008 international financial crisis, the global trade growth rate significantly slowed down due to the sluggish demand in developed countries. According to data from the World Trade Organization (WTO), global trade growth has been below 3% for five consecutive years since 2012, marking the first time since the 1980s. Especially from the fourth quarter of 2014 to the fourth quarter of 2015, global trade volume has shown negative growth for five consecutive quarters [1] For the United States, the exportation of goods that carry a high added value not only serves as a cornerstone for its economic prosperity but also significantly bolsters the nation’s financial health. This capacity to export high-value products is a distinctive advantage for the US, enabling it to maintain a competitive edge in the global market. The array of goods the United States exports is diverse, including advanced technology, sophisticated machinery, and specialized services, all of which demand a premium in international markets and, in turn, generate considerable foreign exchange earnings for the country. In order to explore the impact of this import and export trade on the economy of China and the United States, this article uses relevant data from 2010 to 2023, including the gross domestic product and import and export (expenditure) of China and the United States; The year-on-year growth rate of GDP and imports and exports between China and the United States; US commodity export structure (2022), US commodity import structure (2022); China's export structure of goods (2022), China's import structure of goods (2022); Further research will be conducted on the annual growth rate of the US CPI.
Finally, summarizing the research findings of the entire article, the following suggestions are proposed regarding the impact of China US import and export trade: 1 It can be appropriately guided to change the pattern of international trade. 2. Improve domestic production capacity. 3. The government can make some changes to trade controls and tariffs according to the current economic situation. 4. Reduce reliance on additional products.
Conversely, the import side of the equation for the US predominantly features basic consumer goods. These items range from everyday necessities to various products that cater to the broad needs of the American populace. While these imports are vital for meeting domestic demand and ensuring that consumers have access to a wide variety of goods, there's an inherent vulnerability tied to the cost associated with these imports. Should there be an increase in the cost of these essential imports—due to factors such as global market fluctuations, changes in trade policies, or shifts in currency exchange rates—the immediate repercussion could be an uptick in domestic prices. This scenario of rising import costs poses a significant risk of fueling inflation within the country, which could, in turn, have a dampening effect on economic growth. The rationale for the importance of foreign capacity to U.S. inflation is fairly clear-cut. If, for example, domestic demand exceeded domestic capacity ,while foreign capacity remained underutilized, either the excess domestic demand for goods would be absorbed by imports or profits would be squeezed as labor markets tighten and costs rise [2]. The ripple effects of such inflationary pressures can be far-reaching, potentially eroding purchasing power, discouraging consumer spending, and ultimately, impacting the overall trajectory of the United States’ economic development.
2. Analysis Of The Impact Of Import And Export Trade On The US Economy
The United States is characterized by its trading pattern where the volume of imports consistently surpasses that of exports, as illustrated in Figure 1.
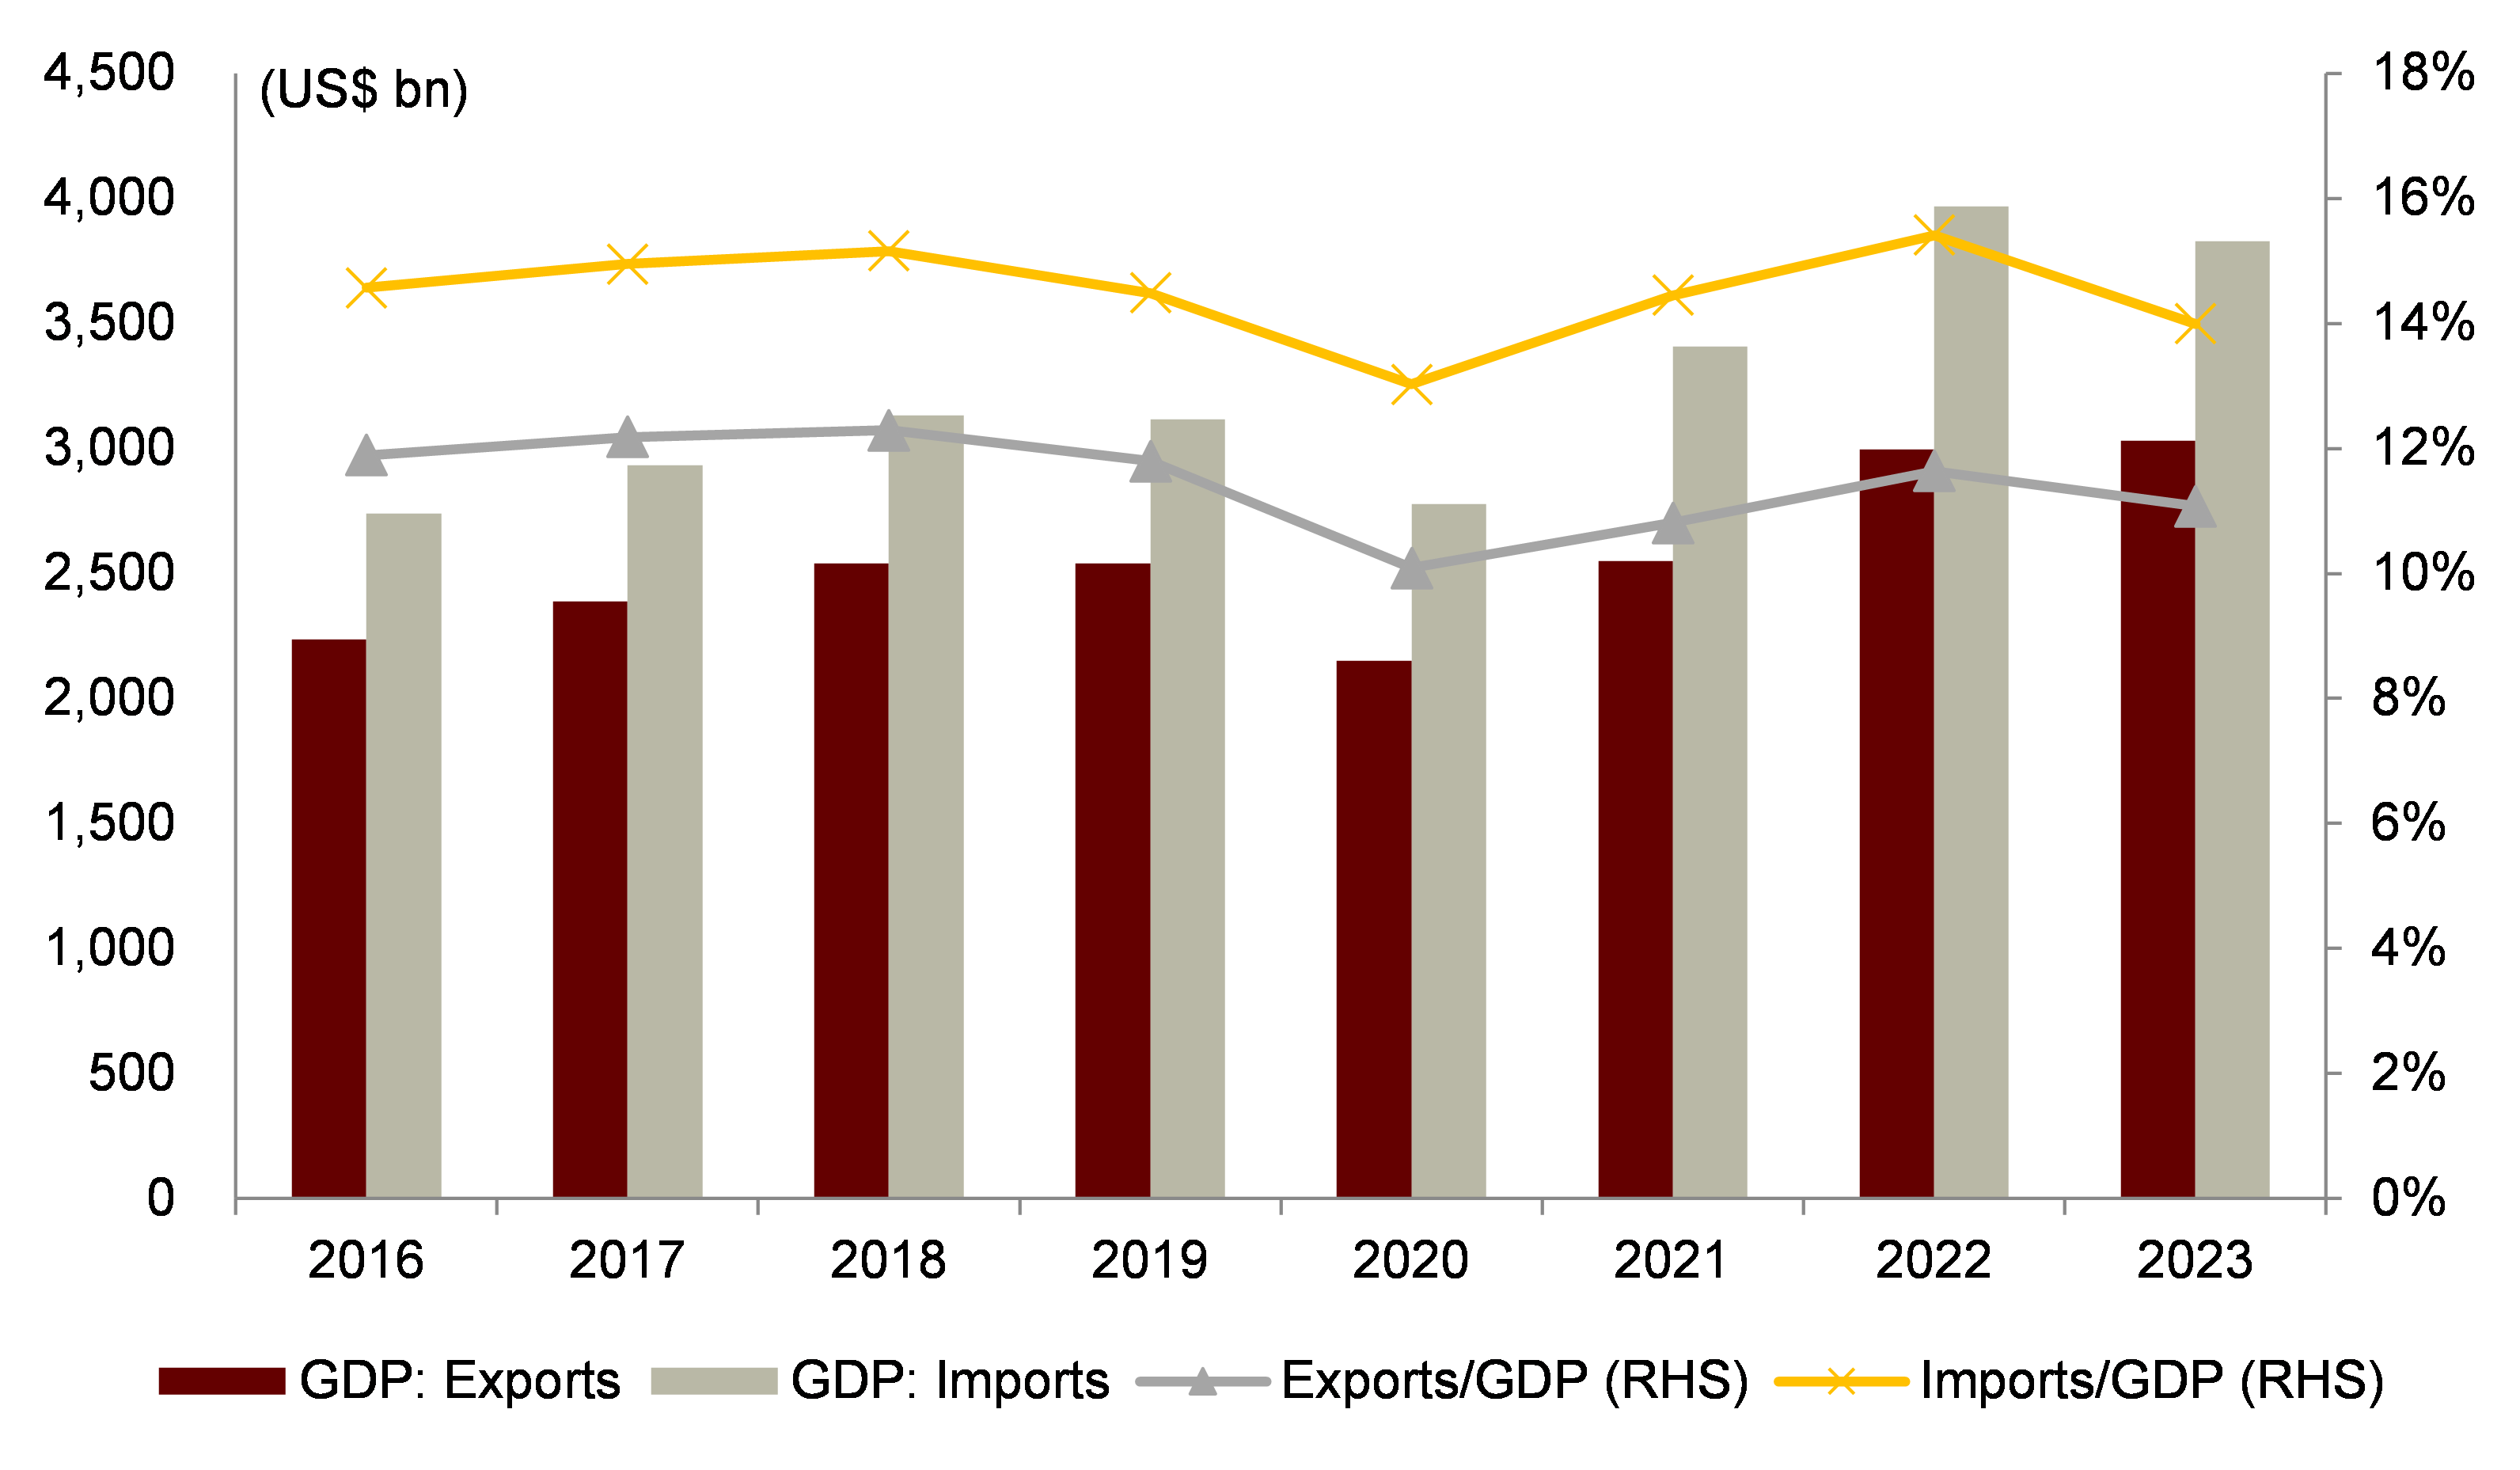
Figure 1: GDP, imports and exports in US (Expenditure)[3]
As shown in Figure 1., from 2016 to 2023, although the value of exports reached its lowest value in 2020, it is still rising steadily overall, The same trend applies to imports, but the overall data is higher than exports. Domestic value added embodied in exports acts as an indicator of export quality, given that it shows countries’ domestic-income content in their exports. The higher it is, exports will have a greater multiplier effect on domestic demand and, thus, on economic growth. Therefore, countries will be in a position to overcome the alternative they generally face between export-led growth or domestic demand-led growth. If the domestic income embodied in exports is high, the export-led growth model will kick-start domestic demand and, from the perspective of demand, growth will be doubly grounded, i.e., both foreign and domestic demand [4]. So for the United States it’s experiences a greater volume of imports compared to exports due to a combination of economic conditions, consumer behavior, and trade policies. As a nation with a high standard of living and a strong currency, the U.S. has a substantial demand for a wide array of products, from luxury goods to basic commodities, which are not always produced domestically. This demand is met through imports, including electronics, clothing, and vehicles, reflecting the diverse needs of American consumers. Additionally, the U.S. economy's shift towards services and high-tech industries means that it imports more labor-intensive manufactured goods from countries where production costs are lower. Trade policies and global supply chain dynamics also contribute to the trade deficit. The U.S. has established trade agreements that facilitate the import of goods to ensure a variety of products for consumers and inputs for businesses. Furthermore, the strength of the U.S. dollar makes imports cheaper and exports more expensive for foreign buyers, which can exacerbate the trade imbalance. This structural aspect of the U.S. economy, along with its role in the global market as a major consumer, results in imports surpassing exports.
Drawing on data from the Bureau of Economic Analysis (BEA) for the year 2023, it's evident that the scale of the United States' trade activities is substantial, with imports reaching 3.8 trillion US dollars (GDP metric) and exports at 3.0 trillion US dollars(GDP metric). These figures account for 14.0% and 11.1% of its GDP respectively. This sizable involvement in international trade underscores the pivotal role that both importing and exporting activities play in the American economy. Moreover, an examination of the growth dynamics of these trade activities reveals that the fluctuations in the rates of growth for both imports and exports exhibit a higher volatility than the overall GDP growth rate, as detailed in Figure 2.
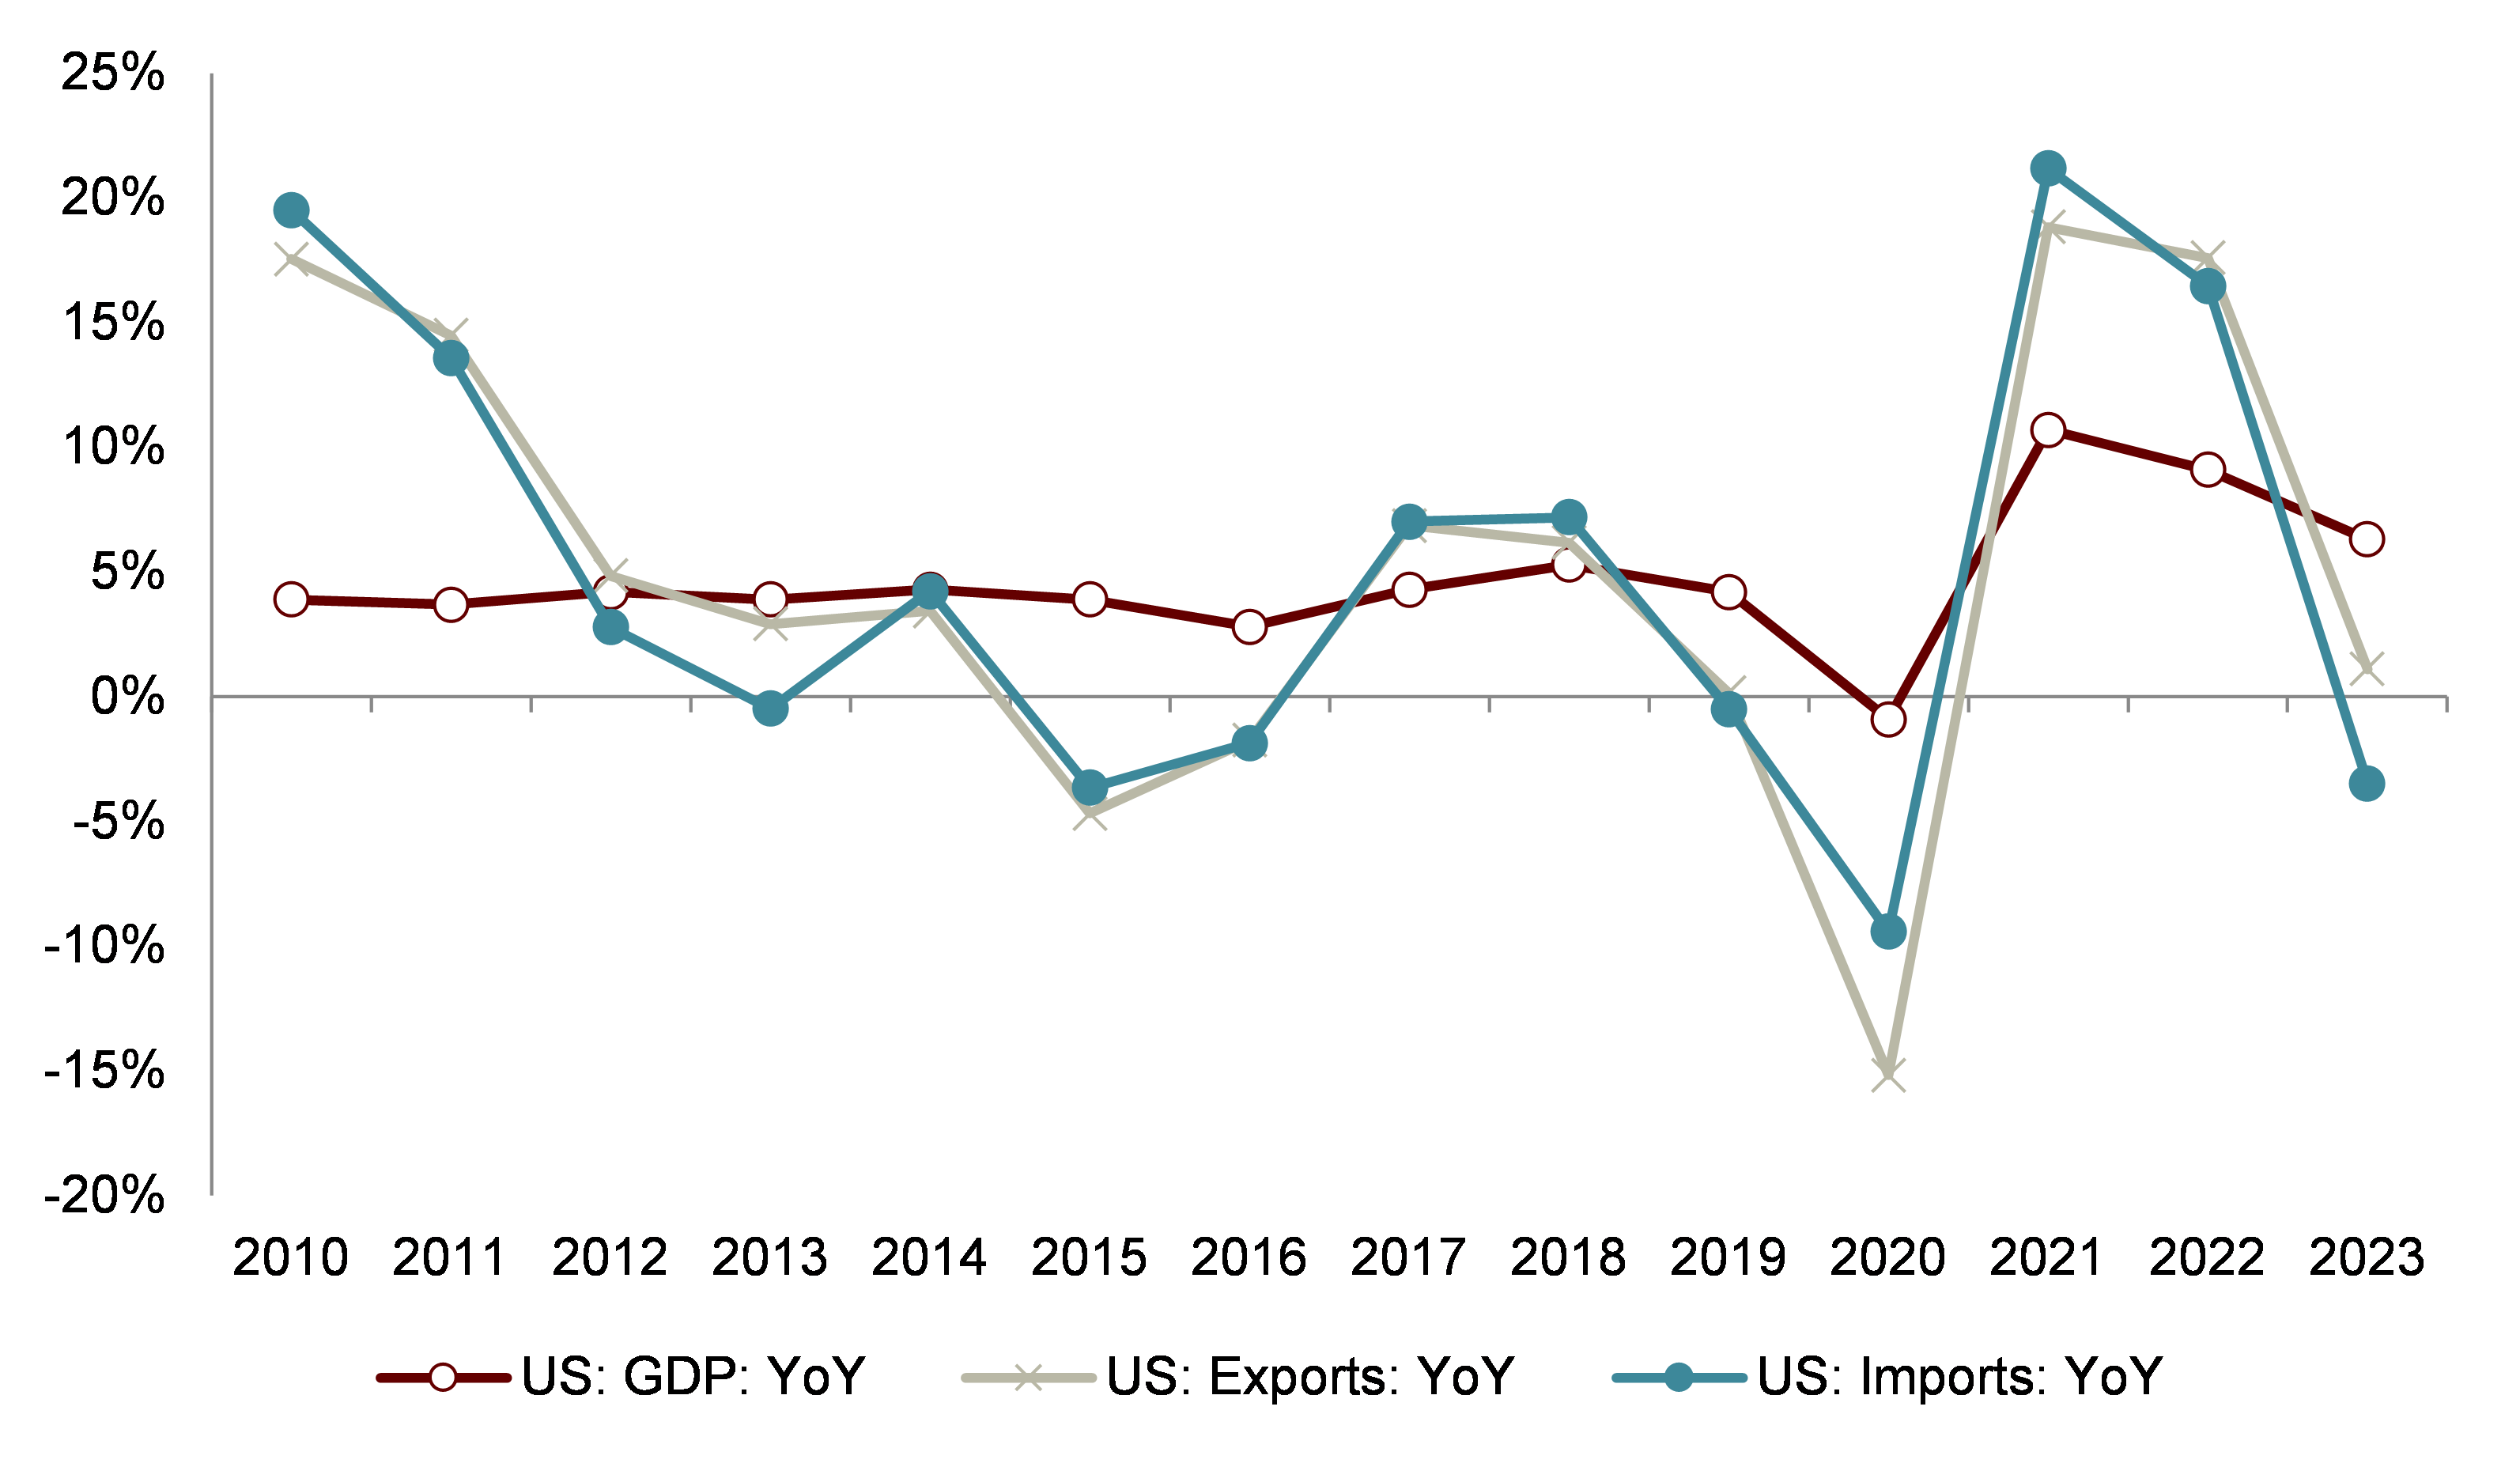
Figure 2: YoY growth rate of GDP, imports and exports in US[5]
As shown in Figure 2, GDP is relatively stable, the exports and imports is large fluctuation, it goes from 20% to -5%. Such volatility is indicative of the profound impact that international trade, encompassing both imports and exports, has on the economic landscape of the United States. These fluctuations suggest that the trade sector acts as a critical lever, capable of influencing economic conditions. It demonstrates that movements within the import and export sectors are not merely reactive to the broader economic trends but are, in fact, influential forces that contribute to shaping the economic trajectory of the nation. This observation highlights the complex interplay between international trade and economic stability, suggesting that the dynamics of trade are integral to understanding the mechanisms of economic growth and contraction within the United States. The export structure of the United States in 2022, as shown by BEA in Figure 3.
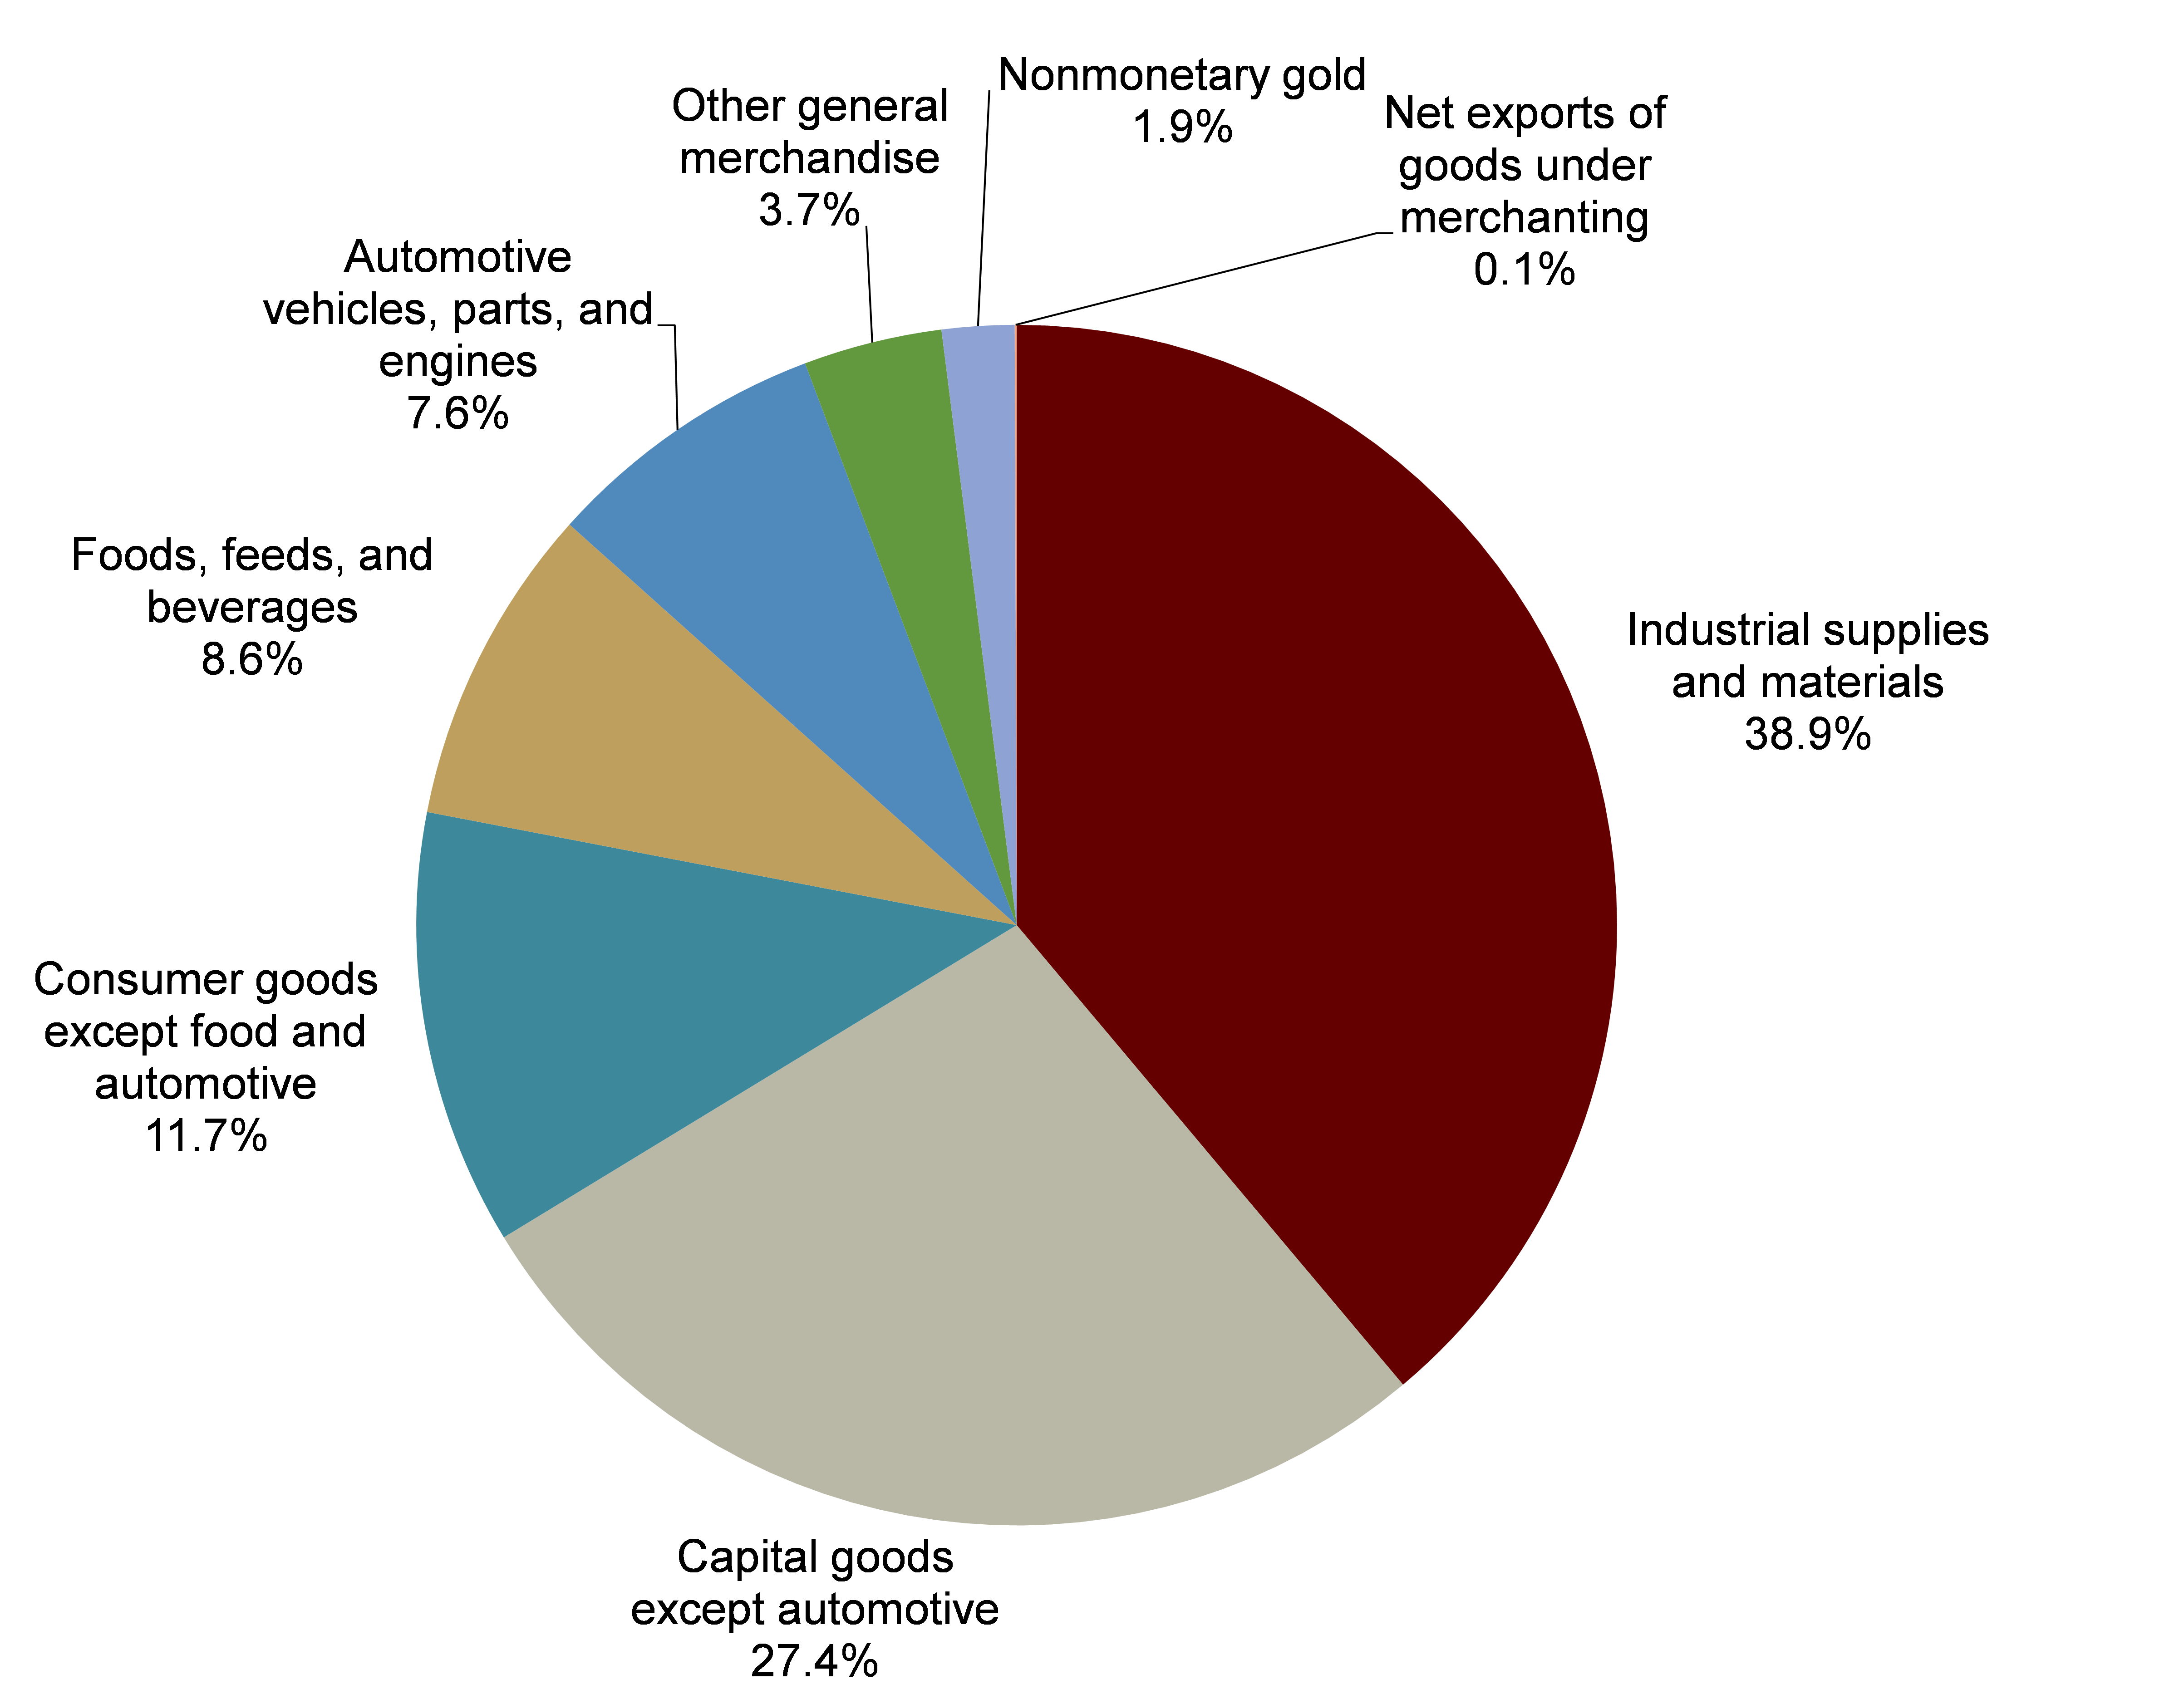
Figure 3: Structure of goods exports in US (2022)[6]
As shown in Figure 3, industrial supplies and materials accounts for the largest percentage, it’s 38.9%. And the smallest one is the Net exports of goods under merchanting, it’s 0.1%. This indicates that industrialization accounts for a large proportion in the local area. Highlights the country's strategic emphasis on Industrial supplies and materials, and Capital goods except automotive. These categories accounted for 38.9% and 27.4% of the total exports, respectively, illustrating the diverse nature of the U.S. export portfolio. Within the Industrial supplies and materials sector, Chemicals except medicinals stood out, comprising about 20% of this segment's exports. This indicates a strong global demand for American chemical products, reflecting the sector's innovation and competitiveness on the international stage.
In the realm of Capital goods except automotive, significant shares were held by exports of Civilian aircraft, engines, and parts; Semiconductors and their parts; and Scientific, hospital, and medical equipment and parts. These accounted for approximately 16.5%, 11.7%, and 9.9% of exports, respectively. The prominence of these high-tech goods in the U.S. export structure underscores the country's advanced technological infrastructure and its leadership in research and development. The U.S. excels in producing complex, high-value products that serve critical roles across various industries worldwide, from aerospace to healthcare and technology.
These sectors not only demonstrate the U.S.'s capability to innovate and lead in science and technology but also highlight its strategic advantage in production capacity and global branding. The substantial profits earned from these high added value goods and services underscore the U.S.'s pivotal role in the global economy, leveraging its technological prowess and innovative capacity to maintain a competitive edge. The United States' import structure, detailed in Figure 4.
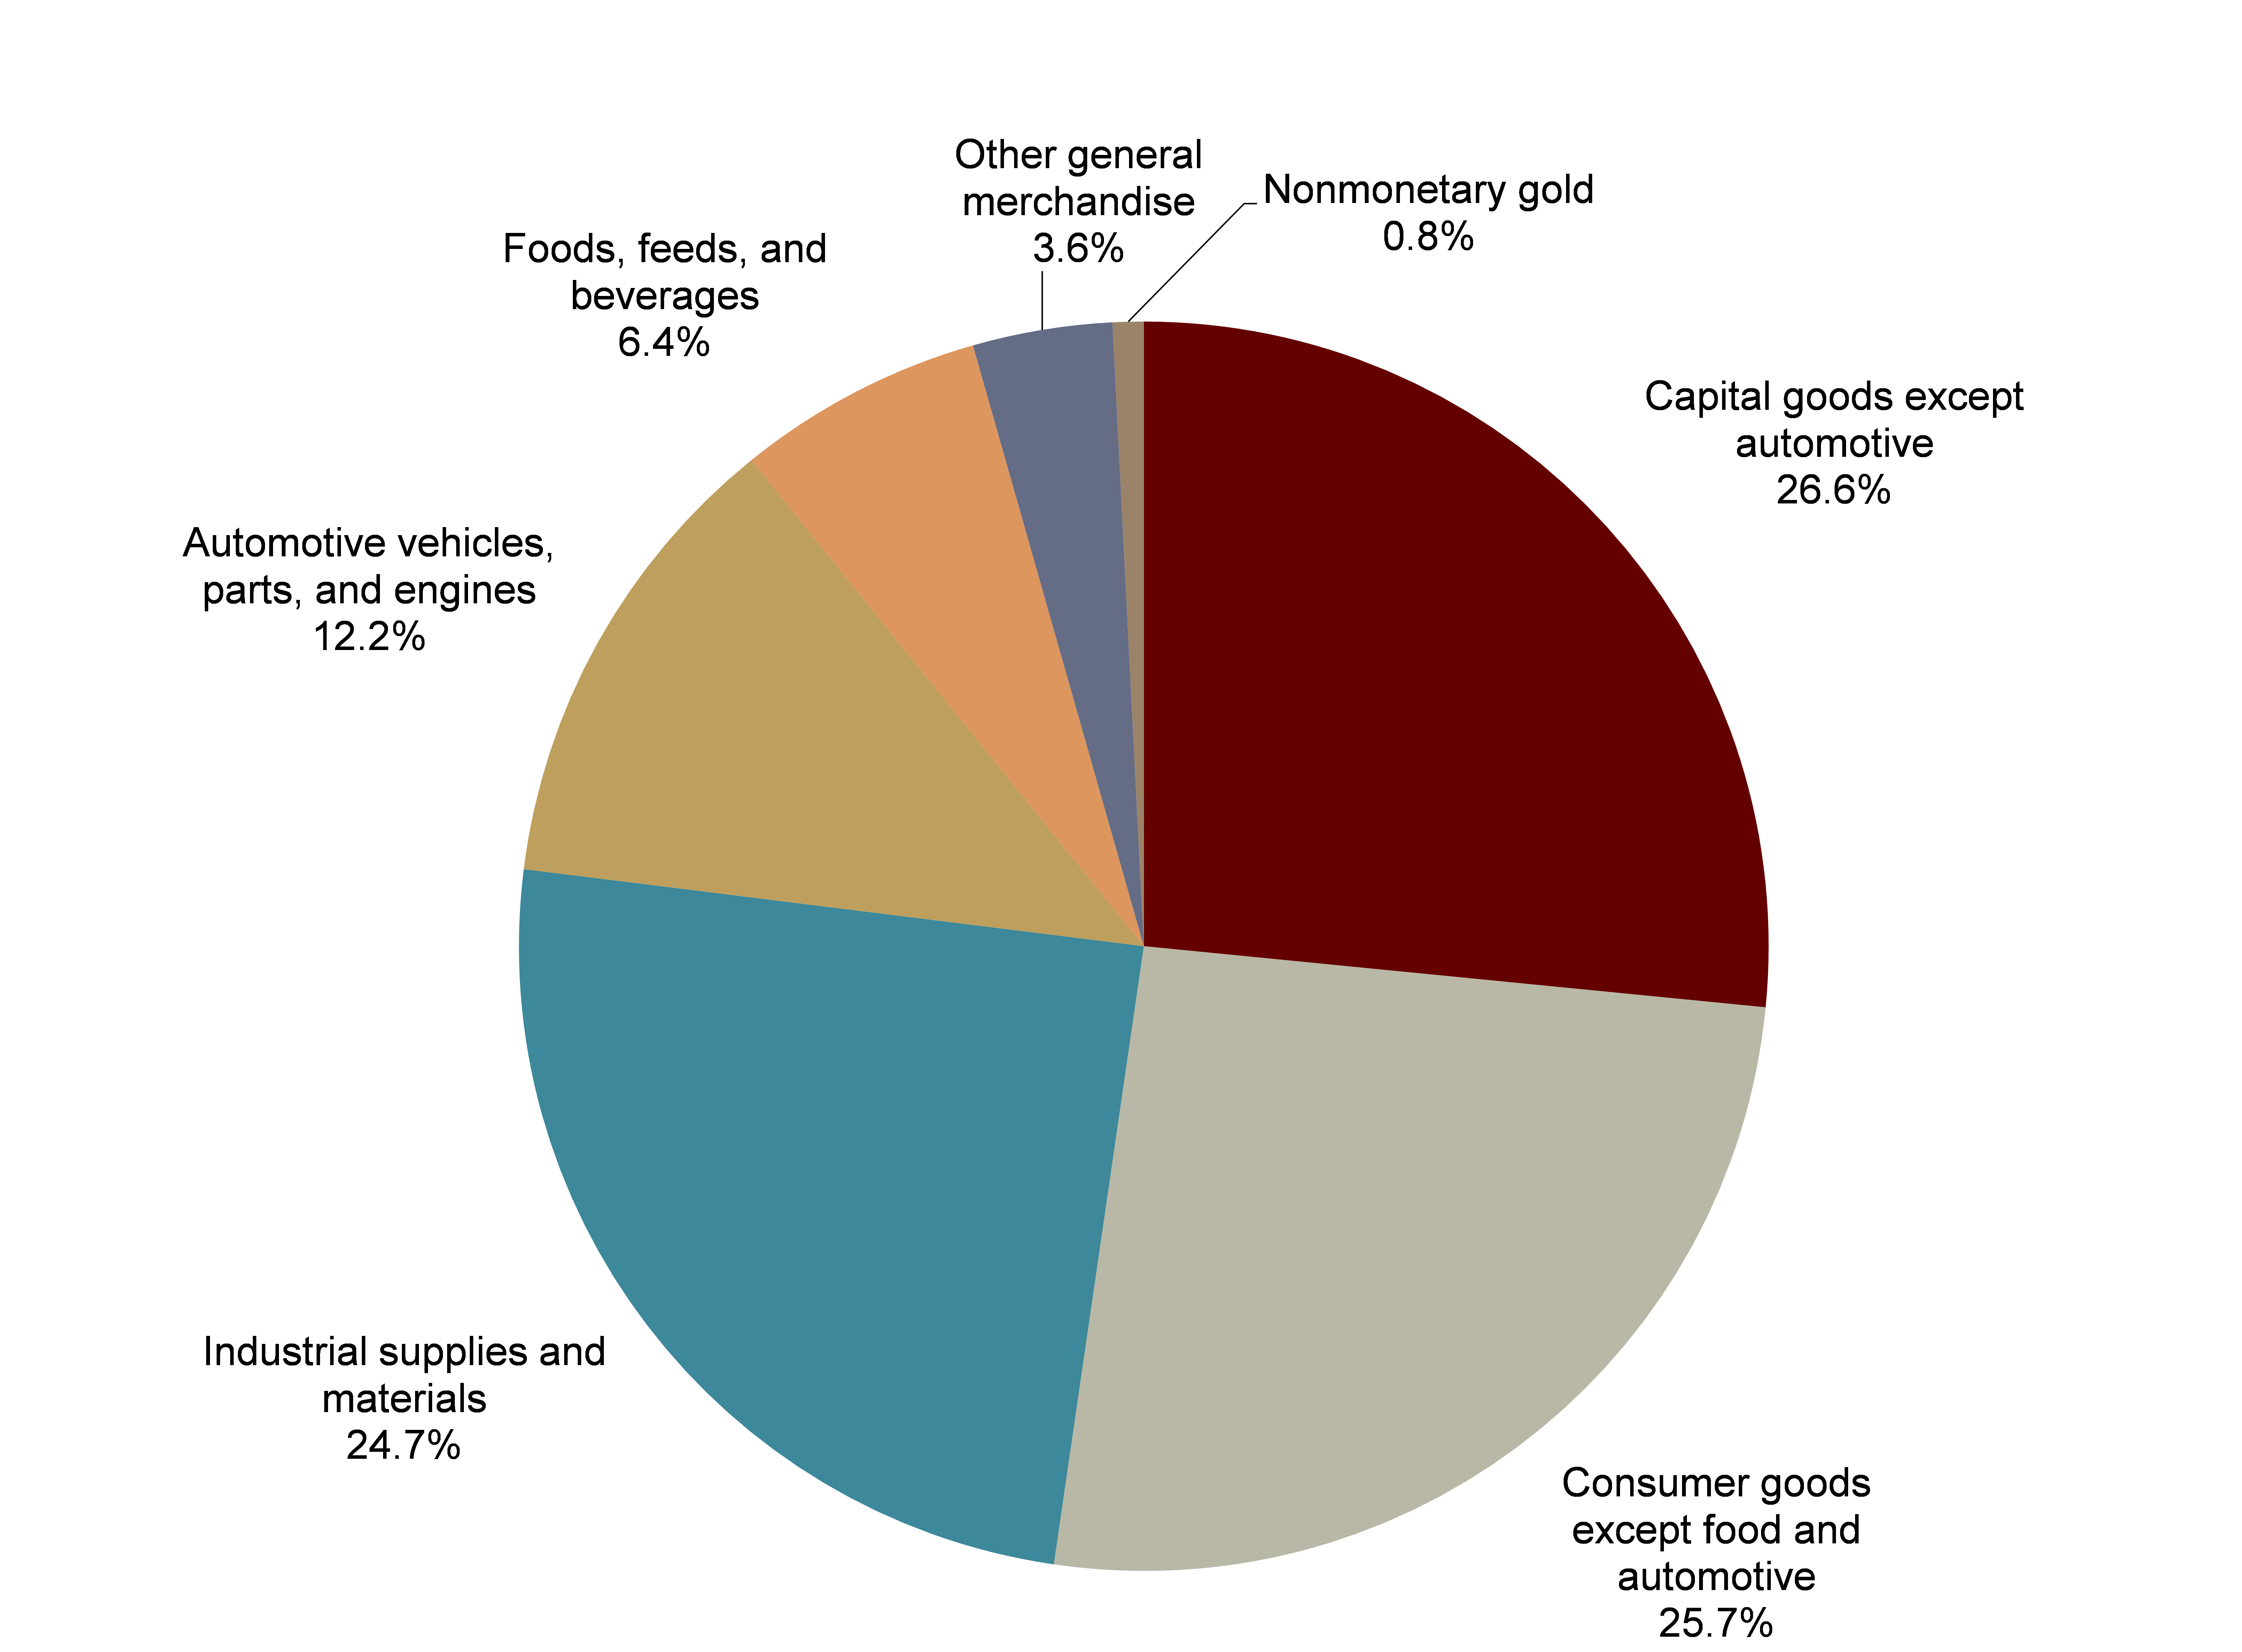
Figure 4: Structure of goods imports in US (2022)[7]
As shown in figure 4, the Consumer goods except food and automotive account for 25.7%. The smallest one is the Nonmonetary gold, it has 0.8%. However, for imports, the Consumer goods except food and automotive and Industrial supplies and materials is very similar.
It shows the structure of goos imports in US. Showcases a significant reliance on three primary categories of goods: Capital goods except automotive, Consumer goods except food and automotive, and Industrial supplies and materials. These imports, accounting for 26.6%, 25.7%, and 24.7% of total imports respectively. Specifically, within the Industrial supplies and materials category, a notable focus is on energy and Metals and nonmetallic products, which represent about 42.1% and 22.4% of this segment. These categories are predominantly comprised of everyday living essentials, light industrial products and energy or materials, which are considered to be lower in added value. These are basic necessities and conveniences that play a fundamental role in daily life, yet are typically produced with less complexity and innovation, reflecting their lower economic value compared to more technologically advanced products.
3. Comparative analysis between China and the US
The rationale behind selecting China for comparison lies in the fact that both China and the United States stand as global trade powerhouses and the world's two largest economies, thus offering a level of comparability. The impact of import and export trade on China's economy significantly diverges from that of the United States. This distinction is rooted in the differing economic structures, policies, and global trade positions of the two countries. While both nations exert considerable influence on international trade dynamics, the nature and outcomes of their trade activities reflect unique economic strategies and priorities, highlighting the contrasting roles they play within the global economy. China is characterized as a country with exports surpassing imports, as depicted in Figure 5.
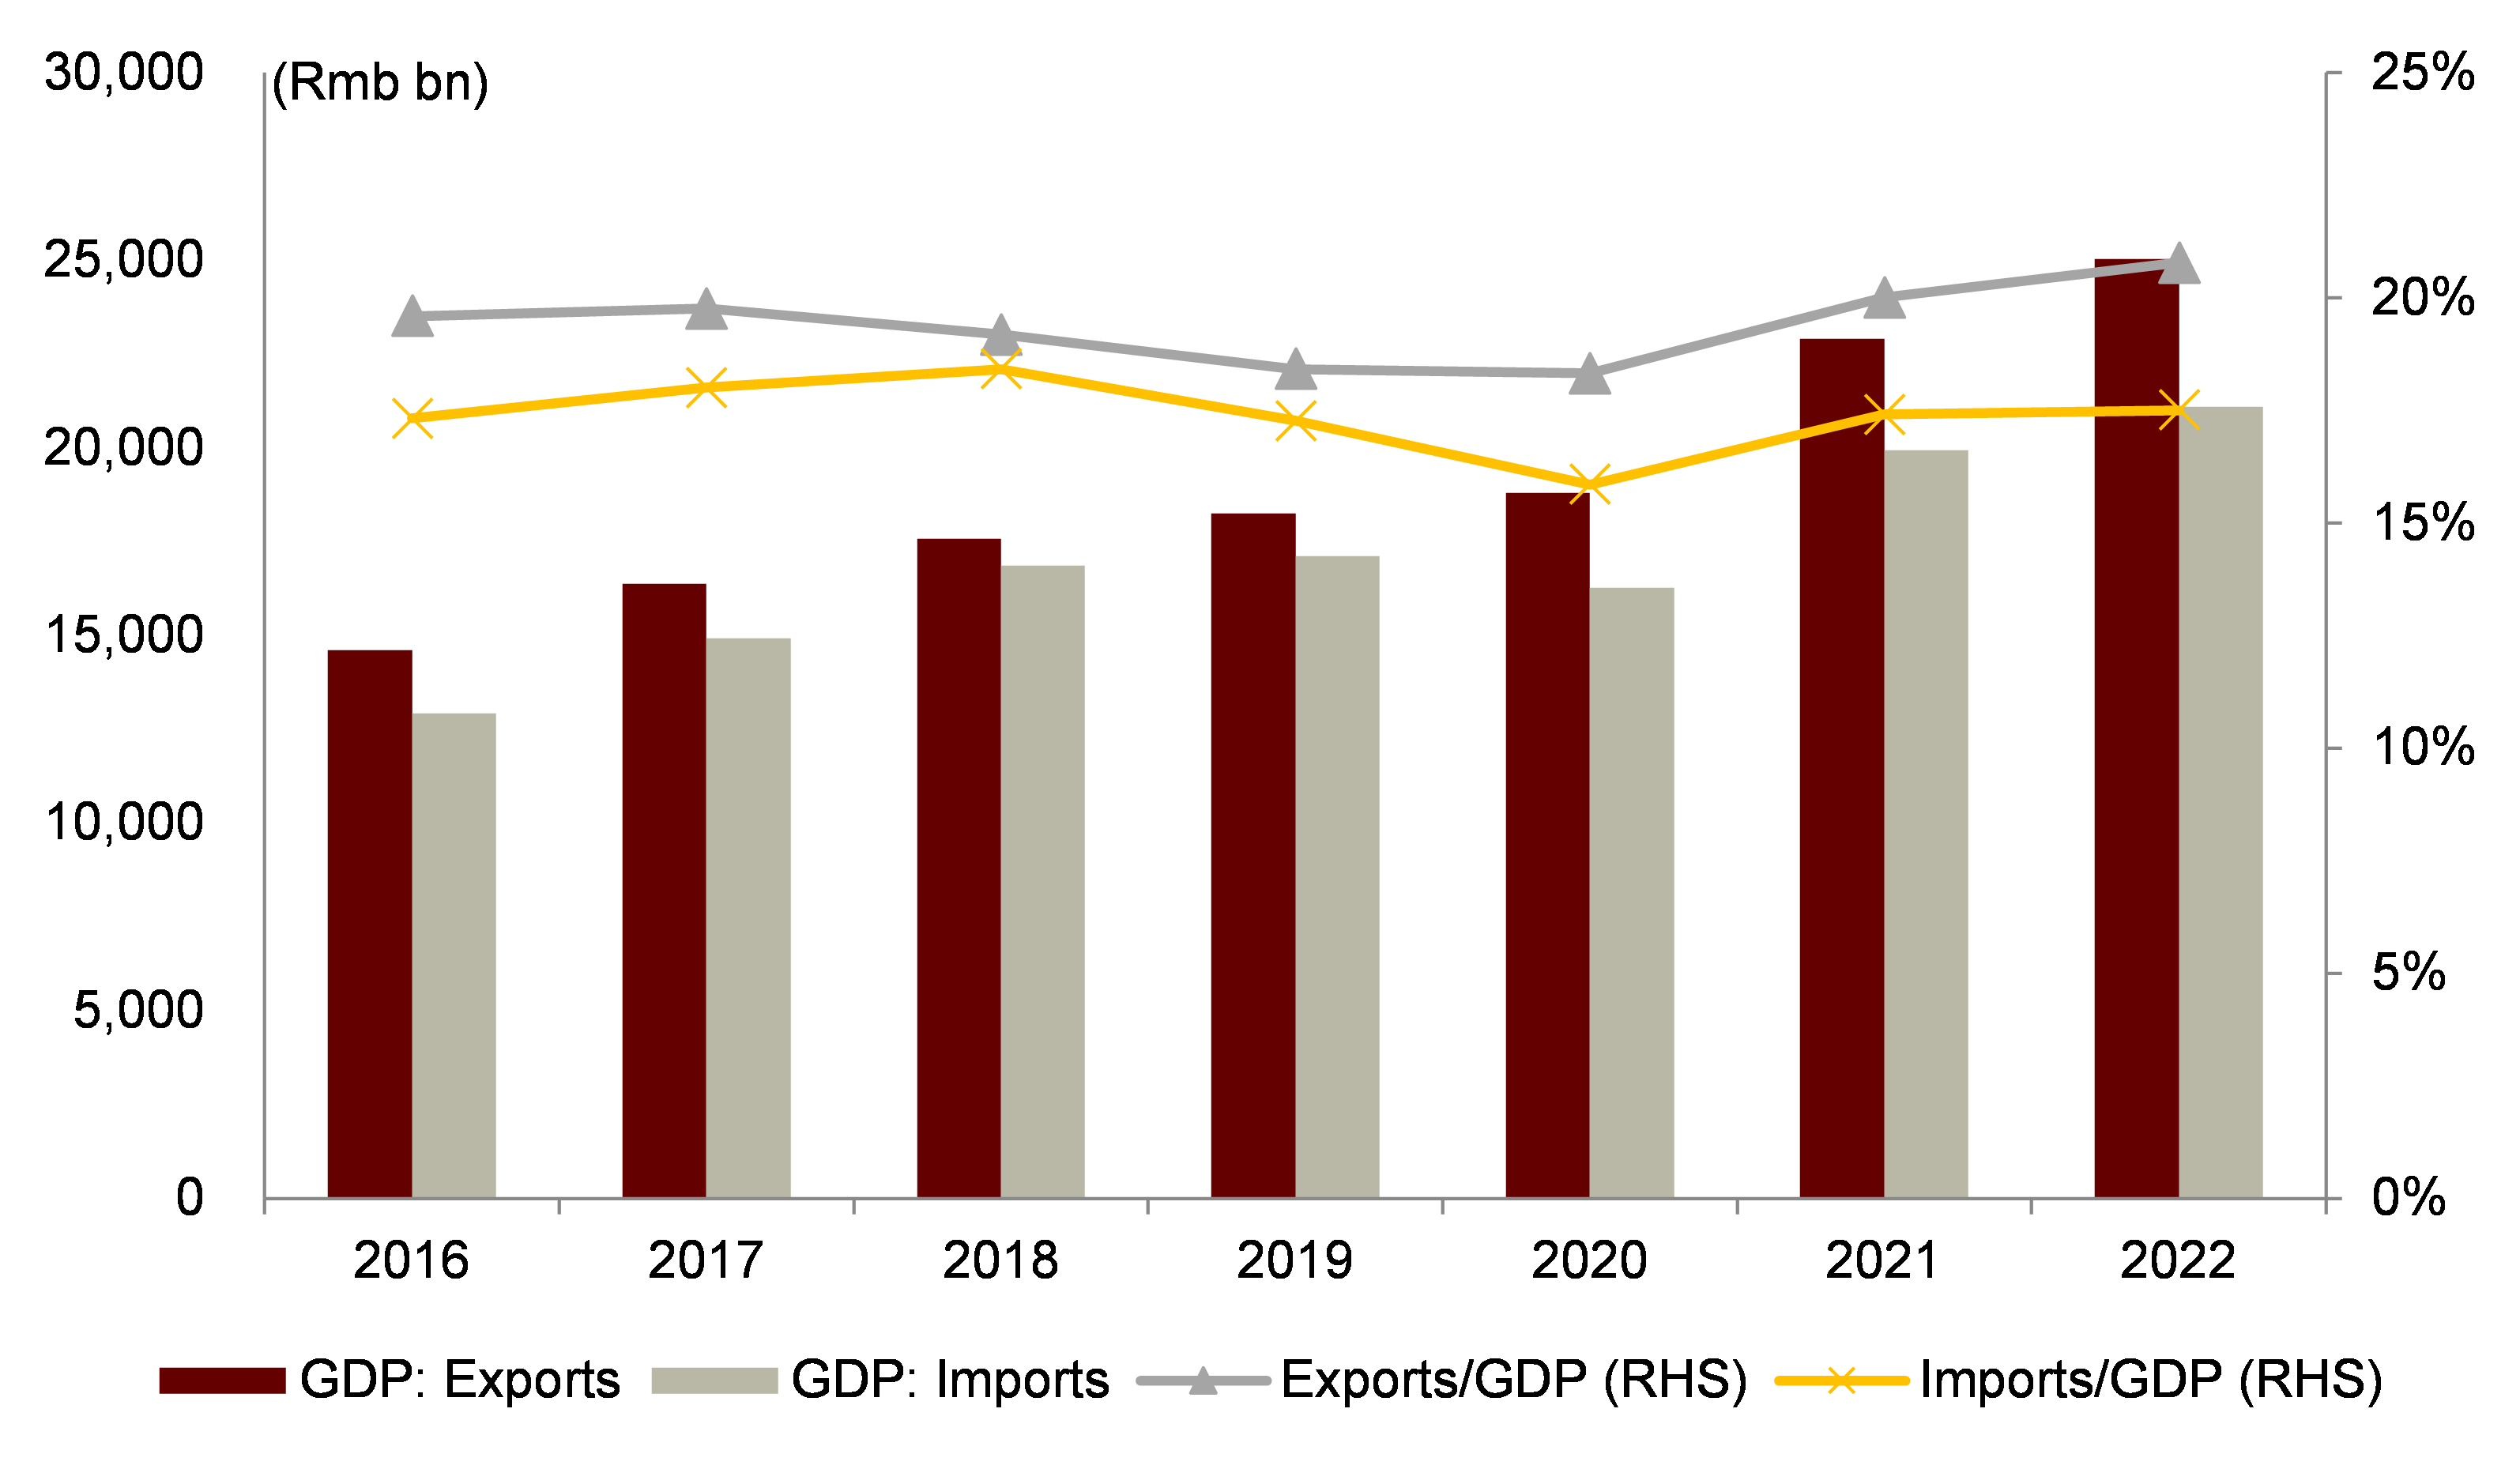
Figure 5: GDP, imports and exports in China(Expenditure)[7]
As shown in figure 5, Exports have been consistently increasing from 2016 to 2023. What’s more, there is a decreasing trend in exports in 2020, but it is not significant, but it is also increasing for the entire process.
China's position as a country with exports exceeding imports is attributed to a multifaceted strategy that harnesses its competitive advantages and robust economic policies. Against the backdrop of trade frictions between China and the United States, China is facing more challenges. Complex political and economic situation, but goods trade remained flat in the first three quarters of 2018. Stable rise. Combining China's comprehensive policy of expanding opening-up, including import tariffs and ports. Import and export policy measures, including business environment and facilitation of cross-border trade. The import and export trade performance of the country is optimistic. After October 2018, due to the global economic landscape. Amidst the current situation of close global trade cooperation, with the decline in energy and the slowdown in global economic growth,
China's import and export trade also experienced a decline from November to December[8]. By capitalizing on its extensive labor force and advanced manufacturing capabilities, China has become known as the "world's factory," offering products at competitive prices that are in high demand globally. The country has effectively focused on industries where it holds comparative advantages, such as textiles, apparel and household appliances, which has significantly boosted its export volumes. Supportive government policies, including subsidies for export-oriented sectors, favorable tax regimes, and substantial investments in infrastructure, have played a pivotal role in enhancing the efficiency and competitiveness of Chinese exports. Additionally, China's active engagement in establishing a strong network of trade relationships worldwide has ensured widespread market access for its products. With a strategic pivot towards higher value-added manufacturing and services, such as technology and renewable energy, China continues to elevate the global standing of its exports. This comprehensive approach has maintained China's export surplus, reinforcing its stature as a dominant force in the global economy. Here we know the structure of China's import and export methods. China's import and export trade work should cooperate with China's supply side structural reform, focusing on the import of advanced equipment and technology. Improve export tax rebate policies, reasonably reduce enterprise tax burden, attach importance to intellectual property protection, and reduce rigid reliance on foreign high-tech products [9].
In the year 2022, under the GDP metric, China's import and export volumes were notably 21.1 trillion yuan and 25 trillion yuan, respectively, constituting 17.5% and 20.8% of its GDP. This data underscores China's significant role in global trade, with a robust export-driven economy that contributes substantially to its economic growth. The substantial difference between its export and import volumes reflects China's strategic economic positioning and its effectiveness in leveraging global markets to bolster its economic strength, further cementing its status as a major player in international trade. Upon examining China's export structure as detailed in Figure 6.
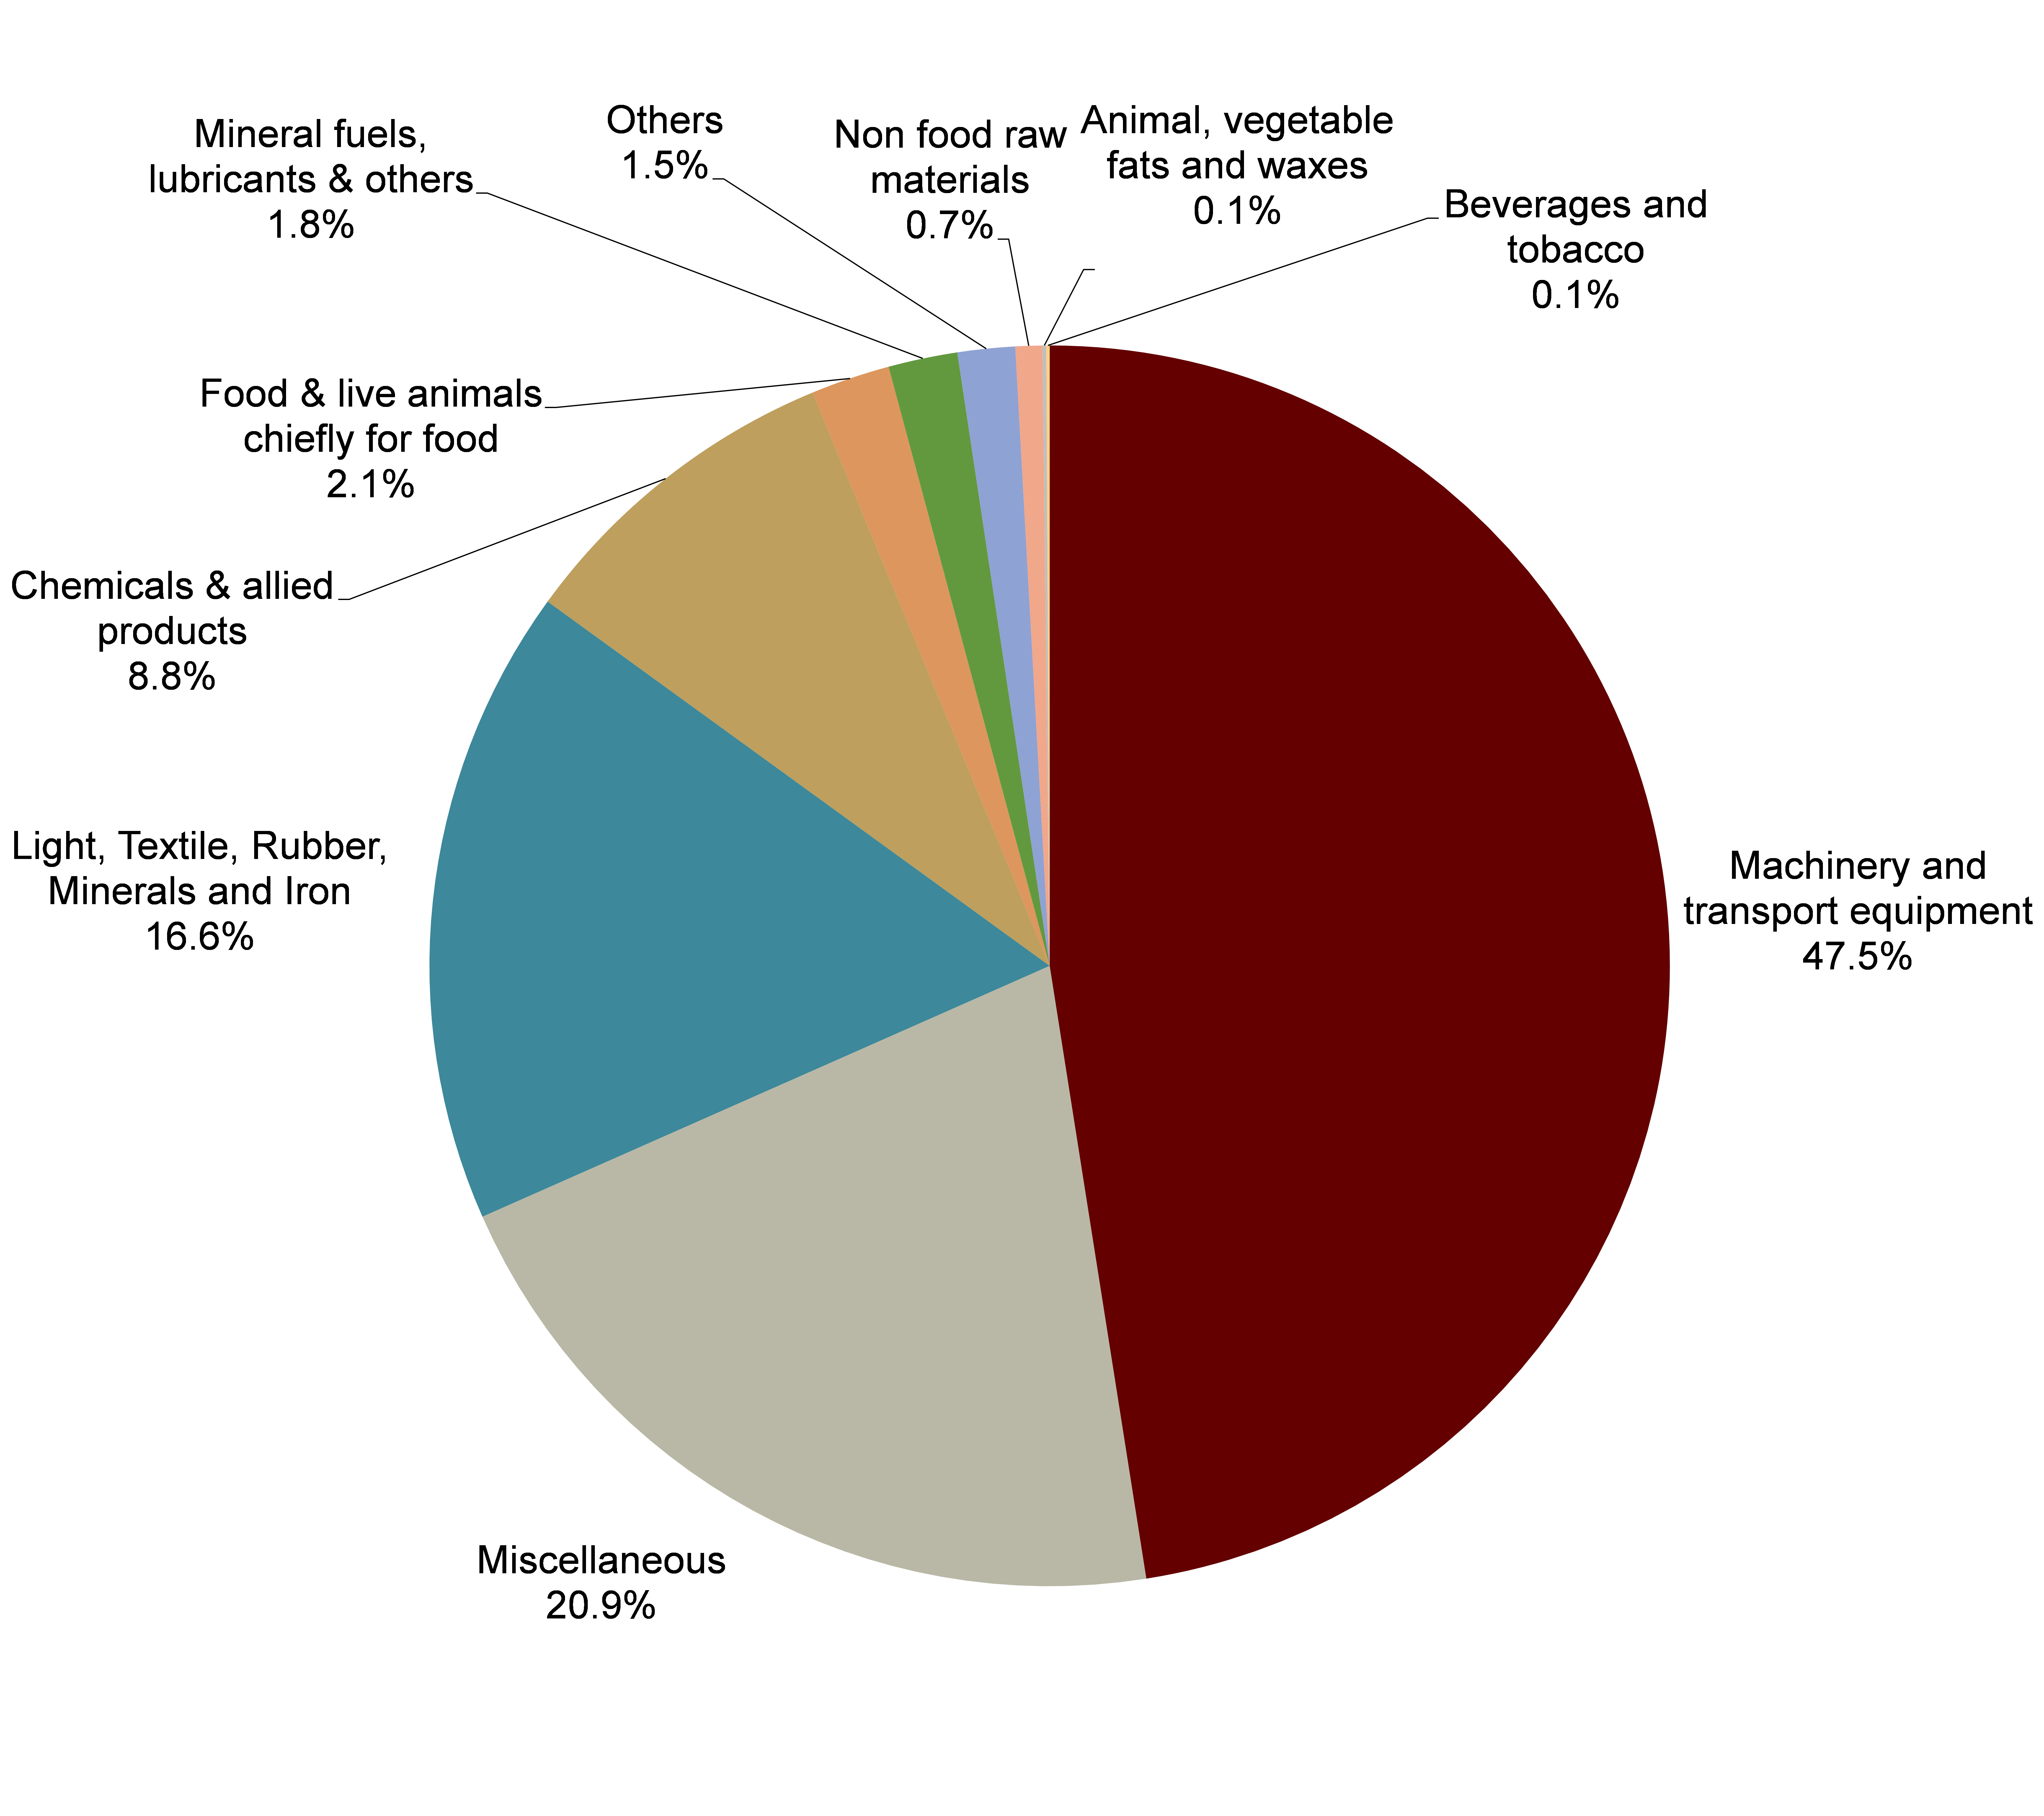
Figure 6: Structure of goods exports in China (2022) [10]
As shown in figure 6, The proportion of Machinery and transport equipment is the largest, accounting for 47.5%, almost half of the pie chart. And the proportion of the smallest two is the same, both are 0.1%, they are Animal,vegetable fats and waxes and Beverages and tobacco ,respectively. It indicates that the Machinery and transport equipment sector relies the most on for exporting goods in China.
It becomes evident that a significant portion of its exports is dominated by sectors such as Light, Textile, Rubber, Minerals, and Iron, which collectively contribute to approximately 16.6% of the total export volume. The products under these categories, encompassing apparel, daily necessities, light industrial items, and essential raw materials, primarily fall into the lower value-added spectrum. This reflects a strategic emphasis on leveraging China's manufacturing strengths in areas where it can produce goods efficiently and cost-effectively for global markets, thereby maintaining its competitive edge in these sectors. Conversely, when analyzing China's import structure shown in Figure 7.

Figure 7: Structure of goods imports in China (2022) [7]
As shown in Figure 7, the largest proportion of imported goods for China is also Machinery and transport equipment. It has 34.6%. But the only one with the least imports is Beverages and tobacco. It just only 0.3%. A stark contrast emerges, with Machinery and transport equipment alone making up a significant 34.6% of total imports. This substantial importation underscores China's reliance on foreign high value-added products, particularly in fields such as science, technology, and software. Despite being a global manufacturing powerhouse, China's need to import these advanced products highlights a strategic approach to fulfilling its domestic requirements for high-tech equipment and technological innovation. One of the reasons is that, Although China's import and export trade volume has grown rapidly, the goods it exports are mostly light industrial products with a relatively low overall level and a relatively simple export product structure. This means that these exported goods do not have high technological support. China's current advantage lies in industrial products, which means that although trade exchanges are good, they do not make money and the profits obtained are relatively low [9]. This dependency on importing sophisticated machinery and technology is indicative of China's endeavors to upgrade its industrial base, foster innovation, and move up the value chain by incorporating advanced technologies and know-how into its economy. Thus, the dichotomy between China's export and import structures not only illustrates the country's current economic and industrial strategies but also points to its ongoing efforts to transition towards a more innovation-driven economic model.
Both China and the United States experience more ups and downs in their import and export growth rates than in their overall economic growth, as shown in Figure 4. It shows YoY growth rate of GDP, imports and exports in China
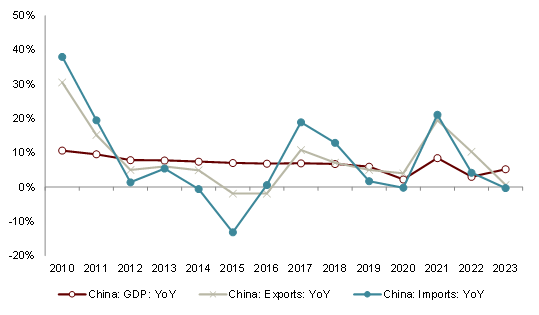
Figure 8: YoY growth rate of GDP, imports and exports in China[10]
As shown in Figure 8, GDP has decreased from 10% to around 5% from 2010 to 2023, The quantity of imports and exports varies greatly among different years, with a difference of about 50% between 2015 and 2010.This indicates that international trade is very important to both countries, highlighting their roles as major players in global trade. The fact that changes in trade can have a bigger impact on their economies than changes in other areas shows how connected they are to the rest of the world. This connection means that when there are big changes in trade, either because of new policies, shifts in what people around the world want to buy, or other global economic changes, it can affect how well China and the U.S. do economically. This similarity between the two countries shows how important it is for them to pay attention to their trade relationships and how these relationships can affect their economic health.
4. The Impact of imported goods on the CPI
The United States' reliance on the international market for basic living necessities and light industrial products introduces a vulnerability to its economic stability. This dependency is fraught with risks, significantly magnified by recent global challenges. The onset of the global pandemic, alongside escalating geopolitical tensions, has severely disrupted international supply chains. These disruptions have been further compounded by the Federal Reserve's adoption of lenient fiscal and monetary policies aimed at sustaining consumer demand amidst economic uncertainties.
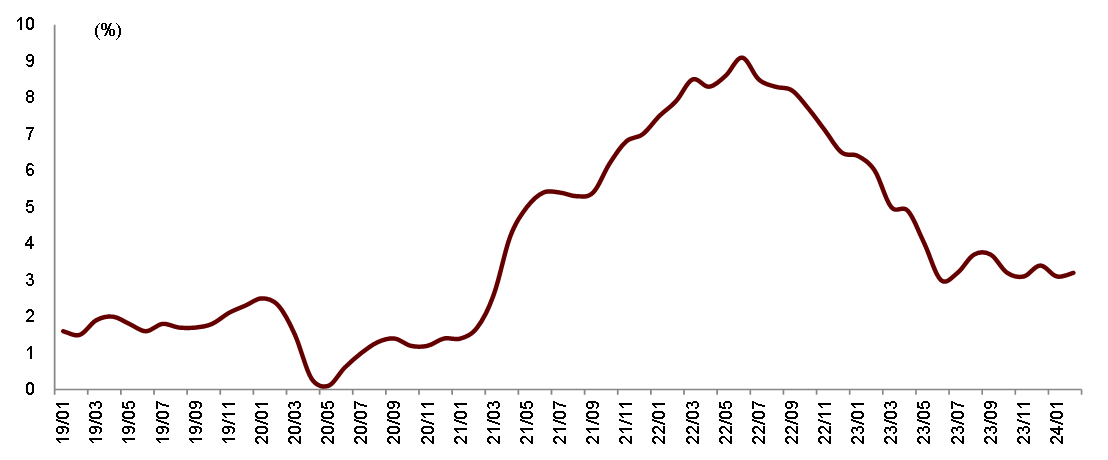
Figure 9: YoY growth rate of CPI in US[10]
As shown in Figure 9, in US, from 19/01 to 24/01, It has increased and decreased, but overall, it has increased from around 1.8% to around 3%. Consequently, this complex interplay of factors has led to a sustained elevation of CPI. The persistence of a high CPI signals ongoing inflationary pressures, thereby escalating the cost of living for American consumers. Inflation erodes purchasing power, making everyday goods and services increasingly unaffordable. Should this trend of a high CPI continue unabated, there's a real risk it could erode consumer confidence, leading to a reduction in spending. This potential decline in consumer expenditure poses a significant threat to the United States' economic growth prospects, potentially slowing down the momentum of the nation's economic recovery and development.
5. Conclusion
International trade plays an essential role in bolstering the US economy, yet the widening trade deficit highlights a pronounced reliance on a diverse array of goods imported from various parts of the world. This growing dependence is not merely incidental but stems from a confluence of several critical factors. Among these, domestic overconsumption stands out, characterized by the US population's high demand for goods and services that surpasses domestic production capabilities. Additionally, the gradual decline of the manufacturing sector within the country, often referred to as the "hollowing out," has led to a reduced capacity for producing a wide range of goods domestically. Compounded by stringent trade controls and tariffs, these factors collectively exacerbate the trade imbalance.
In terms of trade dynamics, the United States specializes in exporting goods and services that incorporate high levels of added value, including cutting-edge technologies and sophisticated products. This not only garners considerable foreign exchange but also significantly contributes to the nation's economic growth and sustains its competitive edge in the global marketplace. On the import front, the US primarily sources basic consumer goods, crucial energy products, and essential raw materials—items fundamental to maintaining everyday life and the functioning of various industries. However, should the cost of these imports rise, perhaps due to changing global market conditions or trade policies, the US could face escalating domestic prices, leading to inflation. Such a scenario would inevitably exert pressure on economic growth, highlighting the intricate interplay between international trade, domestic production, and economic policy in shaping the nation's economic trajectory.
References
[1]. Gerardo Fujii Gambero* and Manuel García Ramos. Revisiting the quality of exports. Journal of Economic Structures. A SpringerOpen Journal. Gerardo Fujii Gambero* and Manuel García Ramos. Page 2 of 17.
[2]. Wang Yu. The Status and Strategies of China's Import and Export Trade under the Background of China US Trade Friction. 1994-2023 China Academic Journal Electronic Publishing House. Page 2.
[3]. Li Jiamei. Research and analysis on the influencing factors of China's economy. 36 issues in 2017 (December). 1994-2022 China Academic Journal Electronic Publishing House. Page 1.
[4]. Gu A , He J , Zhou L ,et al.Analysis of embodied energy and transfer emissions of China's import and export trade[J].Journal of Tsinghua University(Science and Technology), 2010, 50(9):1456-1459.
[5]. Yanmei L I , Jiafeng F U , Zhanyun M A ,et al.Sources and flows of embodied CO2 emissions in import and export trade of China[J].Chinese Geographical Science, 2014, 24(002):220-230.DOI:10.1007/s11769-013-0644-3.
[6]. Ping Y .The Evolutionary Trend of World Grain Market and its Policy Implications for China's Grain Import and Export Trade[J].Journal of Nanjing Agricultural University(Social Sciences Edition), 2013.
[7]. Lun-Lai W , Xiang G , School E .The Influence of Cultural,Geographical and Institutional Distance on China's Import and Export Trade:An Empirical Test of the Trade Data with 32 Countries or Regions[J].International Economics and Trade Research, 2014.
[8]. Xiufeng F , Shan Y U .Empirical Analysis on Impact of Logistics Performance of Maritime Silk- Road Economic Belt on China'Import and Export Trade[J].Journal of Xi'an Jiaotong University(Social Sciences)[2024-05-13].
[9]. Xiufeng F , Shan Y U .Empirical Analysis on Impact of Logistics Performance of Maritime Silk- Road Economic Belt on China'Import and Export Trade[J].Journal of Xi'an Jiaotong University(Social Sciences)[2024-05-13].
[10]. Linping W , Lihan S .Study on Impact of Fluctuation of RMB Exchange Rate on Import and Export Trade of High-tech Product[J].Technology Economics, 2010, 29(2):183-90.DOI:10.1016/j.vaccine.2010.10.059.
Cite this article
Zhang,Z. (2024). A Comparative Analysis of the Impact of Import and Export Trade on the Economy Between China and the United States. Advances in Economics, Management and Political Sciences,108,27-35.
Data availability
The datasets used and/or analyzed during the current study will be available from the authors upon reasonable request.
Disclaimer/Publisher's Note
The statements, opinions and data contained in all publications are solely those of the individual author(s) and contributor(s) and not of EWA Publishing and/or the editor(s). EWA Publishing and/or the editor(s) disclaim responsibility for any injury to people or property resulting from any ideas, methods, instructions or products referred to in the content.
About volume
Volume title: Proceedings of the 3rd International Conference on Financial Technology and Business Analysis
© 2024 by the author(s). Licensee EWA Publishing, Oxford, UK. This article is an open access article distributed under the terms and
conditions of the Creative Commons Attribution (CC BY) license. Authors who
publish this series agree to the following terms:
1. Authors retain copyright and grant the series right of first publication with the work simultaneously licensed under a Creative Commons
Attribution License that allows others to share the work with an acknowledgment of the work's authorship and initial publication in this
series.
2. Authors are able to enter into separate, additional contractual arrangements for the non-exclusive distribution of the series's published
version of the work (e.g., post it to an institutional repository or publish it in a book), with an acknowledgment of its initial
publication in this series.
3. Authors are permitted and encouraged to post their work online (e.g., in institutional repositories or on their website) prior to and
during the submission process, as it can lead to productive exchanges, as well as earlier and greater citation of published work (See
Open access policy for details).
References
[1]. Gerardo Fujii Gambero* and Manuel García Ramos. Revisiting the quality of exports. Journal of Economic Structures. A SpringerOpen Journal. Gerardo Fujii Gambero* and Manuel García Ramos. Page 2 of 17.
[2]. Wang Yu. The Status and Strategies of China's Import and Export Trade under the Background of China US Trade Friction. 1994-2023 China Academic Journal Electronic Publishing House. Page 2.
[3]. Li Jiamei. Research and analysis on the influencing factors of China's economy. 36 issues in 2017 (December). 1994-2022 China Academic Journal Electronic Publishing House. Page 1.
[4]. Gu A , He J , Zhou L ,et al.Analysis of embodied energy and transfer emissions of China's import and export trade[J].Journal of Tsinghua University(Science and Technology), 2010, 50(9):1456-1459.
[5]. Yanmei L I , Jiafeng F U , Zhanyun M A ,et al.Sources and flows of embodied CO2 emissions in import and export trade of China[J].Chinese Geographical Science, 2014, 24(002):220-230.DOI:10.1007/s11769-013-0644-3.
[6]. Ping Y .The Evolutionary Trend of World Grain Market and its Policy Implications for China's Grain Import and Export Trade[J].Journal of Nanjing Agricultural University(Social Sciences Edition), 2013.
[7]. Lun-Lai W , Xiang G , School E .The Influence of Cultural,Geographical and Institutional Distance on China's Import and Export Trade:An Empirical Test of the Trade Data with 32 Countries or Regions[J].International Economics and Trade Research, 2014.
[8]. Xiufeng F , Shan Y U .Empirical Analysis on Impact of Logistics Performance of Maritime Silk- Road Economic Belt on China'Import and Export Trade[J].Journal of Xi'an Jiaotong University(Social Sciences)[2024-05-13].
[9]. Xiufeng F , Shan Y U .Empirical Analysis on Impact of Logistics Performance of Maritime Silk- Road Economic Belt on China'Import and Export Trade[J].Journal of Xi'an Jiaotong University(Social Sciences)[2024-05-13].
[10]. Linping W , Lihan S .Study on Impact of Fluctuation of RMB Exchange Rate on Import and Export Trade of High-tech Product[J].Technology Economics, 2010, 29(2):183-90.DOI:10.1016/j.vaccine.2010.10.059.