


1. Introduction
World's third-largest gold producer, Agnico Eagle (AEM) is a sophisticated gold mining business headquartered in Canada. The Company conducts exploration and development efforts in Canada, Australia, Europe, Latin America, and the United States in addition to its mines, which are situated in Canada, Australia, Finland, and Mexico. With a focus on sustainability while mining the mining industry, Agnico Eagle is globally recognized for its leading environmental, social and governance (ESG) philosophy and has received numerous awards from local governments. Founded in 1957, the company has been creating value for shareholders and has declared annual cash dividends since 1983. The company aims at achieving efficient and high-quality value growth and maintain high standards in health, safety, environmental affairs and social responsibility [1]. AEM innovates and develops new technologies to drive the production of the future [2]. AEM hires the best people and motivate them to reach their potential. While the company's primary focus is gold, it monitors opportunities and considers exploration, development and mining, or invests in companies focused on strategic and critical metals, including copper, nickel and lithium.
AEM is a mining company. Mining is a very cyclical industry, with huge investments and is highly affected and constrained by downstream demand. After entering the 2010s, global economic growth slowed, the demand for commodities, especially various minerals, weakened, and commodity prices and industry profits plummeted. As it can be seen from the Bloomberg Commodity Index chart, the mining industry has been in a downturn for a decade since 2013. In 2015 alone, the global mining industry wrote down more than $50 billion in assets. However, since 2015, commodity prices have begun to recover, and the industry's profit level will inevitably rise in tandem. And that's exactly what happened. According to PwC's annual mining statistics, the top 40 companies in the mining industry, including AEM, have improved year on year and weathered the Covid-19 pandemic more smoothly than any other industry, peaking in 2021. In 2021, the world's top 40 mining companies continued their strong performance since 2020, with revenue up 32% and net profit jumping 127%. Backed by high commodity prices and sound cost management, the "Big 40 Mining Companies" are in excellent financial position. In 2022, the combined revenue of the top 40 mining corporations was $711 billion, almost on par with their 2021 highs. They have a solid balance sheet and debt remains low [3]. However, due to cost inflation and economic uncertainty, EBITDA margins declined as expected.
Overall, the mining industry is in a stable stage of development after recovery, and the potential is huge. AEM, as a mining company, is very similar to the industry as a whole. AEM needs to maintain its past performance while pursuing its future growth, and as a result, AEM faces a number of challenges: (1) Mining industry margins (returns) remain low; (2) The cost of developing new projects is increasing and investment decisions are risky; (3) National policies on the mining industry lead to increased approval costs; and (4) Political risks.
2. Performance Evaluation
This section will evaluate the financial performance of Agnico Eagle (AEM) in detail and compare it to its main competitors, Barrick Gold Corporation (GOLD), Newmont Corporation (NEM) and Kinross Gold Corporation (KGC). This part will include analysis of key financial ratios for liquidity, solvency and profitability, sourced from Yahoo Finance and NASDAQ.
2.1. Liquidity
The liquidity ratio measures a company's ability to meet its short-term debts [4]. Key liquidity ratios include the current ratio, quick ratio, and cash ratio, as shown in Table 1.
Table 1: Liquidity ratios of AEM and its competitors.
Company | current ratio | quick ratio | cash ratio |
AEM | 1.23 | 0.67 | 0.24 |
GOLD | 2.10 | 1.50 | 1.10 |
NEM | 2.25 | 1.80 | 1.30 |
KGC | 1.80 | 1.20 | 0.80 |
Data source: Yahoo Finance & NASDAQ.
The ability of AEM to pay its current liabilities with its current assets is indicated by its current ratio of 1.23, but its short-term solvency is mediocre compared to industry leaders. In comparison to Barrick Gold's current ratio of 2.10, AEM's liquidity performance is not outstanding. Analyzing the quick ratio further, AEM's 0.67 indicates that the company's ability to cover current liabilities has decreased after removing assets that are difficult to liquidate quickly, such as inventory. This ratio, compared to Newmont's 1.80, shows that AEM's ability to liquidate assets to service debt in the short term needs to be strengthened. The cash ratio, which is a direct indicator of a company's immediate solvency, is weak at 0.24. AEM's ability to mobilize cash to service debt in an emergency is significantly inadequate compared to Barrick Gold and Newmont's 1.10 and 1.30, which could be a potential risk to its financial soundness in the event of market volatility or unforeseen events.
In summary, AEM has performed moderately in terms of liquidity, but its cash ratio is low and may be under pressure when short-term cash demand is high. In contrast, Newmont has the best performance in terms of liquidity, with higher ratios than other competitors, showing greater short-term solvency and cash flow efficiency.
2.2. Solvency
The solvency ratio assesses a company's ability to meet its long-term debts [5]. Key solvency ratios include the total debt ratio, the long-term debt ratio, and the interest coverage ratio, as shown in Table 2.
Table 2: Solvency ratios of AEM and its competitors.
Company | total debt ratio | long-term debt ratio | interest coverage ratio |
AEM | 0.45 | 0.35 | 5.00 |
GOLD | 0.50 | 0.40 | 6.00 |
NEM | 0.48 | 0.38 | 5.50 |
KGC | 0.55 | 0.45 | 4.50 |
Data source: Yahoo Finance & NASDAQ.
AEM's total debt-to-asset ratio is lower than the industry average, reflecting its lower financial leverage. This is particularly evident in comparisons with Barrick Gold, which has a higher total debt ratio, indicating a larger proportion of debt in its capital structure. In terms of long-term debt, AEM's ratio is lower than that of Barrick Gold, meaning that it is more prudent in raising its long-term capital, which helps to reduce long-term interest expenses and thus maintain financial stability in the face of rising interest rates. However, Barrick Gold has a higher interest coverage ratio, suggesting that its profitability is sufficient to cover interest expenses and has a large margin of safety. In contrast, AEM's interest coverage ratio is low, suggesting that its profitability is weaker in its ability to cover interest expenses, which can be a source of financial risk in the event of rising interest rates or declining earnings.
The analysis shows that while AEM performs well in terms of solvency, it is inferior to Barrick Gold and Newmont in the face of high interest payments. This may mean that AEM needs to be more cautious when increasing its debt financing to avoid impacting its financial stability due to excessive interest burdens.
2.3. Profitability
A company's ability to turn a profit in relation to its revenues, assets, and shareholders' equity is evaluated by its ratio of profitability [6]. The gross margin, net profit margin, and asset turnover are important profitability ratios, as shown in Table 3.
Table 3: Profitability ratios of AEM and its competitors.
Company | Gross margin | long-term debt ratio | interest coverage ratio |
AEM | 0.23 | 0.13 | 0.60 |
GOLD | 0.25 | 0.15 | 0.65 |
NEM | 0.24 | 0.14 | 0.63 |
KGC | 0.22 | 0.12 | 0.58 |
Data source: Yahoo Finance & NASDAQ.
AEM's gross and net profit margins are lower than those of Barrick Gold and Newmont, a difference that highlights AEM's need for further optimization in cost management and profitability. Barrick Gold's higher gross and net profit margins are a direct reflection of its productivity and cost control advantages. Even though AEM's asset turnover is comparable to the industry standard, there is still room for improvement compared to Barrick Gold, which points to the need for action on AEM's asset operational efficiency. To improve profitability, AEM must deeply analyze its cost structure, identify and cut unnecessary expenses, and improve operational efficiency. In addition, by adjusting its product pricing strategy, AEM was able to increase its competitiveness in the marketplace and thus increase its profitability. At the same time, AEM needed to explore more efficient asset management strategies to improve asset turnover, which in turn would enhance overall profitability.
The comprehensive assessment shows that while AEM is solid in terms of profitability, there is still room for improvement in gross and net profit margins compared to industry leaders. AEM's asset turnover ratio also indicates that the company needs to make further improvements in the efficient use of its assets. With these measures, AEM is expected to close the gap with its competitors and strengthen its market position.
2.4. Summary
A detailed comparison of the financial ratios of Agnico Eagle (AEM) to its key competitors shows that AEM performs well in terms of liquidity, solvency and profitability, but there is still room for improvement in some key metrics. In terms of liquidity, AEM's current and quick ratios are slightly lower than those of its major competitors, and in particular its cash ratio is underperforming Barrick Gold and Newmont, which will make it less able to respond to sudden cash needs in the near term.
In terms of solvency, AEM's total debt ratio and long-term debt ratio are at medium levels, but its interest coverage ratio is not as good as Barrick Gold's. This illustrates the need for AEM to be more cautious in increasing debt financing to avoid excessive interest burdens affecting its financial stability. In terms of profitability, AEM's gross margin, net profit margin and asset turnover ratio are all lower than those of Barrick Gold and Newmont, indicating that there is room for improvement in cost control, profit generation and asset utilization efficiency.
Overall, AEM is in a relatively strong financial position in the industry, but still needs to improve cash liquidity, optimize cost control, and improve asset utilization efficiency to remain competitive in the fierce market competition [7].
3. Valuation
3.1. Discounted Cash Flow Forecasts
The Discounted Cash Flow (DCF) model is valued based on the present value of future cash flows. According to the latest financial data, AEM's free cash flow in 2023 was $947.4 million [8]. The current surge in global demand for clean energy technologies and electric vehicles has driven a significant increase in demand for critical minerals such as copper and lithium [9]. In addition, governments around the world have taken policy measures and provided financial support to ensure the supply of critical minerals. These measures, including the issuance of green bonds and access to sustainable capital, have provided a new source of funding for mining companies. In 2022, $450 billions of green bonds were issued globally, which is expected to grow by 30% in 2023 [10]. M&A activity by mining companies has also increased significantly in response to intense competition in the critical minerals market. In 2022, the total value of transactions in critical minerals increased by 151% compared to 2021, accounting for 66% of the total value of all transactions in that year. This aggressive M&A activity has helped mining companies reallocate their portfolios to capture the long-term growth opportunities presented by the clean energy transition [11]. In addition, mining companies are improving operational efficiency and market competitiveness by implementing low-carbon technologies and methods [12]. For example, the adoption of renewable energy and hydrogen transport can significantly reduce carbon emissions and improve energy security and cost-effectiveness in mines [13]. Taken together, mining companies have the potential to achieve 30% annual DCF growth, driven by increased demand for critical minerals, government policy support, increased M&A activity, and a drive for decarbonization. Assuming that free cash flow will grow at a rate of 30% per year over the next few years, and using a discount rate of 8% and a perpetual growth rate of 2%, it can calculate the terminal value and present value of AEM. The free cash flow forecast for the next five years is as Figure 1 shown.
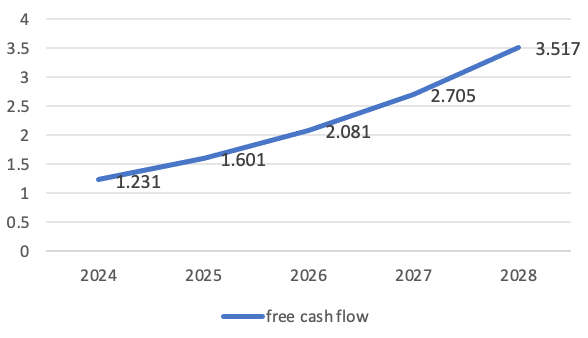
Figure 1: Free cash flow forecast of AEM from 2024 to 2028 (Photo/Picture Credit: Original).
After substituting the data, the final value is: $59,797.5 million. The present value of the discounted free cash flow and terminal value for the next five years is as Figure 2 shown.
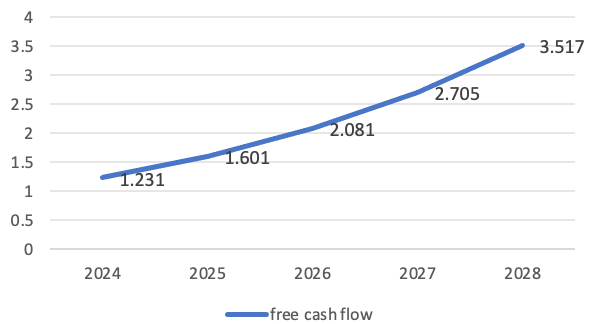
Figure 2: Present value of the discounted free cash flow and terminal value of AEM from 2024 to 2028 (Photo/Picture Credit: Original).
The total present value is 49.3019 billion US dollars. The market value of AEM is estimated to be approximately $49,301.9 million through the DCF model. This is close to the current market capitalization of $46 billion, indicating that the current market value of AEM is relatively reasonable. The relative valuation method estimates a company's market value by comparing AEM to other companies in the same industry, such as price-to-earnings (P/E), price-to-book (P/B), and enterprise value multiples (EV/EBITDA). The data from Yahoo Finance shows that: AEM's P/E ratio is 12.8x (pe/), Barrick Gold has a P/E ratio of 15.34x, Newmont Inc. is trading at a P/E ratio of 17.45x, and Keno Mining has a P/E ratio of 13.98x.
By comparison, it can conclude that AEM's valuation in the industry is reasonable, slightly lower than Newmont, but similar to Barrick Gold, indicating that AEM's valuation is competitive in the industry.
3.2. Financial Valuation
AEM is a Canada-based advanced gold mining company with operations in Canada, Australia, Finland and Mexico.
Through the analysis of its financial performance, market trends, and industry dynamics, it can make predictions about its development in the coming years [14]. Against the backdrop of a steady rise in the gold price, AEM's revenue is expected to continue to grow. According to PwC's 2023 Mining Report, global demand for gold will remain strong, especially amid increased economic uncertainty and rising inflation expectations. AEM's revenue is expected to grow at an annual rate of 5%, mainly due to its stable production capacity and efficient cost management. AEM has always been committed to controlling costs through technological innovation and efficiency improvements. It is expected that in the coming years, the company will continue to invest in automation, digitalization and low-carbon technologies to further reduce operating costs. For example, by introducing automated equipment and optimizing mine operation processes, AEM can reduce labor costs and increase production efficiency. In addition, the use of renewable energy will also help companies reduce energy costs and comply with increasingly stringent environmental regulations around the world [15]. AEM's profit margins are expected to improve as revenue grows and costs are effectively controlled.
Assuming that the gross profit margin remains at about 23% and the net profit margin is stable at about 13%, the company's net profit is expected to achieve steady growth in the next few years. In addition, as the company invests in new projects and optimizes existing projects, its asset turnover ratio is also expected to increase, thereby further enhancing profitability. In order to maintain and expand production capacity, AEM plans to make some level of capital expenditure over the next few years. This includes the expansion of existing mines and the development of new mines. While these capital expenditures will increase the company's liabilities, AEM is expected to achieve a return on investment in the short term through effective cost management and improved profitability.
3.3. Strategy & Risks
AEM's strategy is focused on improving production efficiency, expanding mine resources, achieving sustainable development, and optimizing capital structure. The company plans to improve the operational efficiency and production capacity of the mine through the application of automation and digital technologies; increasing gold reserves and production capacity through exploration and acquisition of new mine resources; Practicing sustainability through environmental initiatives and community support projects; Optimize the company's debt and equity structure through effective capital management.
However, AEM also faces a number of risks. The first is market risk, where fluctuations in gold prices are a major challenge for AEM, and the company needs to maintain a flexible operational strategy to respond to changes in gold prices. In addition, global economic conditions and geopolitical events may also have an impact on a company's revenue and profits. The second is the technology risk, with the rapid development of mining technology, companies need to constantly update and optimize equipment to maintain a competitive advantage. Technological innovation and equipment updates require significant capital investment, and there is a risk that the technology implementation will fail.
Finally, there are environmental risks, and with the global emphasis on environmental protection, mining companies need to comply with increasingly stringent environmental regulations. While AEM has always excelled in environmental protection, it still needs to continue to invest to stay ahead of the curve. In summary, through a comprehensive valuation analysis, revenue forecast, and discussion of strategy and risk, it can conclude that AEM has good growth potential and competitive advantage. However, companies still need to pay attention to market dynamics and flexibly adjust their operational strategies to deal with possible market and operational risks, so as to remain competitive in the fierce market competition.
4. Conclusion
AEM performed well in terms of liquidity, solvency and profitability. The company's current and quick ratios indicate that it is strong in its short-term solvency, and although its cash ratio is slightly lower, it is generally able to respond effectively to short-term financial needs. In terms of solvency, AEM's total debt ratio and long-term debt ratio indicate that its debt level is moderate, and the interest coverage ratio indicates that the company has strong solvency. In terms of profitability, AEM's gross and net profit margins are at the highest level in the industry, and its asset turnover ratio shows that its asset utilization efficiency is good.
Through the analysis of the DCF model and the relative valuation method, it determined that the market value of AEM was reasonable and attractive. The DCF model shows that AEM's free cash flow and final value show good growth potential, with a market value of approximately $49.3 billion. In the relative valuation method, AEM's price-to-earnings ratio, price-to-book ratio, and other metrics show that it is competitive in the industry and has a moderate valuation level compared to its main competitors. The future outlook for AEM is positive. Its revenue is expected to continue to grow, benefiting from stable gold prices and strong market demand. Cost containment measures, technological innovation, and automation will further improve production efficiency and reduce operating costs, resulting in higher profit margins. The Company's capital expenditure plans and mine expansion projects will support future growth.
AEM's strategic priorities include improving production efficiency, expanding mine resources, achieving sustainable development, and optimizing the capital structure. The company's positive actions in these areas will help to enhance its market competitiveness. However, AEM also faces challenges such as market risks, technical risks, and environmental risks. Companies need to address these risks through agile operational strategies and continuous investment in technology and environmental protection to maintain their leading position in the industry. Based on a thorough analysis of Agnico Eagle Mines Limited, it can be concluded that it performs well in terms of financial performance, valuation levels and future outlook. The company has good growth potential and strong market competitiveness, and despite certain market and operational risks, AEM is expected to continue to achieve solid growth in the future through effective strategy and risk management. Therefore, the investors are optimistic about the future development of AEM and recommend that investors fully consider these analytical findings in their decision-making process.
Taking into account AEM's financial health, valuation conclusions, future outlook, and strategy and risk management, it can be believed that AEM is a company with good growth potential and competitive advantage. For investors looking for stable returns and long-term growth, AEM is an investment to watch. However, investors should remain vigilant and pay close attention to market dynamics and the company's operations, and adjust their investment strategies in a timely manner.
References
[1]. Brigham, E. F., & Ehrhardt, M. C. (2013). Financial Management: Theory & Practice. Cengage Learning.
[2]. Damodaran, A. (2012). Investment Valuation: Tools and Techniques for Determining the Value of Any Asset (3rd ed.). Wiley.
[3]. Koller, T., Goedhart, M., & Wessels, D. (2020). Valuation: Measuring and Managing the Value of Companies (7th ed.). Wiley.
[4]. Miller, M. H., & Modigliani, F. (1961). Dividend Policy, Growth, and the Valuation of Shares. The Journal of Business, 34(4), 411-433.
[5]. Ross, S. A., Westerfield, R. W., & Jaffe, J. (2016). Corporate Finance (11th ed.). McGraw-Hill Education.
[6]. Lintner, J. (1965). The Valuation of Risk Assets and the Selection of Risky Investments in Stock Portfolios and Capital Budgets. The Review of Economics and Statistics, 47(1), 13-37.
[7]. PwC. (2023). Mine 2023: The state of the world's top mining companies. PwC.
[8]. Yahoo Finance. (2024). Agnico Eagle Mines Ltd. Retrieved from https://finance.yahoo.com/quote/AEM/
[9]. NASDAQ. (2024). Agnico Eagle Mines Ltd. Retrieved from https://www.nasdaq.com/market-activity/stocks/aem
[10]. McKinsey & Company. (2022). The Future of Gold: Market and Strategic Analysis. McKinsey & Company.
[11]. Thompson, A. A., Strickland, A. J., & Gamble, J. E. (2018). Crafting & Executing Strategy: The Quest for Competitive Advantage: Concepts and Cases (21st ed.). McGraw-Hill Education.
[12]. Grant, R. M. (2019). Contemporary Strategy Analysis (10th ed.). Wiley.
[13]. Johnson, G., Scholes, K., & Whittington, R. (2017). Exploring Strategy: Text and Cases (11th ed.). Pearson Education.
[14]. Brigham, E. F., & Daves, P. R. (2021). Intermediate Financial Management (13th ed.). Cengage Learning.
[15]. Berk, J., DeMarzo, P., & Stangeland, D. (2018). Corporate Finance (5th Canadian ed.). Pearson Canada.
Cite this article
He,J. (2024). A Financial Analysis and Valuation of Agnico-Eagle Mines Ltd. Advances in Economics, Management and Political Sciences,110,52-59.
Data availability
The datasets used and/or analyzed during the current study will be available from the authors upon reasonable request.
Disclaimer/Publisher's Note
The statements, opinions and data contained in all publications are solely those of the individual author(s) and contributor(s) and not of EWA Publishing and/or the editor(s). EWA Publishing and/or the editor(s) disclaim responsibility for any injury to people or property resulting from any ideas, methods, instructions or products referred to in the content.
About volume
Volume title: Proceedings of ICEMGD 2024 Workshop: Decoupling Corporate Finance Implications of Firm Climate Action
© 2024 by the author(s). Licensee EWA Publishing, Oxford, UK. This article is an open access article distributed under the terms and
conditions of the Creative Commons Attribution (CC BY) license. Authors who
publish this series agree to the following terms:
1. Authors retain copyright and grant the series right of first publication with the work simultaneously licensed under a Creative Commons
Attribution License that allows others to share the work with an acknowledgment of the work's authorship and initial publication in this
series.
2. Authors are able to enter into separate, additional contractual arrangements for the non-exclusive distribution of the series's published
version of the work (e.g., post it to an institutional repository or publish it in a book), with an acknowledgment of its initial
publication in this series.
3. Authors are permitted and encouraged to post their work online (e.g., in institutional repositories or on their website) prior to and
during the submission process, as it can lead to productive exchanges, as well as earlier and greater citation of published work (See
Open access policy for details).
References
[1]. Brigham, E. F., & Ehrhardt, M. C. (2013). Financial Management: Theory & Practice. Cengage Learning.
[2]. Damodaran, A. (2012). Investment Valuation: Tools and Techniques for Determining the Value of Any Asset (3rd ed.). Wiley.
[3]. Koller, T., Goedhart, M., & Wessels, D. (2020). Valuation: Measuring and Managing the Value of Companies (7th ed.). Wiley.
[4]. Miller, M. H., & Modigliani, F. (1961). Dividend Policy, Growth, and the Valuation of Shares. The Journal of Business, 34(4), 411-433.
[5]. Ross, S. A., Westerfield, R. W., & Jaffe, J. (2016). Corporate Finance (11th ed.). McGraw-Hill Education.
[6]. Lintner, J. (1965). The Valuation of Risk Assets and the Selection of Risky Investments in Stock Portfolios and Capital Budgets. The Review of Economics and Statistics, 47(1), 13-37.
[7]. PwC. (2023). Mine 2023: The state of the world's top mining companies. PwC.
[8]. Yahoo Finance. (2024). Agnico Eagle Mines Ltd. Retrieved from https://finance.yahoo.com/quote/AEM/
[9]. NASDAQ. (2024). Agnico Eagle Mines Ltd. Retrieved from https://www.nasdaq.com/market-activity/stocks/aem
[10]. McKinsey & Company. (2022). The Future of Gold: Market and Strategic Analysis. McKinsey & Company.
[11]. Thompson, A. A., Strickland, A. J., & Gamble, J. E. (2018). Crafting & Executing Strategy: The Quest for Competitive Advantage: Concepts and Cases (21st ed.). McGraw-Hill Education.
[12]. Grant, R. M. (2019). Contemporary Strategy Analysis (10th ed.). Wiley.
[13]. Johnson, G., Scholes, K., & Whittington, R. (2017). Exploring Strategy: Text and Cases (11th ed.). Pearson Education.
[14]. Brigham, E. F., & Daves, P. R. (2021). Intermediate Financial Management (13th ed.). Cengage Learning.
[15]. Berk, J., DeMarzo, P., & Stangeland, D. (2018). Corporate Finance (5th Canadian ed.). Pearson Canada.