


1. Introduction
Stock companies issue stocks to gather funds, and investors buy stocks to earn returns. It is significant for investors and governments to predict the trends of stock prices to forecast economic trends and changes. Statistical methods like Vector Autoregression (VAR) [1] or ARIMA [2] can be used to analyze the laws and characteristics of stock price trends. However, stock markets are complex and chaotic, statistical methods cannot get good results. At the same time, advances in machine learning enable the data-processing methods to be applied to stock data [3]. Nowadays there are a lot of deep learning models on financial time series forecasting [4]. RNN, (Convolutional Neural Network) CNN and LSTM [5] are common models used for prediction. Besides, a bidirectional long short-term memory neural network (BiLSTM) model, which consists of two layers of LSTMS in opposite directions, was proposed by Graves et al. [6]. Stock price can also be predicted by combined models like CNN-GRU model or CNN-LSTM model to get higher accuracy [7-8]. However, there are still a lack of applied research of complex prediction methods. China and the US are the world's two largest economies. Considering the interactivity [9] and differentiation of stock market between China and USA, CSI 300 index and NASDAQ index are selected as research objects. They are predicted by simple RNN and LSTM in this study to find out which model can fit them better.
2. Data and Methods
2.1. Data
This study chooses CSI 300 index and NASDAQ index from 12/08/2014 to 06/11/2024 as datasets and forecasts their closing price. Additionally, CSI 300 index comes from JoinQuant and NASDAQ index comes from MSN. Figure 1 shows the trends of CSI 300 index and NASDAQ index. The CSI 300 index is in a state of fluctuation, while the NASDAQ index is generally on an upward trend. And their descriptive statistics are displayed in Table 1.
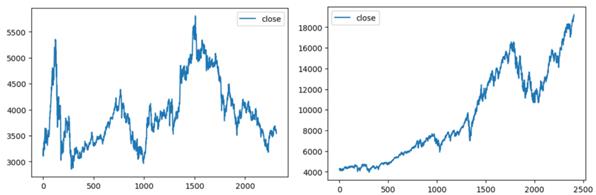
Figure 1: Data Frame of CSI 300 Index(left) and NASDAQ Index(right)
Table 1: Descriptive Statistics of CSI 300 Index and NASDAQ Index
index(close) |
count |
mean |
std |
min |
max |
CSI 300 |
2311.00 |
3933.56 |
599.43 |
2853.76 |
5807.72 |
NASDAQ |
2403.00 |
9368.18 |
4271.92 |
3947.80 |
19210.18 |
Each data is divided into 2 parts, the first part (1200) is used as training set while the subsequent data is the test set.
2.2. Data Normalization
In this study, normalization is used to bring both the phase space domain dataset and the original chaotic time series dataset to the range of (0, 1). On the one hand, normalization can make the data the same scale to reduce the impact of data on prediction. On the other hand, it can improve prediction accuracy and enhance the convergence speed. The normalization function:
\( x^{′}=\frac{x - min}{max - min}\ \ \ (1) \)
2.3. RNN
Recurrent Neural Networks (RNNs) are a common type of neural network, which can identify patterns in data sequences, time series for example. Different from these traditional neural networks, whose inputs and outputs are assumed to be independent of each other, RNNs leverage their internal states (memories) to process series of inputs. There is a type of RNN operation principle shown in Figure 2 [10].
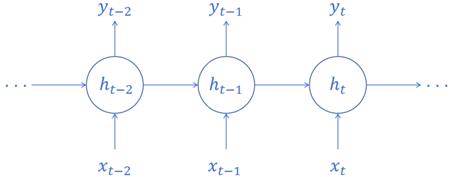
Figure 2: Operation Principle of RNN
Ability to keep a hidden state that catches information from previous time steps is the most outstanding feature of RNNs. This hidden state is updated along the time steps according to hidden state stored in previous cells and the input at present. At time step t, hidden state \( h_t \) is:
\( h_{t}=σ(W_{h}x_{t}+U_{h}h_{t - 1}+b_{h})\ \ \ (2) \)
Here, \( x_t \) is the input, \( h_{t - 1} \) is the hidden state from the previous time step, \( W_h \) and \( U_h \) are weight matrices, \( b_h \) is a bias term, and \( \sigma \) is the activation function (typically tanh or ReLU). And output \( y_t \) is:
\( y_{t}=σ(W_{y}h_{t}+b_{y})\ \ \ (3) \)
Here, \( W_y \) is the weight matrix of the output layer, and \( b_y \) is a bias term.
2.4. LSTM
As a variant type of RNN architectures, LSTM is without the defect of long-term dependencies, which is a limitation found in the traditional RNN. LSTMs store information in memory cells which enables them to maintain long-term states and control the changes of information. LSTMs are effective in data-processing. Besides, LSTMs include 3 types of gates, Forget Gate, Input Gate and Output Gate (See Figure 3). This mechanism helps the network handle more complex patterns and structures. The details of gates’ functions are as follows.
Forget Gate \( \mathbf{f}_\mathbf{t} \) : Select useless information and discard it from the cell state.
Input Gate \( \mathbf{i}_\mathbf{t} \) : Determines what new information will be reserved in the cell state.
Output Gate \( \mathbf{o}_\mathbf{t} \) : Determines the next hidden state, which contains information that will be passed to the next time step.
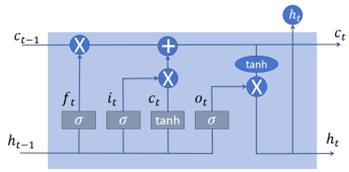
Figure 3: Operation Principle of LSTM
Where:
\( f_{t}=σ_{g}(U_{f}h_{t - 1}+W_{f}x_{t}+b_{f})\ \ \ (4) \)
\( i_{t}=σ_{g}(U_{i}h_{t - 1}+W_{i}x_{t}+b_{i})\ \ \ (5) \)
\( o_{t}=σ_{g}(U_{o}h_{t - 1}+W_{o}x_{t}+b_{o})\ \ \ (6) \)
\( c_{t}=f_{t}⊙c_{t - 1}+i_{t}⊙{c}_{t}\ \ \ (7) \)
\( {c}_{t}=σ_{c}(W_{c}x_{t}+U_{c}h_{t - 1}+b_{c})\ \ \ (8) \)
\( h_{t}=o_{t}⊙σ_{h}(C_{t})\ \ \ (9) \)
Here, \( x_t \in \mathbb{R}^d \) is input vector, \( f_t \) is the activation vector of the forget gate, \( i_t \) is the activation vector of the input or update gate, \( o_t \) is activation vector of output gate, \( h_t \) means hidden state, it is LSTM unit’s output vector, \( {c}_{t} \) is the activation vector of the cell input, \( c_t \in \mathbb{R}^h \) is a vector containing information in cell state, \( W \in \mathbb{R}^{h \times d},U \in \mathbb{R}^{h \times h} \) are weight matrices and \( b \in \mathbb{R}^h \) is bias vector parameters. Additionally, \( \sigma_g \) and \( \sigma_c \) are sigmoid function and hyperbolic tangent function.
2.5. RMSE
For a statistical model, RMSE shows the average difference between its predicted values and actual observed values. RMSE is used to assess the amount of deviation in regression analysis or other statistical models. In this study, RMSE is a standard of models’ quality levels. The smaller RMSE means better prediction. Fora sample with N observations, its RSME is as follows:
\( RSME=\sqrt[]{\frac{∑(y_{i} - {y}_{i})^{2}}{N}}\ \ \ (10) \)
3. Result
This study predicts CSI 300 index and NASDAQ index (12/08/2024 to 06/11/2024) by simple RNN and LSTM to find out which model fits index better. Each data is divided into 2 parts, the first 1200 data of the index is seen as training set while the subsequent data is the test set. The result of prediction will be presented in both image and RMSE. The better one will be chosen by their comparison. Here the neural network models utilize the stock price from the previous day to forecast the stock price for the following day, leveraging patterns and trends identified in historical data. MSE and ADAM are chosen as loss function and optimizer.
3.1. Simple RNN
Simple RNN model is built to predict CSI 300 index and NASDAQ index separately. As Figure 4 shows, simple RNN predicts really well both for CSI 300 and NASDAQ. However, when it comes to RMSE, their differences are apparent (See Table 2).
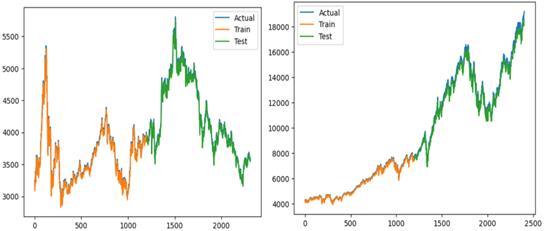
Figure 4: Simple RNN Predicts CSI 300 Index(left) and NASDAQ Index(right)
Table 2: Comparison Results (Simple RNN)
index |
Training score (RMSE) |
Test score (RMSE) |
CSI 300 |
64.52 |
60.01 |
NASDAQ |
93.10 |
341.43 |
It is clear that simple RNN predicts better for CSI300 index than NASDAQ index. Their training scores are close but test scores are not as that close. At the same time, NASDAQ’ test score is much bigger than its training score, which means simple RNN can’t predict NASDAQ index well. It may because there is a sudden downward trend after a continuous upward trend for NADAQ index, simple RNN did not anticipate this situation. And there is a relatively obvious rule for CSI 300 index, so this model can fit better.
3.2. LSTM
Then LSTM model is used to forecast both CSI300 index and NASDAQ index. Similar to RNN, LSTM also performs well in prediction (See Figure 5 and Table 3).
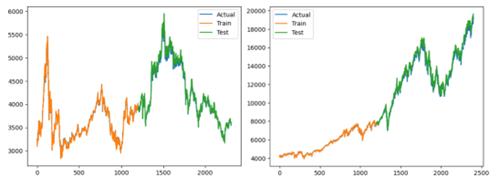
Figure 5: LSTM Predicts CSI300 index(left) and NASDAQ index(right)
Table 3: Comparison Results (LSTM)
index |
Training score (RMSE) |
Test score (RMSE) |
CSI 300 |
63.94 |
72.91 |
NASDAQ |
72.42 |
377.58 |
Like simple RNN, LSTM predicts CSI300 index better than NASDAQ. For both CSI 300 index and NASDAQ index, simple RNN predicts better in test set and LSTM is a little better in train set.
4. Conclusion
Though simple RNN and LSTM are good models for prediction, it can be found that both simple RNN and LSTM are better at forecasting CSI300 index than NASDAQ index. This study still has some disadvantages. The models cannot predict sudden changes in data. To handle this problem, it may be effective to try to make models more complex to deal with the changes of data. For example, attention mechanisms can be introduced attention mechanisms in the LSTM model, allowing the network to focus on different degrees of input information at different time steps. Models can also be combined with others to get more precise predictions.
References
[1]. Yan XY. (2024). Analysis of CITIC Securities stock returns based on ARMA-GARCH and VAR models. Business Exhibition Economy (11), 98-101.
[2]. Wu YX & Wen X. (2016). Short-term stock price forecasting based on ARIMA model. Statistics and Decision (23), 83-86.
[3]. Sezer, O.B., Gudelek, M.U., & Ozbayoglu, A.M. (2019). Financial Time Series Forecasting with Deep Learning: A Systematic Literature Review: 2005-2019.
[4]. Nabipour, M., Nayyeri, P., Jabani, H., & Mosavi, A.H. (2020). Deep Learning for Stock Market Prediction. Entropy, 22.
[5]. Graves, A., & Jürgen Schmidhuber. (2005). Framewise phoneme classification with bidirectional lstm and other neural network architectures. Neural Networks, 18(5–6), 602-610.
[6]. Chen WJ, Jiang WH & Jia XB. (2021). Stock index price prediction based on CNN-GRU joint model. Information Technology and Informatization (09), 87-91.
[7]. Geng JJ, Liu YM, Li Y & Zhao ZY. (2021). Stock index prediction model based on CNN-LSTM. Statistics and Decision (05), 134-138.
[8]. Cui, ZH. (2007). Research on the linkage between Chinese and US stock markets. PhD (Dissertation, Zhejiang University).
[9]. Géron, A. (2019). Hands-on machine learning with Scikit-Learn, Keras and TensorFlow: concepts, tools, and techniques to build intelligent systems (2nd ed.). O’Reilly.
[10]. Yin, W., Kann, K., Yu, M., & Schütze, H. (2017). Comparative study of CNN and RNN for natural language processing. arXiv preprint arXiv:1702.01923.
Cite this article
Lu,B. (2024). Predicting CSI 300 Index and NASDAQ Index by Simple RNN and LSTM. Advances in Economics, Management and Political Sciences,105,217-222.
Data availability
The datasets used and/or analyzed during the current study will be available from the authors upon reasonable request.
Disclaimer/Publisher's Note
The statements, opinions and data contained in all publications are solely those of the individual author(s) and contributor(s) and not of EWA Publishing and/or the editor(s). EWA Publishing and/or the editor(s) disclaim responsibility for any injury to people or property resulting from any ideas, methods, instructions or products referred to in the content.
About volume
Volume title: Proceedings of the 3rd International Conference on Financial Technology and Business Analysis
© 2024 by the author(s). Licensee EWA Publishing, Oxford, UK. This article is an open access article distributed under the terms and
conditions of the Creative Commons Attribution (CC BY) license. Authors who
publish this series agree to the following terms:
1. Authors retain copyright and grant the series right of first publication with the work simultaneously licensed under a Creative Commons
Attribution License that allows others to share the work with an acknowledgment of the work's authorship and initial publication in this
series.
2. Authors are able to enter into separate, additional contractual arrangements for the non-exclusive distribution of the series's published
version of the work (e.g., post it to an institutional repository or publish it in a book), with an acknowledgment of its initial
publication in this series.
3. Authors are permitted and encouraged to post their work online (e.g., in institutional repositories or on their website) prior to and
during the submission process, as it can lead to productive exchanges, as well as earlier and greater citation of published work (See
Open access policy for details).
References
[1]. Yan XY. (2024). Analysis of CITIC Securities stock returns based on ARMA-GARCH and VAR models. Business Exhibition Economy (11), 98-101.
[2]. Wu YX & Wen X. (2016). Short-term stock price forecasting based on ARIMA model. Statistics and Decision (23), 83-86.
[3]. Sezer, O.B., Gudelek, M.U., & Ozbayoglu, A.M. (2019). Financial Time Series Forecasting with Deep Learning: A Systematic Literature Review: 2005-2019.
[4]. Nabipour, M., Nayyeri, P., Jabani, H., & Mosavi, A.H. (2020). Deep Learning for Stock Market Prediction. Entropy, 22.
[5]. Graves, A., & Jürgen Schmidhuber. (2005). Framewise phoneme classification with bidirectional lstm and other neural network architectures. Neural Networks, 18(5–6), 602-610.
[6]. Chen WJ, Jiang WH & Jia XB. (2021). Stock index price prediction based on CNN-GRU joint model. Information Technology and Informatization (09), 87-91.
[7]. Geng JJ, Liu YM, Li Y & Zhao ZY. (2021). Stock index prediction model based on CNN-LSTM. Statistics and Decision (05), 134-138.
[8]. Cui, ZH. (2007). Research on the linkage between Chinese and US stock markets. PhD (Dissertation, Zhejiang University).
[9]. Géron, A. (2019). Hands-on machine learning with Scikit-Learn, Keras and TensorFlow: concepts, tools, and techniques to build intelligent systems (2nd ed.). O’Reilly.
[10]. Yin, W., Kann, K., Yu, M., & Schütze, H. (2017). Comparative study of CNN and RNN for natural language processing. arXiv preprint arXiv:1702.01923.