


1. Introduction
As the global economy gradually recovers from short-term challenges and moves towards sustainable development, copper, as an important industrial metal, will play an increasingly important role in the future energy transition and technological progress. Therefore, it is helpful to study the fluctuations of copper prices to predict copper prices.
After entering the 21st century, the global supply and demand fundamentals of copper products on the international market copper prices gradually weakened, is no longer constitute the dominant factor in the fluctuation of copper prices [1]. There is a dependence between the stock market and commodities and that this relationship is constantly changing over time and occurs in most cases. There will be an increasingly strong link between the stock market and industrial metals, mainly copper [2]. Therefore, we use data from the US stock market as a basis for analyzing products that can have an impact on copper price fluctuations. In today's context of openness to the outside world, international copper prices are becoming more volatile, which leads to an increase in the risk faced by copper firms, which in turn has an impact on their share price performance [3]. Some scholars have investigated the correlation of oil prices in the Chinese and European stock markets. The results show that oil prices have a great impact on the oil industries [4-5]. These scholars above illustrated the great impact of oil on the financial industry during the turbulence in the oil market. Therefore, this paper will also use the oil price as a basis for having an impact on the volatility of copper price.
Some scientists conducted a detailed analysis of the relationship between financial markets and international commodity markets using a generalized autoregressive conditional heteroskedasticity model and a Diebold spillover index model. The final empirical results showed that gold, crude oil and copper have the strongest relationship with the financial market, especially in the commodity market [6]. Some researchers chose the commodity market and the Chinese stock market for their study. January 2007 to August 2016 was chosen as the time period of the study. The extreme risk spillover effect between the two is studied in depth. Through empirical analyses, it is found that there is a significant extreme risk spillover effect between oil price, copper price and Shanghai and Shenzhen indices [7]. Some scholars have studied the interrelationship between oil prices and gold prices, and through empirical analysis of Bai-Perron multivariate structural breakpoint detection, it was found that there is a certain positive correlation between the two, but this relationship is not stable in the long term [8]. By analyzing the spillover effects of domestic and international stock markets and commodities, the degree of financialization of different commodities is different and significantly different, roughly presenting a stratified situation [9]. The financialization of commodities is mainly through the accumulation of profits in economic forms, rather than solely through the production and trade of commodities [10]. Therefore, the prices of gold, silver and oil in this article are used to correlate copper price fluctuations.
At present, most of the research is biased towards the analysis of the factors affecting the volatility of gold and oil prices, and less research on the factors affecting the volatility of copper prices. Copper as a commodity, and itself and gold have certain financial attributes. Copper in the futures market and the stock market occupies an obvious position. Therefore, to clarify the factors affecting the copper price can enable financial practitioners to have a better understanding of the changes in the price of copper, and can make the capital market pay more attention to copper and bring more distinct reference value to the futures valuation. By referring to this paper, subsequent researchers can have a clearer understanding of copper prices. Therefore, the author conducted a study.
In this paper, the authors first carry out the statistical characterization of the selected data. Then based on OLS regression model to carry out the study of factors influencing the volatility of copper price. Model fitting of copper price volatility is carried out using ARIMA model and forecasting of copper price movement is carried out by the fitted model. Final conclusions are drawn.
2. Method
2.1. Data sources and description
The study data were selected from the Kaggle website. This dataset was edited by Saket Kumar. The Kaggle website provides spot copper prices, spot gold prices, spot silver prices, crude oil futures settlement prices, etc. This paper collects the data of copper, gold, silver, and oil prices in the U.S. stock market from 2019 to 2024, and studies the correlation between copper price fluctuations and other trivalent prices. and predicted the trend of copper prices in 2025.
2.2. Indicator selection and description
In this paper, copper, gold, silver and oil price data for the U.S. stock market are selected for the five-year period from 2019 to 2024. As the largest stock market in the world, the U.S. stock market is characterized by large scale, high liquidity and mature market mechanism. And there are mature and rational investors. Therefore, this paper uses the price of copper, gold, silver and oil in the U.S. stock market for analysis
Figure 1: Price lines of copper and gold.
Figure 2: Price lines of copper and silver.
Figure 3: Price lines of copper and oil.
Table 1: Statistical characteristics of the selected data.
mean | maximum | minimum | median | |
Copper price (USD/lb) | 3.537822314 | 4.8195 | 2.179 | 4.418 |
Gold price (USD/oz) | 1,759.03 | 2,089.70 | 1,284.20 | 1822.20 |
Silver price (USD/oz) | 21.65528926 | 29.418 | 12.816 | 25.575 |
Oil price (USD/barrel) | 67.58628099 | 115.31 | 19.78 | 71.26 |
2.3. Method introduction.
By comparing the price curves of copper, gold, silver and oil, it is found that there is a certain correlation between copper price and the other three. Based on the OLS regression model, the price data of copper and the three are selected to analyze the impact of gold, silver and oil on copper price. Then 121 sets of copper price data at the beginning and middle of the month from 2019 to February 2024 were selected, and based on the ARIMA model, the relevant parameters were estimated to fit the model of copper price change. The specific effects of gold, silver and oil on copper price were found. And the ARIMA model was used to predict the copper price in 2025.
3. Results and discussion
By comparing the price curves of copper, gold, silver and oil, it is found that there is a certain correlation between the prices of copper and the other three. Based on the OLS regression model, the price data of copper and the three were selected to analyze the impact of gold, silver and oil on copper prices.
Table 2: OLS regression analysis results (n=121).
Coef. | Std. Err | t | p | 95%Ci | |
constant | -0.206 | 0.203 | -1.016 | 0.310 | -0.603 ~ 0.191 |
oil price | 0.019 | 0.002 | 11.791 | 0.000** | 0.016 ~ 0.022 |
silver price | 0.121 | 0.012 | 10.220 | 0.000** | 0.098 ~ 0.145 |
gold price | -0.003 | 0.001 | -2.588 | 0.010** | -0.005 ~ -0.001 |
R 2 | 0.826 | ||||
Adjust R 2 | 0.821 | ||||
F | F (3,117) = 215.030, p=0.000 | ||||
D-W values | 0.415 | ||||
From Table 2 can find that, the oil price, silver price, and gold price are used as independent variables for OLS regression analysis.
The R-squared value of the model is 0.826, which indicates that the oil, silver and gold prices explain 82.58% of the variation in the copper price. In the F-test of the model, it is found that F=215.030, p=0.000<0.05, which shows that the model passes the F-test, and it can be concluded that at least one of the oil, silver and gold price will have an effect on the copper price.
From the Table.2, we can find that the regression coefficient of oil price is 0.019, with a significance level of 0.01; the regression coefficient of silver price is 0.121, with a significance level of 0.01; and the regression coefficient of gold price is -0.003, with a significance level of 0.01. The regression coefficients of oil and silver prices are greater than 0, which means that the growth of oil and silver prices will make the copper price grow. The regression coefficient of gold price is less than 0, which means that the growth of gold price will make the copper price grow negatively to some extent.
The results of the OLS regression analyses performed on the data are in general agreement with the trend profile of the previous price graphs for copper-silver, copper-gold, and copper-oil, and pass the robustness test.
Table 3: ARIMA (3,1,2) model parameter table.
item | symbol | Coefficients | Std. Err | z-value | p-value | 95% CI |
Constant terms | c | 0.007 | 0.013 | 0.546 | 0.585 | -0.019 ~ 0.033 |
α1 | 0.963 | 0.088 | 10.963 | 0.000 | 0.791 ~ 1.135 | |
AR parameters | α2 | -0.895 | 0.090 | -9.986 | 0.000 | -1.071 ~ -0.719 |
α3 | 0.135 | 0.085 | 1.583 | 0.113 | -0.032 ~ 0.301 | |
MA parameters | β1 | -1.085 | 0.066 | -16.477 | 0.000 | -1.214 ~ -0.956 |
β2 | 0.906 | 0.065 | 13.860 | 0.000 | 0.778 ~ 1.034 |
AIC value:-82.725 BIC value:-63.213
According to the AIC, BIC best selection criteria, the authors chose ARIMA (3,1,2) as the primary analysis model, and its model formula is as follows:
\( y(t)=0.007+0.963{y_{t-1}}-0.895{y_{t-2}}+0.135{y_{t-3}}-1.085{ε_{t-1}}+0.906{ε_{t-2}} \) (1)
Through this model, the changes in copper price fluctuations over time can be clarified, and the subsequent changes in copper prices can be predicted more accurately.
Table 4: Twelve period forecasts.
periods predicted | Phase 1 | Phase 2 | Phase 3 | Phase 4 | Phase 5 | Phase 6 | Phase 7 | Phase 8 | Phase 9 | Phase 10 | Phase 11 | Phase 12 |
Value | 3.897 | 3.860 | 3.803 | 3.795 | 3.841 | 3.891 | 3.904 | 3.886 | 3.870 | 3.880 | 3.909 | 3.932 |
RMSE: 0.1611 MSE: 0.0260 MAE: 0.1217 MAPE: 0.0346
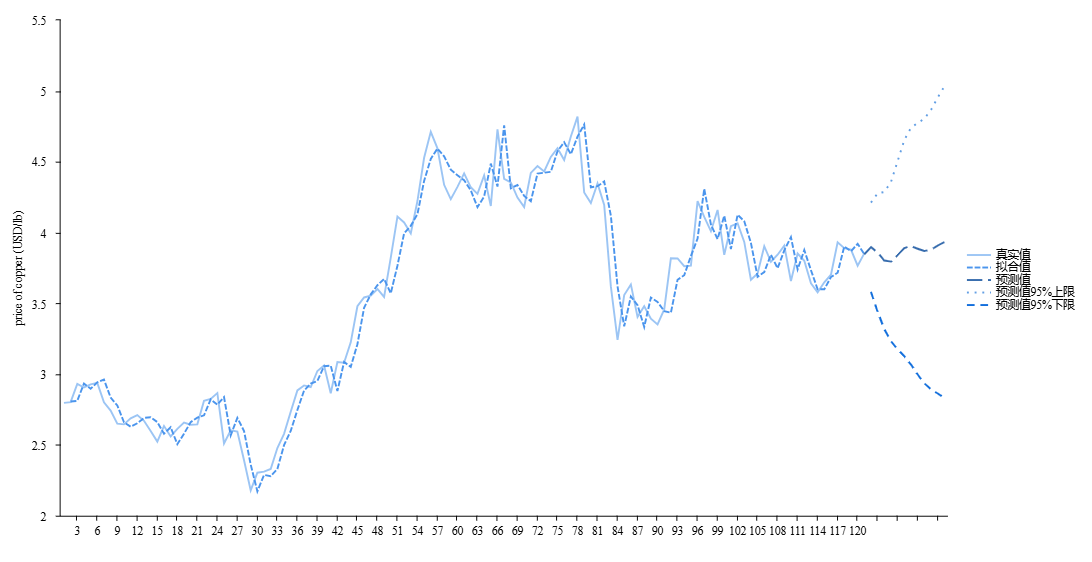
Figure 4: Copper price model fitting and forecasting.
The ARIMA (3,1,2) model was selected for fitting, and the prediction of the next 12 periods was carried out to make the image. The trend of the fitted images Fig.4 shows a gradual upward trend in copper prices.
Analysis of the data shows that growth in oil and silver prices will boost copper prices, but growth in gold prices will make them negative. And the copper price is in an upward trend in 2025. Therefore, the authors believe that the fluctuation of copper price is largely affected by the joint influence of the three gold and silver prices and oil prices, and the resulting influence is greater than the market on the supply and demand fundamentals of copper products. This is in line with the research of most previous scholars, and at the same time the authors realize that it is not enough to study only the impact of these three on the volatility of copper prices, and should continue to study the interactions between them.
4. Conclusion
This study analyses the impact of gold, silver and oil prices on copper prices through OLS model. The results of the data analysis show that the impact of silver and oil prices on copper prices is different from the impact of gold prices on copper prices. The first two have a significant positive impact. The latter, on the other hand, has the opposite negative impact on the copper price. The fluctuation of copper price can be well analyzed by analyzing the fluctuation of the three prices. The ARIMA model was used to fit the model of copper price over time. The best model to describe the change in copper price was identified, and the change in copper price in 2025 was predicted through this model. The model says that in 2025, copper prices as a whole will show an upward trend. It is undeniable that due to the limited amount of data, the model may have errors in addition to factors, which may affect the accuracy of the results. However, it is useful to study the fluctuations of copper prices. By referring to this paper's study on the factors affecting the fluctuation of copper price, investors can analyze the fluctuation of copper price by referring to the price of gold, silver and oil. At the same time, with reference to the results of this paper's prediction of future copper prices, investors can make more favorable decisions for themselves and make profits in the stock market.
References
[1]. Zhou Yinghua. (2023). The situation of copper industry and the change of copper price. China Metal Bulletin (04), 1-3.
[2]. Delatte A L, Lopez C. Commodity and equity markets:Some stylized facts from a copula approach[J].Journal of Banking & Finance, 2013,37(12):5346-5356
[3]. Wong Chai. (2022). A study on the impact of international copper futures price volatility on the share price volatility of A-share copper industry listed companies M.S. (Dissertation, Hunan University). M.S.
[4]. Hashmi, Shabir Mohsin, Farhan ,Alhayki, Zainab, Syed , Aamir Aijaz. The impact of crude oil prices on Chinese stock markets and selected sectors: evidence from the VAR-DCC-GARCH model[J]. Environmental Science and Pollution Research,2022 (prepublish).
[5]. Kliber Agata, Let Blanka. Degree of connectedness and the transfer of news across the oil market and the European stocks[J]. Energy,2022,239(PC).
[6]. TAN Xiaofen, ZHANG Junxiao, ZHENG Xinru. Two-way spillover effects between international commodity markets and financial markets - An empirical study based on BEKK-GARCH model and spillover index method[J]. China Soft Science,2018(08): 31-48.
[7]. ZHAO Xinquan,MENG Xiaohua. Research on extreme risk spillover effects of international commodities and China's stock market[J]. Statistics and Decision Making,2018,34(04):164-167.
[8]. XIONG Coix, WANG Zicheng, SUN Zhaopeng, et al. A study on the correlation between crude oil price and gold price--an interval analysis based on structural breakpoints[J]. Price Theory and Practice,2016(04):113-116. DOI:10.19851/j.cnki.cn11-1010/f.2016.04.029.
[9]. Liu Yinglin, Ju Zhuo, Liu Yonghui. Research on the financialization of Chinese commodities based on DCC-GARCH [J]. International Business Research, 2017(5);75-83201
[10]. Krippner, G. R. (2005). The financialization of the American economy. Socio-economic review, 3(2), 173-208.
Cite this article
Meng,F. (2024). Copper Price Correlation Analysis and 2025 Copper Price Forecast. Advances in Economics, Management and Political Sciences,99,98-104.
Data availability
The datasets used and/or analyzed during the current study will be available from the authors upon reasonable request.
Disclaimer/Publisher's Note
The statements, opinions and data contained in all publications are solely those of the individual author(s) and contributor(s) and not of EWA Publishing and/or the editor(s). EWA Publishing and/or the editor(s) disclaim responsibility for any injury to people or property resulting from any ideas, methods, instructions or products referred to in the content.
About volume
Volume title: Proceedings of ICFTBA 2024 Workshop: Finance in the Age of Environmental Risks and Sustainability
© 2024 by the author(s). Licensee EWA Publishing, Oxford, UK. This article is an open access article distributed under the terms and
conditions of the Creative Commons Attribution (CC BY) license. Authors who
publish this series agree to the following terms:
1. Authors retain copyright and grant the series right of first publication with the work simultaneously licensed under a Creative Commons
Attribution License that allows others to share the work with an acknowledgment of the work's authorship and initial publication in this
series.
2. Authors are able to enter into separate, additional contractual arrangements for the non-exclusive distribution of the series's published
version of the work (e.g., post it to an institutional repository or publish it in a book), with an acknowledgment of its initial
publication in this series.
3. Authors are permitted and encouraged to post their work online (e.g., in institutional repositories or on their website) prior to and
during the submission process, as it can lead to productive exchanges, as well as earlier and greater citation of published work (See
Open access policy for details).
References
[1]. Zhou Yinghua. (2023). The situation of copper industry and the change of copper price. China Metal Bulletin (04), 1-3.
[2]. Delatte A L, Lopez C. Commodity and equity markets:Some stylized facts from a copula approach[J].Journal of Banking & Finance, 2013,37(12):5346-5356
[3]. Wong Chai. (2022). A study on the impact of international copper futures price volatility on the share price volatility of A-share copper industry listed companies M.S. (Dissertation, Hunan University). M.S.
[4]. Hashmi, Shabir Mohsin, Farhan ,Alhayki, Zainab, Syed , Aamir Aijaz. The impact of crude oil prices on Chinese stock markets and selected sectors: evidence from the VAR-DCC-GARCH model[J]. Environmental Science and Pollution Research,2022 (prepublish).
[5]. Kliber Agata, Let Blanka. Degree of connectedness and the transfer of news across the oil market and the European stocks[J]. Energy,2022,239(PC).
[6]. TAN Xiaofen, ZHANG Junxiao, ZHENG Xinru. Two-way spillover effects between international commodity markets and financial markets - An empirical study based on BEKK-GARCH model and spillover index method[J]. China Soft Science,2018(08): 31-48.
[7]. ZHAO Xinquan,MENG Xiaohua. Research on extreme risk spillover effects of international commodities and China's stock market[J]. Statistics and Decision Making,2018,34(04):164-167.
[8]. XIONG Coix, WANG Zicheng, SUN Zhaopeng, et al. A study on the correlation between crude oil price and gold price--an interval analysis based on structural breakpoints[J]. Price Theory and Practice,2016(04):113-116. DOI:10.19851/j.cnki.cn11-1010/f.2016.04.029.
[9]. Liu Yinglin, Ju Zhuo, Liu Yonghui. Research on the financialization of Chinese commodities based on DCC-GARCH [J]. International Business Research, 2017(5);75-83201
[10]. Krippner, G. R. (2005). The financialization of the American economy. Socio-economic review, 3(2), 173-208.