


1. Introduction
Cold chain logistics generally refers to the system wherein perishable products, such as fresh food, pharmaceuticals, and vaccines, are consistently maintained within a specified low-temperature environment to preserve their value [1, 2]. Within the food supply system, the cold chain holds the potential to safeguard food safety and reduce food losses [3].
In 2023, China’s total production of fruits and meats accounted for 30% of the global output. Yet, the proportion of fruits and vegetables transported via cold chain logistics is merely 5%, indicating a significant deficiency in China’s cold chain coverage. Previous research as early as 2015 has linked economic losses in fruit products to the development of the cold chain, highlighting those insufficient conditions during storage and transportation lead to annual food wastage of 8% and 25%, respectively, culminating in an estimated loss of around 12 million tons of fruits and over 100 billion yuan [4]. Furthermore, the waste of fruits and other foods also impacts the environment, contributing approximately 3.3 billion tons of carbon dioxide equivalent [5]. Nonetheless, enhancing the current cold chain coverage implies increased use of refrigerants, consumption, and potential energy leaks, among the primary causes of global warming. Consequently, while seeking to optimize the cold chain for fruits to address economic and environmental resource wastage, it is essential to consider whether the potential negative effects counteract the research objectives.
2. Fruit Cold Chain Logistics: Challenges and Phase Change Materials (PCMs) Solutions
The fruit cold chain process is critical for preserving the quality of perishable goods from harvest to the consumer. It involves distinct stages such as It involves distinct stages such as pre-cooling, storage, transportation, and retail [5, 6].
Based on the analysis of previous studies, the main problems of the fruit cold chain are concentrated in the pre-cooling, transportation and storage stages. The pre-cooling and storage components are often characterized by broken chains, insufficient capacity, uneven distribution, and high unit costs. At the same time, the challenges in the transportation phase are rooted in the need for refrigerated truck coverage. These provide entry points for this study on improving the whole process of fruit cold chain transportation.
Existing cold chain systems, particularly in China, have been predominantly active-type, relying on conventional compression refrigeration. However, the increasing demand for energy and the finite nature of non-renewable resources have highlighted the need to enhance energy efficiency and reduce losses within these systems. Issues manifest at various stages of the cold chain, necessitating innovative approaches to maintain temperature control and reduce energy consumption [7, 8].
Phase Change Materials (PCMs) emerge as a promising solution. As materials that can absorb and release thermal energy during their phase transition, PCMs are ideal for maintaining required temperatures over extended periods. They offer a passive refrigeration alternative, which can significantly cut energy usage by utilizing the latent heat properties of PCMs to sustain consistent low temperatures during storage and transport [9]. Various PCMs available for different refrigeration scenarios provide a versatile option for enhancing cold chain logistics [10].
One practical application is the semi-electric refrigerated vehicle developed by Pluss Advanced Technologies Pvt. Ltd., which integrates PCM technology with traditional refrigeration methods. This passive energy storage solution maintains temperature and humidity for up to 14 hours, reducing operational costs by 61.9% and minimizing temperature fluctuations [9]. Additionally, retrofitting existing cold storage with PCM materials during off-peak hours offers a cost-effective method to lower electricity expenses by 20% to 50%. These applications and ongoing innovations underscore the significant potential of PCMs in transforming cold chain logistics, promising a more sustainable and efficient future for the industry.
3. Case Description
The research case study focuses on the cold chain transportation of apples, tracing their journey from the production hub in Qixia City, Shandong Province, to the Freshippo retail store in Shenzhen, Guangdong Province, within the context of China’s thriving fresh food e-commerce market, projected to reach 630.2 billion yuan by 2026. Freshippo, holding 31.0% of consumer preferences and ranking third among fresh food e-commerce platforms in China, stands out due to its hybrid online-offline business model, enabling it to expand its market share amidst industry challenges. Given the critical role of apples in China's agricultural landscape and their specific temperature requirements (freezing point: -2.0 to -2.4 degrees Celsius; ideal storage temperature: -0.5 to 1 degrees Celsius), particularly during the 2076-kilometer journey from Shandong to Guangdong, this case study aims to explore the impacts of regional climate variations and long-distance transportation on the cold chain's integrity. Drawing on existing cold chain logistics research and practical models, the study will analyze the challenges and key activities involved in maintaining the freshness of apples throughout the cold chain stages, as illustrated in Figure 1.
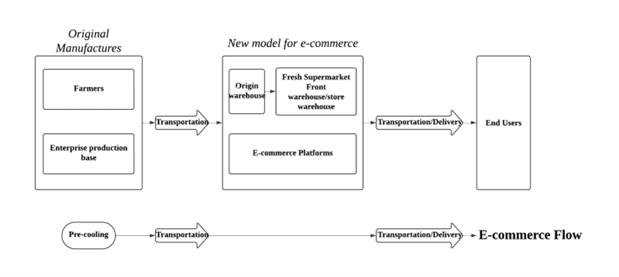
Figure 1: The challenges and key activities in the freshness of apples in the cold chain stage.
Before the PCM application, the stages with used tools of two models as shown in Figure 2.
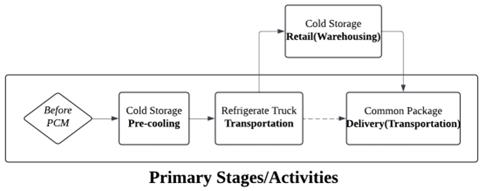
Figure 2: The stages with used tools of two models before the PCM application.
Freshippo possesses a leading e-commerce cold chain logistics model in China, characterized by its industry-leading practices of direct sourcing from the origin and pre-positioned warehouses. This model serves as a direct representation of Freshippo's operational framework. To illustrate this, in a specific case, apples are meticulously hand-picked at the orchard and swiftly transported to the nearby Deyu cold storage facility, located approximately 11 kilometers away, where they undergo a rigorous 2-hour precooling process (pre-cooling stage). Subsequently, employing refrigerated trucks, typically mechanical refrigerated trucks, the apples are transported over 2065 kilometers to reach the Freshippo retail store at Huan Ting Square in Shenzhen (transportation stage). This meticulous transportation process ensures the maintenance of optimal temperature conditions. Finally, adhering to online order specifications, delivery riders are efficiently coordinated to facilitate the last-mile delivery, ensuring the apples are promptly delivered to consumers within a 3-kilometer radius of the store (delivery stage).
4. Methodology
4.1. Assumptions and key parameters of this study
Apples’ food loss rate in different stages under Freshippo e-commerce: According to Freshippo's report, Freshippo can now control the food loss rate of the whole cold chain at 5%, so the cold chain transportation of apples in e-commerce mode will adopt this loss rate. Combining with the literature, the loss rates of apples at each stage of circulation are calculated as shown in Table 1 [11].
Table 1: The Food Loss Rate in each stage under the Freshippo e-commerce model
| Food Loss Rate for stages | |
| Stages | Food Loss Rate |
| Precooling Stage | 3.81% |
| Transportation Stage | |
| Delivery Stage | 1% |
| Whole Process | 5% |
Carbon footprint factors for fuel & electricity consumption: Based on existing articles, the carbon emission factors for the fuels used in this study and the electricity consumed are shown in Table 2 [11].
Table 2: Carbon footprint (carbon emissions) factor of main stages.
| Carbon footprint of main link | |||
| Activity(stage) | Type | Footprint | Data Source |
| Pre-cooling | Electricity | 785g/(kWh) | [12] |
| Transportation | Electricity | 785g/(kWh) | [12] |
| Diesel fuel | 581.4g/km | [13] | |
Electricity consumption per 10 tonnes of apples in cold storage: 10 tonnes cover 40 CBM (cubic meters) in a refrigerated space and consume 4.5 kWh of electricity per hour.
Conversion costs at the pre-cooling/warehousing stages due to PCM modifications: As shown in Table 3.
Table 3: Cost comparison of retrofit devices.
| Device conversion cost | |||
| Cold chain facility | Installation Cost (¥/40 cbm) | Useful Life (years) | Data Source |
| Cold storage | 5000 | 10 | Public Quotation |
| PCM cold storage | 937.5 (12 for 0.512 cbm) | 25 | |
The cost of energy consumption in the fruit cold chain process: Electricity prices vary depending on the location of the key nodes, as shown in Table 4.
Table 4: Electricity prices.
| Price Level for two types of consumption | ||||
| Consumption Type | Region | Price Level(¥/kWh) | Average(¥/kWh) | Data Source |
| Electricity | Shandong | Peak 1.07 | 0.73 | Government Announcement |
| Off-peak 0.42 | ||||
| Standard 0.71 | ||||
| Shenzhen | Peak 1.54 | 0.95 | ||
| Off-peak 0.31 | ||||
| Standard 1 | ||||
4.2. Data Treatment
4.2.1. Electricity Consumption Carbon Emission Calculation
The carbon emissions (E1) from electricity consumption are calculated using the equation E1 = ACe * EFe [11]. Here, E1 represents the carbon emissions in kilograms of CO2 (kgCO2) resulting from the electricity used by an operating unit (enterprise) during a specific statistical period. ACe denotes the amount of electricity the enterprise purchases in kilowatt-hours (kWh), and EFe is the region-specific carbon footprint factor for electricity consumption, expressed in kilograms of CO2 per kilowatt-hour (kg CO2/kWh). This calculation is significant for the pre-cooling and warehousing stages in cold storage operations, where electricity consumption is multiplied by the CO2 emission factor to determine the total emissions.
4.2.2. Fuel Consumption Carbon Emission Calculation
For fuel consumption, carbon emissions (E2) are calculated using the formula: E2 = A * C [11]. In this context, E2 is the total carbon emissions from fuel usage, measured in kilograms of CO2 (kgCO2). The variable A stands for the total fuel consumption by trucks, measured in liters (L), and C is the carbon footprint factor for fuel consumption, specified in kilograms of CO2 per liter (kg CO2/L). This calculation is particularly relevant for the transportation stages, where the fuel consumption for the entire transport distance is calculated (distance multiplied by fuel consumption per kilometer) and then multiplied by the carbon footprint factor to obtain the total emissions.
5. Case Analysis
After the PCM application, the stages with the tools used by the two models are shown in Figure 2. In the e-commerce model, the application of PCM has not altered the stages or the quantity of the apple cold chain logistics, but there has been a change in the tools utilized at each stage.
(words in blue=stage name; words in black below blue=tools been used in each stage)
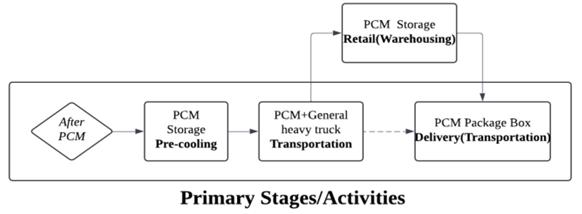
Figure 3: The stages with used tools under E-commerce after applying PCM.
5.1. Pre-cooling Stage
Freshippo's direct procurement from the source eliminates the need to send apples to Deyu cold storage for 2 hours of pre-cooling. Instead, Freshippo's production bases or suppliers are permitted to directly use any space near the agricultural fields to complete the retrofitting of PCM cold storage.
In the specific scenario of this study, the production base output and the initial transportation amount for the apple cold chain are based on the carrying capacity of a standard heavy-duty truck, which is 10 tons of apples.
Prior to the implementation of PCM technology, these 10 tons of apples would be transported by a standard heavy-duty truck, devoid of any refrigeration facilities, to the Deyu cold storage facility located 11 kilometers away, 24 minutes from the “Four Season Field” production base for a two-hour pre-cooling session immediately after harvesting. These incurred include fuel expenses, truck driver wages, electricity costs for pre-cooling (based on the average electricity price), and cold storage equipment expenses (averaged hourly).
After the adoption of PCM technology, the 10 tons of apples would be directly taken to a PCM-equipped cold storage facility next to the field at the production base for pre-cooling treatment post-harvest. Normally, to cool a smaller area, a greater amount of electricity per unit of volume is required. However, due to PCM's unique thermal storage properties, which effectively regulate temperature variations and ensure a stable cooling effect, electricity consumption is reduced. Based on experimental data and the context of this case, it is estimated that only 50% of the pre-retrofit electricity would be consumed in the PCM-equipped cold storage. Moreover, PCM typically leverages off-peak electricity rates for thermal storage. Consequently, the costs would comprise the pre-cooling electricity expense and the PCM cold storage retrofitting costs (averaged hourly).
The comparative costs before and after the retrofitting will be outlined as follows in Table 5 and Table 6.
Table 5: The comparative costs calculation before/after PCM application in pre-cooling
The comparative costs before and after PCM Application per 10 tonnes of apples (¥) |
|||||
Mode |
Fuel Expense |
Truck driver wages |
Electricity cost |
Equipment expenses |
Total Cost |
Before |
19.50 |
22.50 |
6.57 |
0.11 |
48.68 |
After |
- |
- |
1.89 |
0.01 |
1.90 |
Table 6: Comparison of carbon emissions before/after applying PCM in pre-cooling
Comparison of carbon emissions before and after applying PCM per 10 tonnes of apples (kg CO2) |
|||
Mode |
Carbon emissions of electricity |
Carbon emissions of fuel |
Total carbon emissions |
Before |
6.40 |
7.07 |
13.46 |
After |
- |
3.53 |
3.53 |
5.2. Transportation Stage
It replaces the original refrigerated truck transport with transforming PCM devices on general heavy trucks. Due to existing technological barriers, achieving PCM trucks that do not require electricity for energy storage is still impossible. Based on practical application solutions, in this case, general heavy trucks equipped with PCM still need electricity for energy storage. Still, they reduce operating costs by 61.9% and consume 50% less electricity than before.
The loss rate of apples in circulation should have been emphasized. Still, due to Freshippo already achieving full cold chain coverage before applying PCM transformation, it is difficult to calculate the losses generated between the pre-cooling and long-distance transportation stages. In this stage, the calculation will be completed based on the transportation volume of 10 tons of apples without considering the loss amount. However, it should still be mentioned that compared to the unstable temperature control of refrigerated warehouses in the past, the more stable temperature control ability of PCM devices in refrigerated warehouses will have a more prominent effect on reducing the apple food loss rate.
Therefore, the costs before the transformation should include fuel costs for 2065 kilometers, truck driver wages for 20.5 transport hours, refrigeration electricity costs for refrigerated trucks (based on the average electricity price in Shandong), and truck equipment costs (calculated based on hours of usage). The costs after the transformation include fuel costs for 2077 kilometers, truck driver wages for 20.9 transport hours, PCM heavy-duty truck refrigeration electricity costs (based on the off-peak electricity price in Shandong), and truck equipment costs, including PCM device fees (calculated based on hours of usage). As shown in Table 7 and Table 8.
Table 7: The comparative costs calculation before/after the PCM application
The comparative costs before and after PCM Application per 10 tonnes of apples (¥) |
|||||
Mode |
Fuel Expense |
Truck driver wages |
Electricity cost |
Equipment expenses |
Total Cost |
Before |
532.77 |
1153.13 |
184.50 |
36.19 |
1906.59 |
After |
311.40 |
1175.63 |
114.21 |
33.81 |
1635.04 |
Table 8: Comparison of carbon emissions before/after applying PCM
Comparison of carbon emissions before and after applying PCM per 10 tonnes of apples (kg CO2) |
|||
Mode |
Carbon emissions of electricity |
Carbon emissions of fuel |
Total carbon emissions |
Before |
1200.59 |
144.83 |
1345.42 |
After |
1206.99 |
73.83 |
1280.82 |
5.3. Delivery Stage
In the final delivery stage, the previously neglected apple food loss rate should be returned because this involves the quantity of last-mile delivery orders. However, due to the inability to determine the extent to which PCM application alleviates the food loss rate, there needs to be reliable data on apple quantity that can be used for the final stage calculation.
Nevertheless, the transformation plan is currently the most practical and achievable among all existing applications on the market, as the working principle of PCM insulated boxes is similar to insulated boxes commonly found in the market. By replacing ordinary boxes made only of insulating materials such as aluminum foil with PCM Isolated boxes, more stable temperature control can be achieved to reduce the last-mile delivery loss rate of fresh e-commerce by 1% without any carbon emissions.
6. Suggestions
The cost result and carbon emissions differences were identified by implementing the PCM solution in the two main fruit cold chain research stages.
After the transformation in the e-commerce fruit cold chain model of Freshippo, the total cost decreased by 16.28%, equivalent to ¥318.33. The total carbon emissions decreased by 5.49%, 74.54kg CO2. These savings are just for a single transport of 10 tonnes of apples. Additionally, this does not include the savings from reducing food loss rates during circulation due to the application of PCM, which can reduce the ecological carbon footprint.
However, based on the above data, it can still be concluded that applying PCM for optimizing fruit cold chains is a promising direction to consider, as it brings economic and environmental benefits.
7. Conclusion
To explore optimization strategies for the fruit cold chain, this study first clarified the background: the insufficient development of the cold chain and the need to reduce costs, increase efficiency, and achieve carbon neutrality in society. Next, it identified the problems in the fruit cold chain and found a new technology to address them. A dual standard of economic and social benefits was established to investigate the efficiency of the optimization strategies, namely the main activity costs and carbon emissions. Real data was collected through a specific case study of transporting apples from Shandong to Guangdong by Freshippo in 2022, and formulas supported calculations. Ultimately, through comparison, it was found that the application of PCM can effectively solve the problems in the main activities of the fruit cold chain to a certain extent and achieve dual benefits. Therefore, this study's optimization strategy for the fruit cold chain has proven valuable for reference.
In the future, more research can focus on the detailed loss rates of various stages of agricultural products during circulation to more accurately identify issues and explore how to cater to the trend of sustainable development by reducing resource waste.
References
[1]. Zhang, Y., Ma, T., Abdul, R. K. S., & Arshian, S. (2018, December). The study on efficient cold chain logistics. In 2018 2nd International Conference on Economic Development and Education Management (ICEDEM 2018) (pp. 475-478). Atlantis Press.
[2]. Zheng, C., Peng, B., & Wei, G. (2021). Operational risk modeling for cold chain logistics system: a Bayesian network approach. Kybernetes, 50(2), 550-567.
[3]. Hu, G., Mu, X., Xu, M., & Miller, S. A. (2019). Potentials of GHG emission reductions from cold chain systems: case studies of China and the United States. Journal of Cleaner Production, 239, 118053.
[4]. Zhao, H., Liu, S., Tian, C., Yan, G., & Wang, D. (2018). An overview of the current status of the cold chain in China. International journal of refrigeration, 88, 483-495.
[5]. Rezaei, M., & Liu, B. (2017). Food loss and waste in the food supply chain. International Nut and Dried Fruit Council: Reus, Spain, 26-27.
[6]. Parashar, V., Haleem, A., & Usmani, J. A. (2020). A Low-Cost Cold Chain Suggestion for Indian Fruit and Vegetable. In Recent Advances in Mechanical Engineering: Select Proceedings of NCAME 2019 (pp. 71-77). Springer Singapore.
[7]. Bai, B., Zhao, K., & Li, X. Z. (2019). Application research of nano-storage materials in cold chain logistics of e-commerce fresh agricultural products. Results in Physics, 13, 102049.
[8]. Zhao, X. X., Xia, M., Guan, W. L., et al. (2020). Research and application of cool storage technology in storing and transporting fresh fruits and vegetables. Storage and Process, 20(01), 217-225.
[9]. Zhang, H., Wan, X., Chen, Y., & Guo, B. (2021). Research progress of phase change cold storage materials in cold chain logistics. China Plastics, (04), 106-115.
[10]. Wang, R., Wu, W. D., & Wu, J. (2019). Research development on phase change materials for cold chain logistics. Energy Research and Information, 35(01), 1-8.
[11]. Li, T., Cheng, G., Huang, J., Fan, X., & Lu, S. (2021). Comprehensive footprint assessment of apple and citrus loss and waste. Chinese Journal of Eco-Agriculture, 29(4), 683-690.
[12]. Tang, Xingchun. (2012). Application of product life cycle evaluation method in economic management. Enterprise Science and Technology and Development (24), 50-51+54.
[13]. Liao, Jing, Xie, Ruhe, Detailed Jie, Tang, Ocean, Luo, Huqiao & Chen, Zibo. (2019). Carbon footprint measurement analysis and empirical study on the whole cold chain logistics of litchi. Packaging Engineering (03), 19-29.
Cite this article
Hu,Z. (2024). Optimization Strategies of Phase Change Materials Applied in Fruit Cold Chain: Apples Transportation of Freshippo. Advances in Economics, Management and Political Sciences,103,16-24.
Data availability
The datasets used and/or analyzed during the current study will be available from the authors upon reasonable request.
Disclaimer/Publisher's Note
The statements, opinions and data contained in all publications are solely those of the individual author(s) and contributor(s) and not of EWA Publishing and/or the editor(s). EWA Publishing and/or the editor(s) disclaim responsibility for any injury to people or property resulting from any ideas, methods, instructions or products referred to in the content.
About volume
Volume title: Proceedings of the 8th International Conference on Economic Management and Green Development
© 2024 by the author(s). Licensee EWA Publishing, Oxford, UK. This article is an open access article distributed under the terms and
conditions of the Creative Commons Attribution (CC BY) license. Authors who
publish this series agree to the following terms:
1. Authors retain copyright and grant the series right of first publication with the work simultaneously licensed under a Creative Commons
Attribution License that allows others to share the work with an acknowledgment of the work's authorship and initial publication in this
series.
2. Authors are able to enter into separate, additional contractual arrangements for the non-exclusive distribution of the series's published
version of the work (e.g., post it to an institutional repository or publish it in a book), with an acknowledgment of its initial
publication in this series.
3. Authors are permitted and encouraged to post their work online (e.g., in institutional repositories or on their website) prior to and
during the submission process, as it can lead to productive exchanges, as well as earlier and greater citation of published work (See
Open access policy for details).
References
[1]. Zhang, Y., Ma, T., Abdul, R. K. S., & Arshian, S. (2018, December). The study on efficient cold chain logistics. In 2018 2nd International Conference on Economic Development and Education Management (ICEDEM 2018) (pp. 475-478). Atlantis Press.
[2]. Zheng, C., Peng, B., & Wei, G. (2021). Operational risk modeling for cold chain logistics system: a Bayesian network approach. Kybernetes, 50(2), 550-567.
[3]. Hu, G., Mu, X., Xu, M., & Miller, S. A. (2019). Potentials of GHG emission reductions from cold chain systems: case studies of China and the United States. Journal of Cleaner Production, 239, 118053.
[4]. Zhao, H., Liu, S., Tian, C., Yan, G., & Wang, D. (2018). An overview of the current status of the cold chain in China. International journal of refrigeration, 88, 483-495.
[5]. Rezaei, M., & Liu, B. (2017). Food loss and waste in the food supply chain. International Nut and Dried Fruit Council: Reus, Spain, 26-27.
[6]. Parashar, V., Haleem, A., & Usmani, J. A. (2020). A Low-Cost Cold Chain Suggestion for Indian Fruit and Vegetable. In Recent Advances in Mechanical Engineering: Select Proceedings of NCAME 2019 (pp. 71-77). Springer Singapore.
[7]. Bai, B., Zhao, K., & Li, X. Z. (2019). Application research of nano-storage materials in cold chain logistics of e-commerce fresh agricultural products. Results in Physics, 13, 102049.
[8]. Zhao, X. X., Xia, M., Guan, W. L., et al. (2020). Research and application of cool storage technology in storing and transporting fresh fruits and vegetables. Storage and Process, 20(01), 217-225.
[9]. Zhang, H., Wan, X., Chen, Y., & Guo, B. (2021). Research progress of phase change cold storage materials in cold chain logistics. China Plastics, (04), 106-115.
[10]. Wang, R., Wu, W. D., & Wu, J. (2019). Research development on phase change materials for cold chain logistics. Energy Research and Information, 35(01), 1-8.
[11]. Li, T., Cheng, G., Huang, J., Fan, X., & Lu, S. (2021). Comprehensive footprint assessment of apple and citrus loss and waste. Chinese Journal of Eco-Agriculture, 29(4), 683-690.
[12]. Tang, Xingchun. (2012). Application of product life cycle evaluation method in economic management. Enterprise Science and Technology and Development (24), 50-51+54.
[13]. Liao, Jing, Xie, Ruhe, Detailed Jie, Tang, Ocean, Luo, Huqiao & Chen, Zibo. (2019). Carbon footprint measurement analysis and empirical study on the whole cold chain logistics of litchi. Packaging Engineering (03), 19-29.