


1. Introduction
The video streaming industry is currently valued at over $500 billion. It is expected to grow to over $1.9 trillion by 2030 at a CAGR of 19.3%. With that, the streaming platforms continue to rise [1]. Netflix is a leading company in streaming services with over 260 million paid memberships in over 190 countries and took up 20% market share in 2023 Q2. Even though Netflix stays on the top lists and has the most significant number of subscribers, its market share has shrunk in recent years by around 30% compared to 2021 (50%) [2]. Meanwhile, the video streaming industry has a lot of competitors, and they are burgeoning in rocket paces—for example, Amazon Prime Video, Apple TV+, Disney+, Hulu, etc.
According to the 2023 annual report, by region, Netflix has four main markets: the U.S. and Canada (UCAN), Europe, the Middle East, and Africa (EMEA), Latin America (LATAM), and Asia-Pacific (APAC), creating the local characteristics TV series or movies to fulfill the international and diverse requirements [3]. For example, Squid Game, differing from the traditional romantic K-drama, it made history at 2022’s SAG Awards.
As for business segments, Netflix operates as one operating segment; contents are derived from two main methods: licensed or produced (original). In 2023, Netflix had $12.72 billion in licensed content assets and $18.94 billion in produced content assets. According to the financial statement, Netflix is trying to increase the portion of original content and decrease the licensing at the same time.
Netflix’s revenues are primarily derived from membership fees for services related to streaming content for their customers, and these revenues increased by 7% to $33,640,458 in 2023. The other business is traditional DVD renting, decreasing 43% from 2022. Overall, compared with 2022, the total revenues increased by 7%. Including licensed content and produced content, in 2023, Netflix had $12.72 billion in licensed content assets and $18.94 billion in produced content assets [3]. According to the financial statement, Netflix is trying to increase the portion of original content and decrease the licensing at the same time.
On May 23rd, 2023, Netflix announced the crackdown on the password-sharing policy [4]. As Netflix’s assessment, due to that policy, brought out in 2019 to face the decline of subscribers, there were at least 1 billion users sharing accounts with others. On April 18th, 2024, Netflix said it would stop telling the world how many subscribers it has. This partly triggered a fall in stock prices on April 19. This paper will analyze Netflix’s financial performance, valuation evaluation, strategy & risks by comparing it with four other competitors.
2. Performance Evaluation
The financial report shows the company's operation well-being [5]. To better analyze Netflix's current financial condition and security, the top 5 companies in the entertainment industry are selected as comparisons. However, different companies have unique business segment markets and main businesses. Netflix is the only pure player as a streaming service platform. The other four competitors are all established US linear providers, to some extent, all having the streaming segments by acquiring or building up subsidiaries. For example, Walt Disney has the original Disney+, and they took over Hulu’s complete operational control from Comcast to expand their market share in November 2023, keeping ESPN+ in Sports entertainment. Paramount Global, which was ViacomCBS, debuted its Paramount+ in 2021. Comcast’s typical platforms are Peacock and Sky, and WBD has HBO Max. Here are the performance evaluations from liquidity, solvency, and profitability [5].
2.1. Liquidity
Table 1: Liquidity ratios of Netflix and its competitors.
Company Name | Current ratio | Quick ratio | Cash ratio |
Netflix | 1.12 | 1.12 | 0.68 |
Walt Disney | 1.05 | 0.99 | 0.46 |
PARA | 1.29 | 1.03 | 0.25 |
Comcast | 0.60 | 0.49 | 0.15 |
WBD | 0.93 | 0.64 | 0.25 |
Data source: Yahoo Finance & Stock Analysis
Generally, Netflix did a great job in liquidity management. It can be seen from Table 1 that its current ratio, quick ratio, and cash ratio all showed at leading levels. Notably, both its current and quick ratios reached 1.12, and its cash ratio is 0.68, meaning that Netflix has sufficient current assets to pay off its current liability while keeping ample cash piles and instantly realizable assets. Notably, Netflix's balance sheet does not reflect its inventory. This may be because Netflix products are basically digital film and television productions; everything in the Netflix library is open to its subscribers. So, they have very little, if any, negligible inventory. This results in an equal rate of current ratio and quick ratio. At the same time, it can be seen from the quick ratio that they have a large number of assets that can be instantly realized. This may be because the content is copyrighted most of the time; as long as they sell their film and TV content to other companies or reap a lot of new subscribers, they can get a lot of cash immediately.
However, a higher cash ratio also presents an insufficient usage of their cash. Netflix can use that cash to invest in some external potential investment opportunity, a standard method for publicly traded companies to manage their assets. According to Netflix’s announcement in May 2023, its expenses are directly associated with content acquisition, licensing, and production. Furthermore, based on the increasingly saturated North American market, Netflix must expand the international market, build up overseas offices, cultivate local teams, and acquire local studios to produce content that matches subscribers’ tastes.
By contrast, other companies in the industry, such as Comcast, Walt Disney, Paramount Global, and WBD, generally have lower liquidity data. For example, Comcast has a liquidity ratio of only 0.60, a quick ratio of 0.49, and a cash ratio of 0.15, to some extent indicating that Comcast may be facing liquidity crises that make it challenging to meet their short-term liabilities [6]. The liquidity indicators for Walt Disney and WBD are relatively low. These data comparisons highlight Netflix's liquidity advantage, demonstrating that it is more solvent and flexible in the short term, providing a solid financial basis for its continued growth. It also indicates the prospective future of the streaming industry.
2.2. Solvency
Table 2: Solvency ratios of Netflix and its Ccmpetitors.
Company Name | Total Debt Ratio | Long-Term Debt Ratio | Times-Interest-Earned |
Netflix | 0.58 | 0.29 | 9.29 |
Walt Disney | 0.45 | 0.20 | 3.42 |
Paramount Global | 0.57 | 0.27 | -0.36 |
Comcast | 0.68 | 0.36 | 6.01 |
WBD | 0.62 | 0.34 | -0.74 |
Data source: Yahoo Finance & Stock Analysis
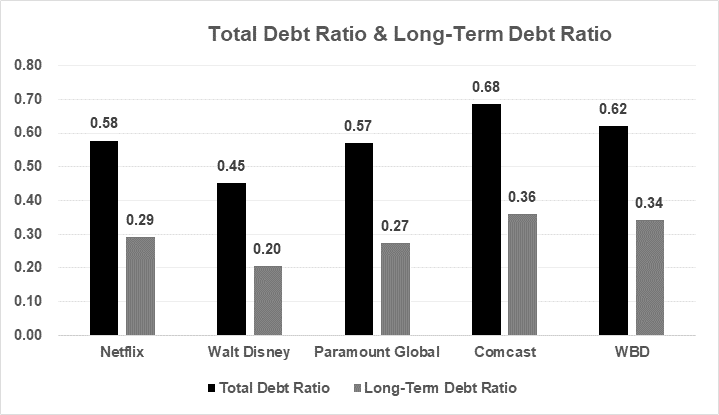
Figure 1: Total debt ratio and long-term debt ratio (Photo/Picture credit: Original).
Solvency ratios indicate whether a company’s cash flow is sufficient to meet its long-term liabilities and thus measure its financial health. An unfavorable ratio can indicate some likelihood that a company will default on its debt obligations.
Based on the company's total liabilities as a percentage of its total assets, Netflix's 0.58 indicates that more than half of its assets are financed through debt (see Table 2). Still, Netflix's performance is at the median of five companies, mainly on the industry average, by industry comparison, as Figure 1 shown. At the same time, in terms of long-term debt ratios, Netflix relies relatively less on long-term debt financing and tends to use short-term debt or other financing instruments. However, Netflix has a much higher interest protection multiple (9.29) than its competitors, indicating that it is more profitable to cover its interest costs. In contrast, Paramount Global and WBD's interest protection multiplier is negative, showing that their earnings are insufficient to cover interest costs, which may increase their debt servicing risk.
In case Netflix might meet some massive repayment due, after checking its 2023 annual report, it indicates that Netflix has less pressure to repay in 2024. However, in FY 2025, it will be necessary to repay the $1,819 million long-term debt. In addition, long-term liabilities of up to $3,500 million must be repaid even in FY 2028. Netflix, which may currently appear to have less pressure on long-term debt, will have more repayment pressure in 2025 and 2028. Despite its low long-term debt ratio, Netflix's interest protection multiplier remains high, indicating a more cautious financial strategy to ensure long-term solvency.
2.3. Profitability
Table 3: Profitability ratios of Netflix and its competitors.
Company Name | Profit Margin | Operating Margin | Asset Turnover |
Netflix | 16.00% | 21.00% | 69.00% |
Walt Disney | 3.00% | 10.00% | 44.00% |
Paramount Global | -2.00% | -2.00% | 51.00% |
Comcast | 13.00% | 19.00% | 47.00% |
WBD | -8.00% | -2.00% | 31.00% |
Data source: Yahoo Finance & Stock Analysis
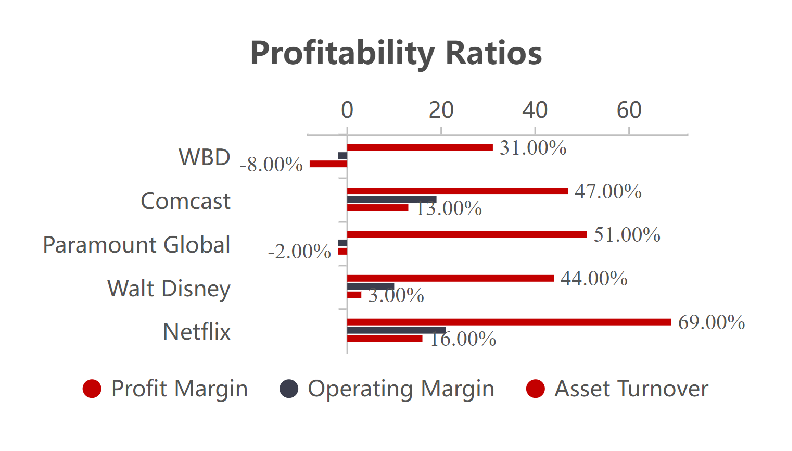
Figure 2: Profitability ratios (Photo/Picture credit: Original).
According to Table 3, Netflix excels at profitability. Profit Margin, Operating Margin, and Asset Turnover, 16.00%, 21.00%, and 69.00%, respectively, are significantly higher than those of other competitors. This data shows that Netflix retains higher profits per sale, its core business profitability is considerably better than that of the rest of the industry, and it leverages its assets more efficiently to generate sales. This data highlights Netflix's profitability lead (see Figure 2), allowing it to maintain a competitive edge while providing investors with more attractive investment opportunities.
Thanks to the development of the Internet, unlike traditional cable TV manufacturers, the streaming platform has broken through the ceiling as users only need to use mobile devices and watch videos individually on demand. As a result, Netflix absorbs 200 million subscribers from 192 countries. They have significantly increased subscription revenue while consistently taking the audience first in the business process. Early adoption of the "de-advertisement" strategy gained a large fan base, later by adjusting subscription plans. Give users a cost-effective viewing experience.
On the contrary, while several major media companies have primarily established a monopoly on the production, licensing, and distribution of film and television content, "Copyright + Box Office + TV Subscription + Advertising" is a rigid profit model that also prevents them from meeting the trend of the Internet era [7]. The pace of building streaming platforms is losing ground in the battleground of the streaming industry [8]. Additionally, Netflix’s global subscription model allows its content to cover members from all over the world, having higher scalability and stability, and its flexible pricing strategy will enable it to quickly adapt to the global market, for example, the secret sharing policy in 2022, and ad-offering plan in 2023.
3. Valuation
3.1. Forcast
Table 4: Valuation forcast of Netflix and its competitors.
Netflix | Walt Disney | Paramount Global | Comcast | WBD | |
Market Value Of Equity | 239.29B | 206.56B | 8.53B | 159.91B | 20.59B |
Market Value Of Debt | 16.6B | 47.69B | 16.12B | 103.68B | 47.29B |
Enterprise Value | 246.69B | 247.06B | 21.93B | 250.78B | 60.48B |
Leverage | 6.73% | 19.30% | 73.51% | 41.34% | 78.19% |
Total debt/equity (mrq) | 77.70% | 45.20% | 69.92% | 124.21% | 101.76% |
Debt-To-Equity Ratio | 0.71 | 0.47 | 0.7 | 1.17 | 0.97 |
EPS (TTM) | 12.05 | 1.63 | -2.06 | 3.48 | -1.28 |
P/E Ratio (TTM) | 46.14 | 69.09 | N/A | 10.85 | N/A |
Marginal Corporate Tax Rate | 13.00% | 21.00% | 18.00% | 26.00% | 16.00% |
Equity Beta( \( β \) ) | 1.22 | 1.39 | 1.78 | 0.97 | 1.49 |
Business risk( \( {β_{A}} \) ) | 1.32 | 1.80 | 7.74 | 1.85 | 7.81 |
Data source: Yahoo Finance & Stock Analysis
Based on Table 4, Netflix has the highest market capitalization among all companies, surpassing established broadcast and cable TV manufacturers. This shows that the market is optimistic about Netflix's financial condition and is willing to invest in its profitability and potential growth. For leverage comparison, Netflix did not finance a large-scale debt, only 6.73%. On a side note, it has sufficient assets to uphold its expansion. Total debt/equity illustrates the company's book value ratio. Netflix has a middle-level ratio of 77.7% compared with WBD and Comcast, which is still acceptable.
\( {β_{A}} \) is a straightforward and efficient index to measure the operational risk of a corporation. As regards the calculation results, Netflix has the smallest \( {β_{A}} \) 1.32 of the five companies, but it is still above 1, which means the fluctuation is more intense than the whole market. By contrast, Paramount Global and WBD had dramatic figures of over 7, so they might have more unstable stock prices and be in an insecure position in the market, which might cause investors to have a risk of trust. Several factors generate Netflix's relatively low business risk, and the analysis below will focus on Netflix's business strategy.
3.2. Strategy & Risks
Internet and Technology Support: Communications technology breakthrough innovation, driving the global video industry into the streaming media era, Netflix captured the opportunity to transform from a DVD lens company to a streaming platform. Netflix's main service was SVOD, which is very different from traditional linear television. The users can enjoy the content whenever and wherever they want on their mobile devices, such as iPads and smartphones, so it is available to attract more consumers to shift their entertainment expenses to streaming companies like Netflix [9]. Since then, Netflix accumulated amounts of subscribers. In contrast, fewer people tended to choose linear providers [7]. Besides, since 2006, recommendation, big data, and machine learning have been critical factors in improving their service offerings to keep recommend contents that correspond to the subscribers’ interest, increasing user stickiness to the platform [10, 11]. On 2023 April 18th, Netflix officially became a technology company after it abandoned its DVD-by-mail business.
Producing original content to expand across the globe: In August 2017, Disney announced that "the partnership agreement with Netflix is no longer renewed and no new content will be available for 19 years". This means that other companies copyright the content on the platform. Termination of cooperation will directly result in losing users, especially in cases such as Marvel and Star Wars, epic films with many avid fans worldwide. Fans will choose the same streaming company because they can keep watching the movie. Similarly, fans who had left would re-subscribe to the original package for a new series season. That's the main reason Netflix insists on producing original content, and its original content attracts more users [12]. For example, in 2021, Squid Game became Netflix's most-watched TV series ever. The show had more than 132 million global viewers in the first 23 days, more than the 111 million previously counted. Wednesday II and Squid Game II are about to become public in 2024, which might lead to a new round of user growth for Netflix. The only thing that remains unchanged is that no one will buy a member of the streaming media that doesn't match the user's needs. Therefore, Apart from acquiring and licensing content from other studios or partners, Netflix keeps producing original content.
Non-Anglophone shows have been a hit. On March 14, 2024, according to Variety’s news, Netflix spent more money outside North America to produce the series. For the first time, Netflix's overseas content spending will exceed North American expenditures (see Figure 3). According to U.S. entertainment media variety 3.12 news, third-party agencies, Netflix $1.54 million this year for content production, half of which will be spent outside North America (see Figure 4). Variety's analysis suggests that content production and production costs in international markets are much lower than in the United States. American audiences have been more open to non-English content in recent years, such as the Squid Game [13]. Still, its production costs are less than 10/4 of Oddball's fourth season, and the local U.S. streaming market is getting saturated.
Under the growth pressure, streaming companies are looking to ramp up content production in other regions, producing more content consistent with local culture and aesthetics [14]. For example, as the number of subscribers in North America grows in Africa and India, streaming companies also know the need to rely on new markets for future growth.
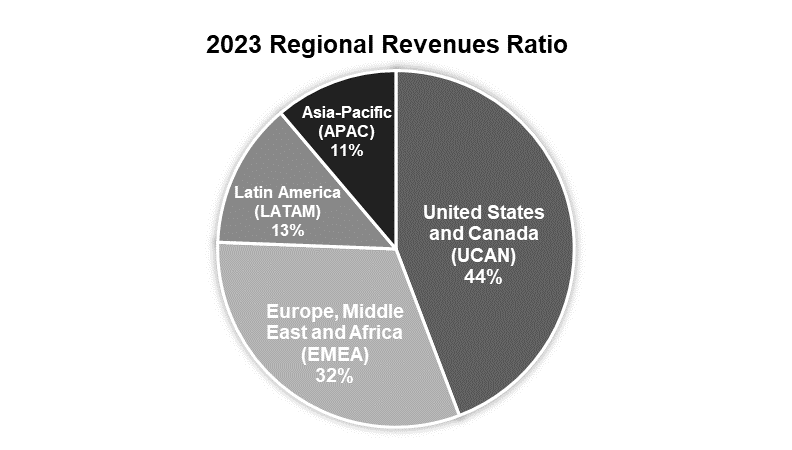
Figure 3: Regional revenues ratio in 2023 (Photo/Picture credit: Original).
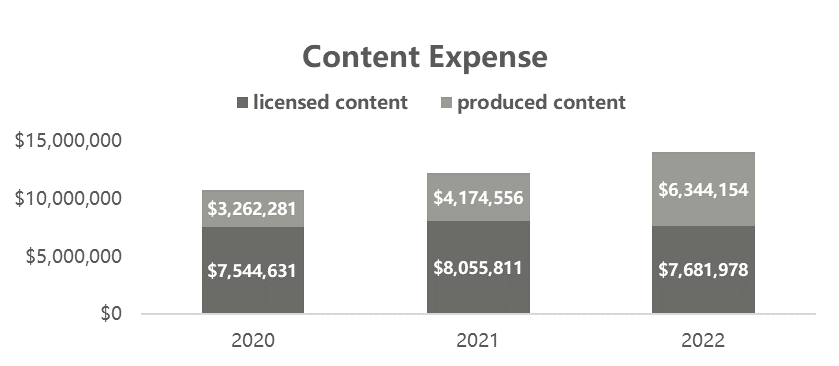
Figure 4: Content expense (Photo/Picture credit: Original).
Restrict sharing secret policy: In April 2022, Netflix introduced a shared password policy for the first time in a decade as subscribers and profits plummeted. However, on May 24, 2023, to tap potential users to inspire a new round of user growth, Netflix's new sharing policy cracks down on users using shared accounts outside of the household. They can choose to subscribe to their account alone using Netflix. Or pay per extra member for $7.99/month. Netflix gains nearly 6M subscribers as paid sharing soars [15].
Ad-supported subscription plan: Adjusting the subscription scheme, on the one hand, raising the price of the Premium from $17.99 per month to $19.99 per month and Standard from $13.99 per month to $15.49 per month, and on the other hand, introducing the low-prized + advertising plan, Netflix launched an advertised but lower-priced $6.99 pay plan in August 2022, which was chosen by about 40% of users, with significant results.
Netflix may face slowing growth. On April 18th, 2024, Netflix said it would stop telling the world how many subscribers it has every season, published only when significant milestones are reached. And they hope investors pay attention to traditional indicators such as income and operating margins. The news triggered a plunge in Netflix shares on April 19. Some analysts express their concern that revenue guidance implies a decelerating rate of sales growth in the second half of 2024, and Netflix’s announcement that it will cease reporting subscriber numbers in 2025 may be a sign subscriber growth is due to cool.
With the rise of rival streaming platforms, Netflix’s market share has kept dropping. The competitors include other streaming entertainment service providers, linear television, broadcast, etc. Different streams have matured over time to provide viewers with more quality content, posing a considerable challenge for Netflix [2].
4. Conclusion
For investors, Netflix’s current stock price is overvalued. According to the financial performance and valuation analysis, Netflix has a healthier financial condition than other competitors, Comcast, WBD, Walt Disney, and Paramount Global, with relatively higher liquidity ratios and ample cash flow to support its further strategies. Although Netflix's solvency levels are at the center of the competition, concerning Netflix's more stressful repayments in 2025 and 2028, the likelihood of successful repayment is high based on Netflix's strategy to expand revenue channels and past puncture repayment records. Netflix's profitability performance was remarkable, with three metrics higher than the rest of the business, and growing user data year on year was superficially popular.
Valuation analysis shows that Netflix has a lower business risk with lower \( {β_{A}} \) . Besides, despite the North American streaming industry’s growth gradually slowing down, competitors quickly capture market share. Netflix is actively responding to market changes, including implementing global strategies, flexible alignment of subscription programs, rich revenue channels to introduce advertising, and more, controlling business risk within a healthy range. However, after the growth of the password policy and ad-supported plan, what is the subsequent increase in empowerment to support its debt?
The main contribution of this paper is to analyze the main reasons behind Netflix's frequent adjustments to subscriptions, which are stressful to Netflix's growth, as well as to analyze Netflix's unique growth strategies and risks. Help other researchers analyze the characteristics of the streaming industry and help investors understand Netflix's value, prospects, and future growth potential.
This study is limited in length and focuses on subscription plans, original content, and technology support in the Business Strategy Analysis section. Without considering Netflix's gaming business, to some extent, the research is incomplete, and future research can provide a more complete analysis of Netflix's business strategy. Financial Data Comparison In contrast to valuation analysis, this paper uses a lateral comparison approach, which mainly compares Netflix with other competitors in the entertainment industry and lacks a lateral comparison of Netflix's previous and current data.
References
[1]. Duarte, F. (2024). Video Streaming Services Stats (2024). Retrieved from https://explodingtopics.com/blog/video-streaming-stats
[2]. Sneha Pandey, I. M. (2023). Netflix’s Market Share Decline Continues In 2023: Analysis Of Leading Streaming Platforms. Retrieved from https://www.similarweb.com/blog/insights/media-entertainment-news/streaming-q1-2023/
[3]. Netflix. (2024). 2023 Netflix Annual Report. Retrieved from https://ir.netflix.net/financials/annual-reports-and-proxies/default.aspx
[4]. Netflix. (2023). Update on Sharing. Retrieved from https://about.netflix.com/en/news/update-on-sharing-may-us
[5]. Wang, Y. T., & Destech Publicat, I. (2016). Financial Analysis Based on Financial Reports and Suggestions. Paper presented at the International Conference on Management, Economics and Social Development (ICMESD), Wuhan, China.
[6]. Choudhary, M. A., & Limodio, N. (2021). Liquidity Risk and Long-Term Finance: Evidence from a Natural Experiment. The Review of Economic Studies, 89(3), 1278-1313.
[7]. Chen, R. (2023). Overview and analysis of the current development of the traditional media industry in the United States. Journal of Chinese Radio & Television, (11), 77-80.
[8]. Yu, Y. (2019). Valuation analysis of the streaming media industry based on Netflix company, Huazhong University of Science and Technology.
[9]. Zhang, C. (2023). Analysis of competitive advantage of streaming media platforms based on VRIO perspective, Donghua University.
[10]. Wayne, M. L. (2022). Netflix audience data, streaming industry discourse, and the emerging realities of ‘popular’ television. Media, Culture & Society, 44(2), 193-209.
[11]. Kübler, R., Seifert, R. & Kandziora, M. (2021). Content valuation strategies for digital subscription platforms. J Cult Econ 45, 295–326.
[12]. Wayne, M. L., & Uribe Sandoval, A. C. (2023). Netflix original series, global audiences and discourses of streaming success. Critical Studies in Television, 18(1), 81-100.
[13]. Liu, Y. (2023). A study on the global localization path of Netflix and South Korean co-produced dramas, Northeast Normal University.
[14]. Lotz, A. D. (2021). In between the global and the local: Mapping the geographies of Netflix as a multinational service. International Journal of Cultural Studies, 24(2), 195-215.
[15]. Sperling, N. (2023). Netflix Starts to Crack Down on Password Sharing. International New York Times. Retrieved from link.gale.com/apps/doc/A751163939/AONE?u=anon~2d3ee9a&sid=googleScholar&xid=7b90c22f.
Cite this article
Su,X. (2024). A Financial Analysis and Valuation of Netflix. Advances in Economics, Management and Political Sciences,103,33-41.
Data availability
The datasets used and/or analyzed during the current study will be available from the authors upon reasonable request.
Disclaimer/Publisher's Note
The statements, opinions and data contained in all publications are solely those of the individual author(s) and contributor(s) and not of EWA Publishing and/or the editor(s). EWA Publishing and/or the editor(s) disclaim responsibility for any injury to people or property resulting from any ideas, methods, instructions or products referred to in the content.
About volume
Volume title: Proceedings of the 8th International Conference on Economic Management and Green Development
© 2024 by the author(s). Licensee EWA Publishing, Oxford, UK. This article is an open access article distributed under the terms and
conditions of the Creative Commons Attribution (CC BY) license. Authors who
publish this series agree to the following terms:
1. Authors retain copyright and grant the series right of first publication with the work simultaneously licensed under a Creative Commons
Attribution License that allows others to share the work with an acknowledgment of the work's authorship and initial publication in this
series.
2. Authors are able to enter into separate, additional contractual arrangements for the non-exclusive distribution of the series's published
version of the work (e.g., post it to an institutional repository or publish it in a book), with an acknowledgment of its initial
publication in this series.
3. Authors are permitted and encouraged to post their work online (e.g., in institutional repositories or on their website) prior to and
during the submission process, as it can lead to productive exchanges, as well as earlier and greater citation of published work (See
Open access policy for details).
References
[1]. Duarte, F. (2024). Video Streaming Services Stats (2024). Retrieved from https://explodingtopics.com/blog/video-streaming-stats
[2]. Sneha Pandey, I. M. (2023). Netflix’s Market Share Decline Continues In 2023: Analysis Of Leading Streaming Platforms. Retrieved from https://www.similarweb.com/blog/insights/media-entertainment-news/streaming-q1-2023/
[3]. Netflix. (2024). 2023 Netflix Annual Report. Retrieved from https://ir.netflix.net/financials/annual-reports-and-proxies/default.aspx
[4]. Netflix. (2023). Update on Sharing. Retrieved from https://about.netflix.com/en/news/update-on-sharing-may-us
[5]. Wang, Y. T., & Destech Publicat, I. (2016). Financial Analysis Based on Financial Reports and Suggestions. Paper presented at the International Conference on Management, Economics and Social Development (ICMESD), Wuhan, China.
[6]. Choudhary, M. A., & Limodio, N. (2021). Liquidity Risk and Long-Term Finance: Evidence from a Natural Experiment. The Review of Economic Studies, 89(3), 1278-1313.
[7]. Chen, R. (2023). Overview and analysis of the current development of the traditional media industry in the United States. Journal of Chinese Radio & Television, (11), 77-80.
[8]. Yu, Y. (2019). Valuation analysis of the streaming media industry based on Netflix company, Huazhong University of Science and Technology.
[9]. Zhang, C. (2023). Analysis of competitive advantage of streaming media platforms based on VRIO perspective, Donghua University.
[10]. Wayne, M. L. (2022). Netflix audience data, streaming industry discourse, and the emerging realities of ‘popular’ television. Media, Culture & Society, 44(2), 193-209.
[11]. Kübler, R., Seifert, R. & Kandziora, M. (2021). Content valuation strategies for digital subscription platforms. J Cult Econ 45, 295–326.
[12]. Wayne, M. L., & Uribe Sandoval, A. C. (2023). Netflix original series, global audiences and discourses of streaming success. Critical Studies in Television, 18(1), 81-100.
[13]. Liu, Y. (2023). A study on the global localization path of Netflix and South Korean co-produced dramas, Northeast Normal University.
[14]. Lotz, A. D. (2021). In between the global and the local: Mapping the geographies of Netflix as a multinational service. International Journal of Cultural Studies, 24(2), 195-215.
[15]. Sperling, N. (2023). Netflix Starts to Crack Down on Password Sharing. International New York Times. Retrieved from link.gale.com/apps/doc/A751163939/AONE?u=anon~2d3ee9a&sid=googleScholar&xid=7b90c22f.