


1. Introduction
The target audience of this paper is retailer chains in bikes and relating accessories.
The dataset is derived from Kaggle.com [1]. The name of dataset is “Bike sales in Europe”. The author was SADIQ SHAH, and the upload date was 2020. The dataset has 18 columns, including date, day, month, year, customer age, age group, customer gender, country, state, product category, subcategory, product, order quantity, unit cost, unit price, profit, cost, and revenue. The data ranges from 2011 to 2016. With a total of 113k customers’ information.
Bike riding has become a popular sport, both for leisure audiences and athletics. It features a healthy lifestyle, as riding can boost cardiovascular health. It is a form of aerobic exercise [2]. Also, riding is a way to improve environment [3]. With choosing riding whether for going to work or for a rest, it would not generate carbon dioxide. Goodman et al.’s [4] study found that more cycling infrastructures are helpful to promote physical activity. In recent years, with the development of modern industry, better technology has been applied on bikes, and make bikes cheaper and more comfortable to use [5]. These reasons can attract more customers to begin cycling. In brief, it contributes to a good chance to gain more profit for retailer chains in bikes and relating accessories. Moreover, Sælensminde’s study supported this opinion as the benefits of investments in cycle networks were estimated to be at least 4 to 5 times the costs [6]. Also, it is worthy to mention that men are more likely to enjoy cycling, meaning that more men can be involved in buying commodities relating to bikes [7].
Before the visualization starts, two things need to be mentioned. One is the categorization of age groups. The other is the profit margin that I calculated based on the dataset. The author of this dataset categorized age groups by four: youth (age under 25 years old), young adults (age between 25 and 34 years old), adults (age between 35 and 64 years old), seniors (age above 64 years old). For profit margin, it is calculated that dividing profit by cost.
As this paper aims at finding some methods that help retailers to gain more profits, four questions were made: What products are bought relatively more often by customers? Which customer group has the most purchasing power? Which product has the most profit margins? Will gender be a factor when designing products? These will be discussed in the following part.
2. Data visualization and analysis
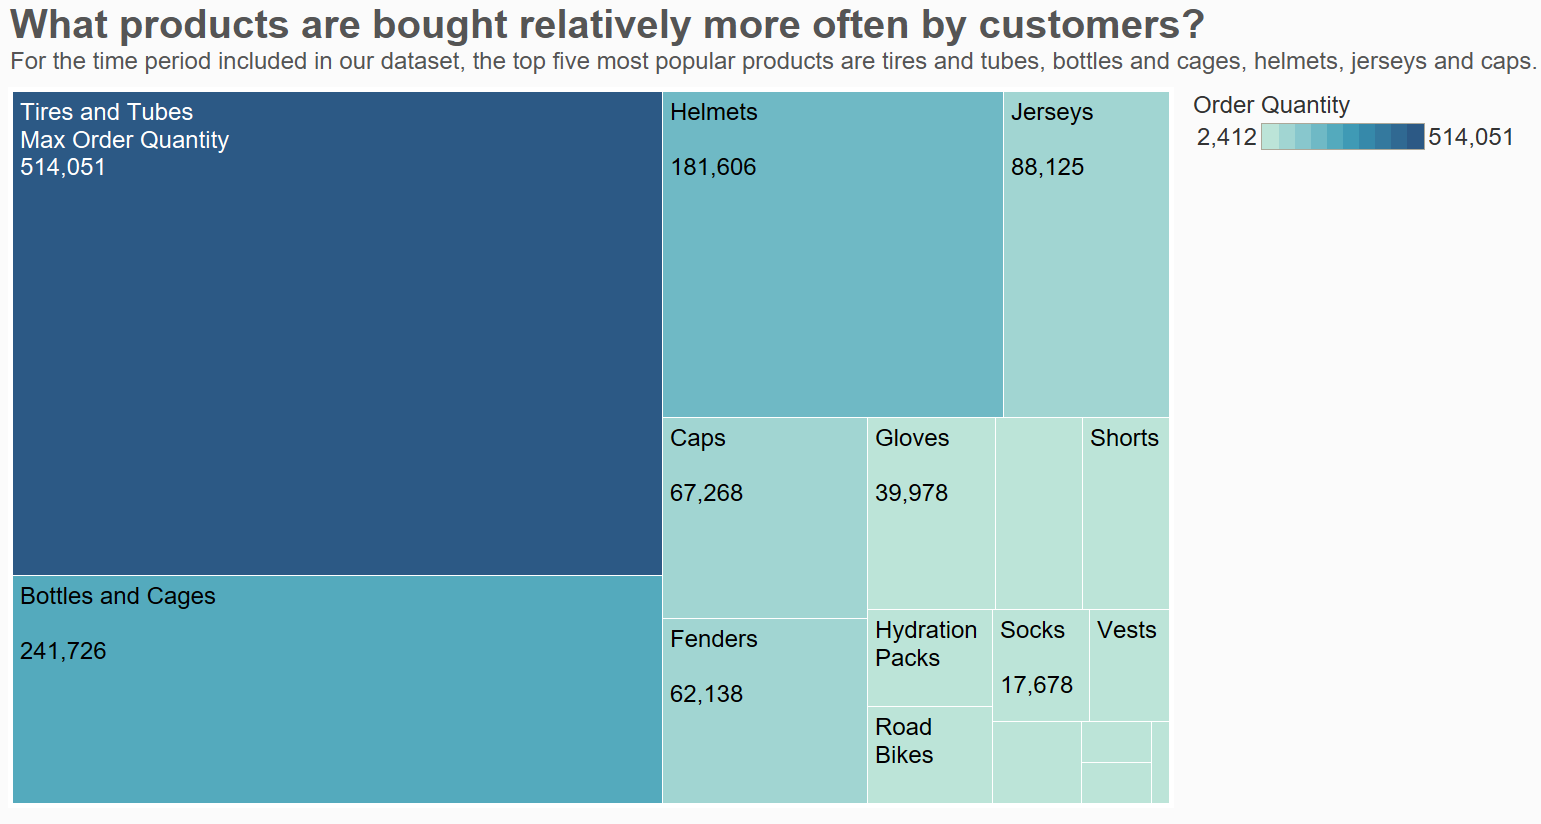
Figure 1: The Heatmap showing the purchasing numbers by customers.
The order quantities of each product by customers were examined across all the timelines including in the dataset. The results are shown in figure 1, and a heatmap was used to display the relationship between order quantities and products. The darker the colour and the larger the space is, meaning that that products were bought more by customers. From this figure, the top five best sellers are concluded: tires and tubes, bottles and cages, helmets, jerseys, and caps. To generalise the common features of these best sellers, they are essential to a rider, and to highlight, tires and tubes are consumables compared to other four commodities. This means that tires and tubes need to be replaced periodically, and this can be the reason that it is preferred by riders most.
A
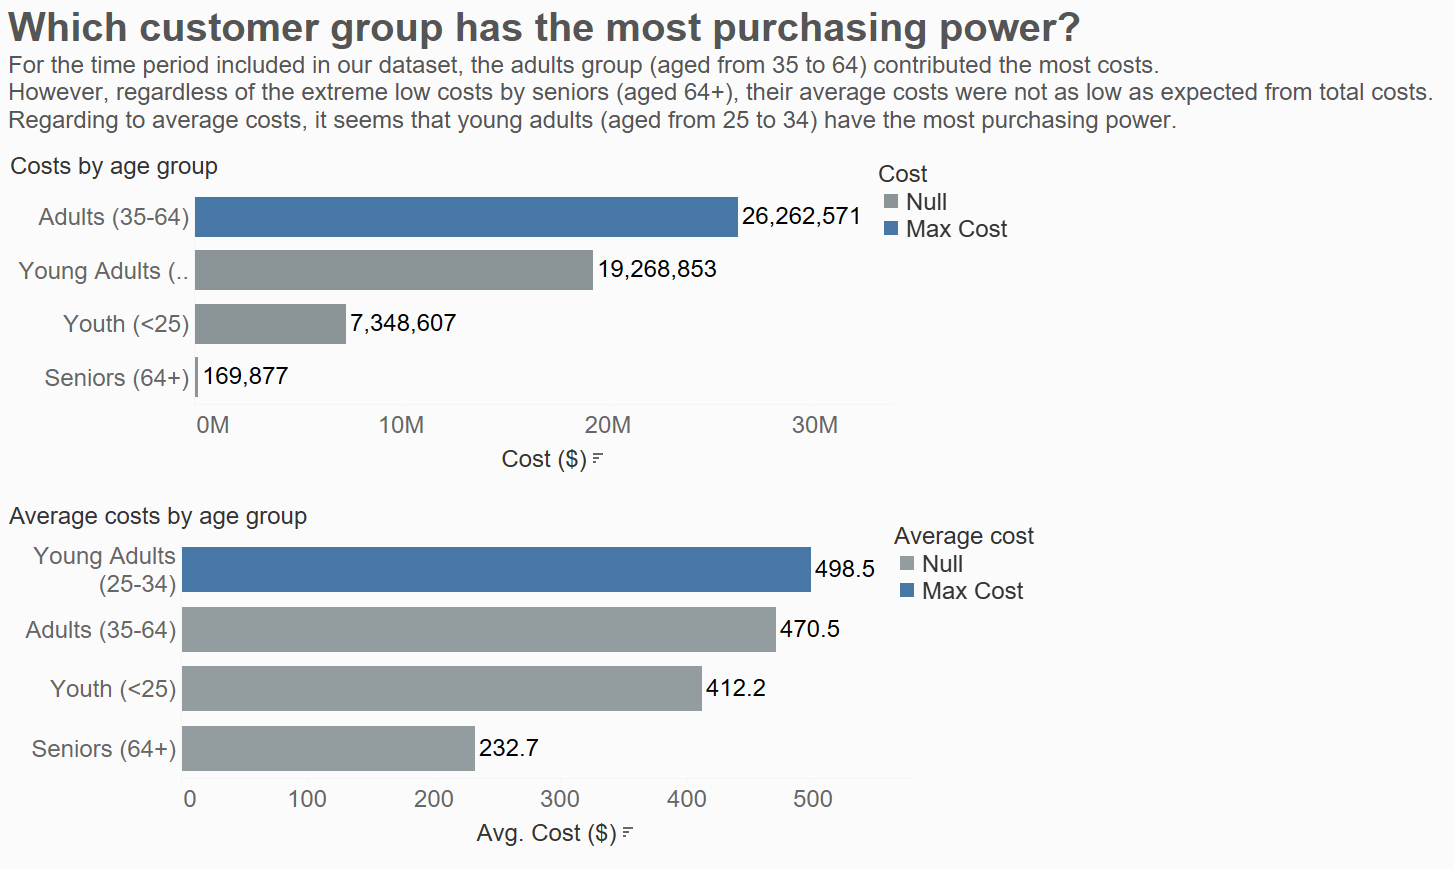
Figure 2: Tow bar figires showing costs and average costs by age groups
The horizontal bar figure listed the costs by age group to compare the purchasing power of different age groups. From the figure in the upper part of figure 2, it is known that adults contributed the most in bike and relating accessories sales. However, considering that the number of each age group customers may differ, the average costs by age group was compared in the lower figure. In this figure, young adults were more likely to spend more than adults in average. Also, senior customers spent not as little as the total cost showed. The number of customers from each age group did influence the total cost of them. Young adults are the age group has the most average payment costs, but the large number of adult customers contributed to the most costs.
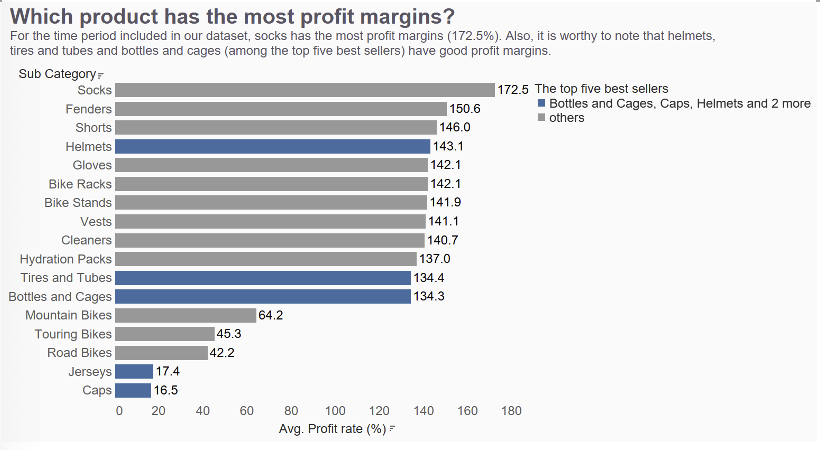
Figure 3: The bar figure showing the profit margins by subcategories
The third step, checking which products have higher profit margins would be useful to integrate with order quantities. The figure results are shown in figure 3, and the year range is all the timeline in dataset. The top five best sellers that were generalized in figure 1 are highlighted here in this figure. It can be concluded that helmets, tires and tubes, bottles and cages feature with both high popularity and profit margins. As high profit margins with high demands can make the most profits, the final products that are most worthy to work on have been recognized.

Figure 4: The pie chart showing the percentage of customer gender in buying bike relating commodities.
Finally, the distribution of customers involved in buying bike relating commodities are shown in figure 4. The results are found similar to the phenomenon that was mentioned in the introduction. Male customers were more likely to pay more on accessories and clothing than female customers, while their costs in bikes were almost the same. These data support what Heesch et al. [7] found. It can be argued that designing products that men would like can be more profitable.
3. Conclusion
From the whole four figures, among the top five best sellers, helmets, tires and tubes, bottles and cages have relatively high profit margins. Combining the information generalized from figure 2, among the whole age groups, young adults tend to spend most on bike relating products. Adults, feature in large number of customers, and resulting in the most costs in bike relating products. Also, male customers have more purchasing power than female customers. The conclusion would be making helmets, tires and tubes, bottles and cages that attract young adults and adults can be a feasible way to make more profits. In addition, combining more elements that men would like in accessories and clothing can be a sensible choice.
There leave some problems to think about. One is that the dataset only has bike sale information (without accessory ones) in 2011 and 2012. This means that it can affect the total calculation of figure display. Also, in 2014 and 2016, only 7 months’ data were collected, this makes it impossible to check data across years by month. Another one is the definition of age groups. Over time, those who were in the prior age groups, can get older to a superior age group. This can be misleading when showing them in a multi-year figure. For the gender difference in consuming, it is also worth noting that women may not spend as much as men do, doing some design and products especially for female customers also has potential.
References
[1]. SADIQ, S. (2020). Bike Sales in Europe. Url: https://www.kaggle.com/datasets/sadiqshah/bike-sales-in-europe/data
[2]. Nicole, M. (2022). Health Benefits of Cycling: 6 Reasons Cycling Is Good For You. Url: https://www.verywellfit.com/health-benefits-of-cycling-6386302
[3]. Pucher, J., & Buehler, R. (2017). Cycling towards a more sustainable transport future. Transport reviews, 37(6), 689-694.
[4]. Goodman, A., Sahlqvist, S., Ogilvie, D., & iConnect Consortium. (2014). New walking and cycling routes and increased physical activity: one-and 2-year findings from the UK iConnect study. American journal of public health, 104(9), e38-e46.
[5]. Lépine, J., Champoux, Y., & Drouet, J. M. (2015). The relative contribution of road bicycle components on vibration induced to the cyclist. Sports Engineering, 18, 79-91.
[6]. Sælensminde, K. (2004). Cost–benefit analyses of walking and cycling track networks taking into account insecurity, health effects and external costs of motorized traffic. Transportation Research Part A: Policy and Practice, 38(8), 593-606.
[7]. Heesch, K. C., Sahlqvist, S., & Garrard, J. (2012). Gender differences in recreational and transport cycling: a cross-sectional mixed-methods comparison of cycling patterns, motivators, and constraints. International Journal of Behavioral Nutrition and Physical Activity, 9(1), 1-12.
Cite this article
Zhang,Y. (2024). Data Visualization of Bike Store Sales in Europe. Advances in Economics, Management and Political Sciences,112,57-61.
Data availability
The datasets used and/or analyzed during the current study will be available from the authors upon reasonable request.
Disclaimer/Publisher's Note
The statements, opinions and data contained in all publications are solely those of the individual author(s) and contributor(s) and not of EWA Publishing and/or the editor(s). EWA Publishing and/or the editor(s) disclaim responsibility for any injury to people or property resulting from any ideas, methods, instructions or products referred to in the content.
About volume
Volume title: Proceedings of the 8th International Conference on Economic Management and Green Development
© 2024 by the author(s). Licensee EWA Publishing, Oxford, UK. This article is an open access article distributed under the terms and
conditions of the Creative Commons Attribution (CC BY) license. Authors who
publish this series agree to the following terms:
1. Authors retain copyright and grant the series right of first publication with the work simultaneously licensed under a Creative Commons
Attribution License that allows others to share the work with an acknowledgment of the work's authorship and initial publication in this
series.
2. Authors are able to enter into separate, additional contractual arrangements for the non-exclusive distribution of the series's published
version of the work (e.g., post it to an institutional repository or publish it in a book), with an acknowledgment of its initial
publication in this series.
3. Authors are permitted and encouraged to post their work online (e.g., in institutional repositories or on their website) prior to and
during the submission process, as it can lead to productive exchanges, as well as earlier and greater citation of published work (See
Open access policy for details).
References
[1]. SADIQ, S. (2020). Bike Sales in Europe. Url: https://www.kaggle.com/datasets/sadiqshah/bike-sales-in-europe/data
[2]. Nicole, M. (2022). Health Benefits of Cycling: 6 Reasons Cycling Is Good For You. Url: https://www.verywellfit.com/health-benefits-of-cycling-6386302
[3]. Pucher, J., & Buehler, R. (2017). Cycling towards a more sustainable transport future. Transport reviews, 37(6), 689-694.
[4]. Goodman, A., Sahlqvist, S., Ogilvie, D., & iConnect Consortium. (2014). New walking and cycling routes and increased physical activity: one-and 2-year findings from the UK iConnect study. American journal of public health, 104(9), e38-e46.
[5]. Lépine, J., Champoux, Y., & Drouet, J. M. (2015). The relative contribution of road bicycle components on vibration induced to the cyclist. Sports Engineering, 18, 79-91.
[6]. Sælensminde, K. (2004). Cost–benefit analyses of walking and cycling track networks taking into account insecurity, health effects and external costs of motorized traffic. Transportation Research Part A: Policy and Practice, 38(8), 593-606.
[7]. Heesch, K. C., Sahlqvist, S., & Garrard, J. (2012). Gender differences in recreational and transport cycling: a cross-sectional mixed-methods comparison of cycling patterns, motivators, and constraints. International Journal of Behavioral Nutrition and Physical Activity, 9(1), 1-12.