


1. Introduction
In the financial sector, interest rate is a very important indicator that affects the operation of the entire economy. The London Interbank Offered Rate (LIBOR) used to be one of the most important benchmark rates in the world. Investors and banks used to tie their credit arrangements to the LIBOR as the standard interest rate. The LIBOR, which is made up of five currencies and seven maturities, was calculated by taking the average interest rate that big international banks borrow from one another. The U.S. dollar (USD), Swiss franc (CHF), British pound (GBP), Japanese yen (JPY), and euro (EUR) were the five currencies. The three-month US dollar rate, sometimes known as the current LIBOR rate at the time, was the LIBOR that was most frequently quoted[1]. However due to suspected manipulation and market opacity, it has gradually been replaced by proposed new benchmark rates, the most important of which is the US dollar Secured Overnight Financing Rate (SOFR). One of the most challenging modifications to the financial market infrastructure ever needed was the switch from LIBOR. Since LIBOR is widely used in all market segments, its disruption or discontinuation would pose serious dangers to both individual enterprises and the broader stability of the financial system, making the transition especially difficult[2].
The SOFR, which is based on the actual interest rates traded overnight in the U.S. Treasury market, is considered to be more accurate and transparent, contributing to greater stability and fairness in the market. There is currently a gradual shift to the use of SOFR globally, but there are a number of challenges and issues in the process that require further research and study. One study shows that in order to facilitate the shift from LIBOR to SOFR, the Alternative Reference Rates Committee (ARRC) has approved the term SOFR. The CME Group has been chosen to administer forward-looking SOFR rates. Using CME data and the term SOFR developed by Heitfield and Park (2019), we analyze the period from June 2018 to December 2021 and find that term SOFR contributes more to price discovery than LIBOR. Using solely CME data, our results hold up well across several price discovery measures and subperiods.[3]
The purpose of this paper is to explore whether SOFR is a good replacement for LIBOR and to analyze the impact of this shift on financial markets. This study is of great significance to both the financial market and the real economy. First, for the financial market, studying the transformation of SOFR and LIBOR will help to better understand the operation mechanism and risk management method of the market and promote its stability and development. Secondly, for enterprises and individuals, understanding this shift will help them to better formulate capital operation strategies and reduce interest rate risks. Therefore, this study has important theoretical and practical significance.
2. Ways to Compare SOFR and Libor
We have been informed that SOFR has been selected by the International Swaps and Derivatives Association (ISDA) as a replacement for US dollar LIBOR, and will gradually replace LIBOR as the most important benchmark for interbank lending and borrowing in the US dollar market, as well as the benchmark for the majority of floating interest rates in international financial markets [4]. There is other research find that A significant paradigm shift for the markets has occurred with the move from the London Interbank Offered Rate (LIBOR), which was a reference rate based on interbank offered rates, to the Secured Overnight Financing Rate (SOFR), which is a more comprehensive indicator of the cost of borrowing cash overnight secured by Treasury securities. This article analyzes the price adjustment process in LIBOR and SOFR, which is how market players use available information to estimate equilibrium rates, in order to look at microstructure concerns in the US short-term benchmark rates.[5]
We begin by using Libor to calculate the exchange rate of the US dollar as well as the euro. Libor data from 2010 is used here because, in recent years, the credibility of Libor has declined due to negative news about Libor, and there is less data about the trade.
Here, we must utilize a financial economics principle known as covered interest rate parity. This idea elucidates the correlation between interest rates of two countries' currencies. According to the idea, in a scenario without any risk, the disparity in interest rates between two countries should correspond to the disparity in anticipated changes in exchange rates if their currency exchange rates are in balance.
Specifically, suppose that there are two countries, country A and country B, whose currencies are currency A and currency B, and whose interest rates are rA and rB, respectively. Also, suppose that the current exchange rate is S, and the expected future exchange rate is S'. Then, according to the covered interest rate parity theory, the following equation should hold:
(1 + rA) = (1 + rB) × (S'/S) (1)
This equation suggests that if the difference in interest rates between the two countries matches the difference in expected exchange rate changes, then investors would not be able to arbitrage through the foreign exchange market because the arbitrage opportunity would be canceled out.
We first use the forward exchange rate and spot rate to calculate the risk-free rate:
\( \frac{{x_{1y}}}{{x_{0}}}-1=D\ \ \ (2) \)
where X1y is the forward exchange rate and X0 is the spot exchange rate.
We calculated the risk-free rate using the Libor formula:
\( \frac{1+{L_{f}}}{1+{L_{d}}}-1={R_{L}}\ \ \ (3) \)
The calculation gives us a number and we subtract the two to get the absolute value of the error between the calculation using Libor data and the real situation. After subtracting the absolute value the result. The data for the following many days were used for the calculation and the average result.
After the calculation, we are ready to use the SOFR data instead of the dollar Libor for the calculation and the equivalent of SOFR to the dollar data SONIA instead of the British pound Libor data for the calculation. This paper calculated using data from the beginning of the SOFR emergence, i.e., from March 2, 2020 through February 28, 2024. Using the Libor formula:
\( \frac{1+{S_{f}}}{1+{S_{d}}}-1={S_{L}}\ \ \ (4) \)
We subtracted the results calculated with the SOFR and SOINA data from the true results to get the absolute value of the error between the results calculated using the SOFA data and the actual situation.
3. Hypothesis's Testing
After obtaining the above data, we processed the data and here the statistical method of hypothesis testing was used. Hypothesis testing is an inferential method in statistics used to determine whether the observed sample data are consistent with a hypothesis for an aggregate or a characteristic of an aggregate. Typically, hypothesis testing involves the following steps:
3.1. Introduction
A statistical technique called the one-tailed t-test is employed to ascertain whether the means of two sets of data differ significantly from one another. It is extensively employed in scientific investigations, especially in disciplines like biology, psychology, and economics. One kind of hypothesis test used by researchers to see if there is sufficient data to reject the null hypothesis in favor of the alternative is the one-tailed t-test.
Principle of One-Tailed t-test:
The principle behind the one-tailed t-test lies in comparing the means of two groups of data and determining if the observed difference is statistically significant. The hypothesis testing process involves the following steps:
3.2. Establishing Hypotheses
Null Hypothesis (H0): The means of the two groups are equal.
Alternative Hypothesis (Ha): The mean of one group is significantly greater or smaller than the mean of the other group.
Calculating the t-statistic:
The t-statistic is calculated as the difference between the means of the two groups divided by the standard error of the difference.
\( t=\frac{{\overline{X}_{1}}-{\overline{X}_{2}}}{\sqrt[]{\frac{s_{1}^{2}}{{n_{1}}}+\frac{s_{2}^{2}}{{n_{2}}}}} \)
This formula calculates the t-statistic for two independent samples. Here, \( {\overline{X}_{1}} \) and \( {\overline{X}_{2}} \) are the means of the two samples, \( s_{1}^{2} \) and \( s_{2}^{2} \) are the variances of the two sets of samples, \( {n_{1}} \) and \( {n_{2}} \) are the sample sizes of the two groups of samples, respectively.
3.3. Determining the p-value
The p-value represents the likelihood of receiving a test statistic that is as extreme as the one observed, on the assumption that the null hypothesis is correct. When the p-value is lower than the significance level, often set at 0.05, the null hypothesis is discarded, and the alternative hypothesis is embraced.
3.4. Application of One-Tailed t-test
The one-tailed t-test is commonly used in various research scenarios, including:
Testing the effectiveness of a new drug by comparing the recovery times of two groups of patients.
Evaluating the impact of a teaching method by comparing the test scores of students in two classes.
Assessing the difference in customer satisfaction between two product versions based on survey ratings.
In this article, we are going to explore whether SOFR is more efficient than Libor. Let u1 be the difference between Libor and the actual result, and let u2 be the difference between SOFR and the actual result. We set the null hypothesis (H0) as u1 <= u2 and the alternative hypothesis (Ha) as u1 > u2.
The one-tailed t-test is a suitable statistical method for this analysis, as it allows us to determine if there is a significant difference in efficiency between SOFR and Libor.
When performing the one-tailed t-test, the t-distribution table is usually checked according to the chosen significance level (usually 0.05 or 0.01) to find the corresponding critical value. If the calculated t-statistic is greater than the critical value, the null hypothesis is rejected, indicating that there is a significant difference in efficiency between SOFR and Libor.
This paper used data from Libor from 2010 to 2020 to calculate the difference between it and the true risk-free rate, using this data to draw a graph to arrive at as shown in figure 1 and figure 2.
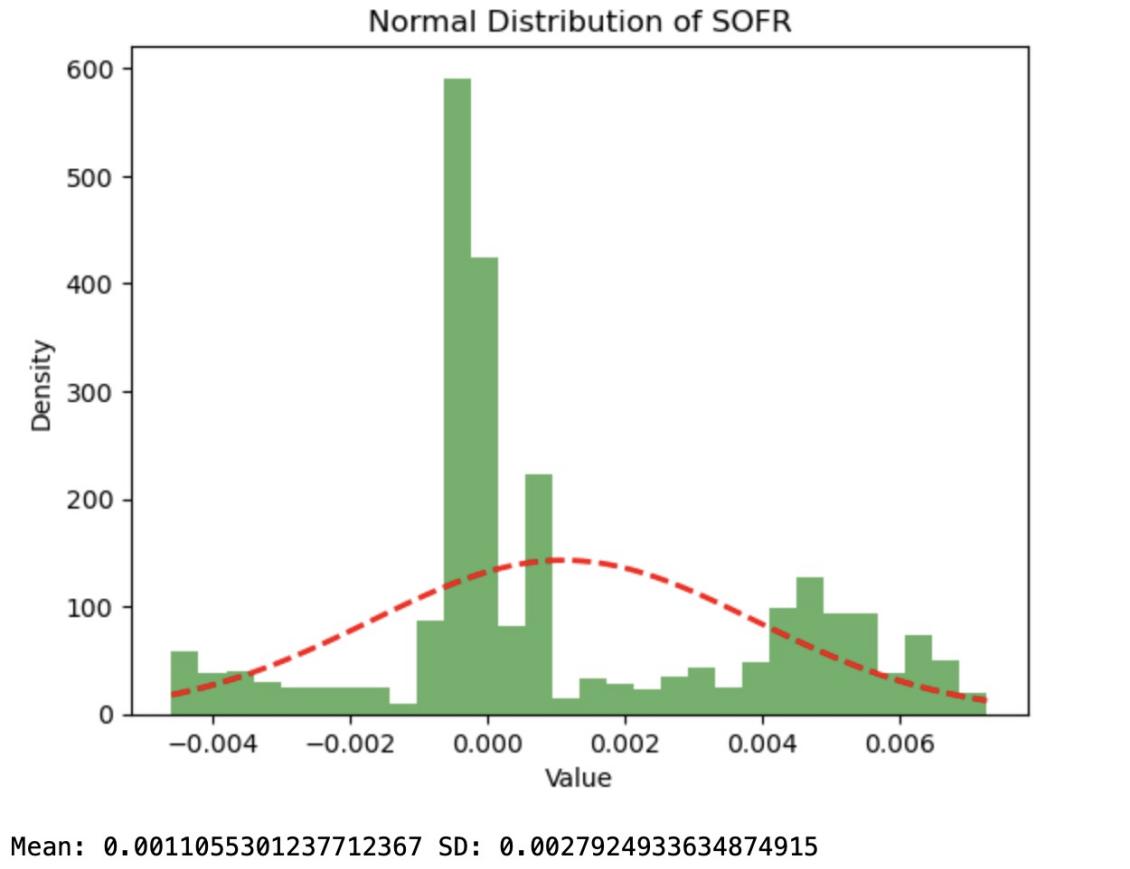
Figure 1: Normal Distribution of SOFR
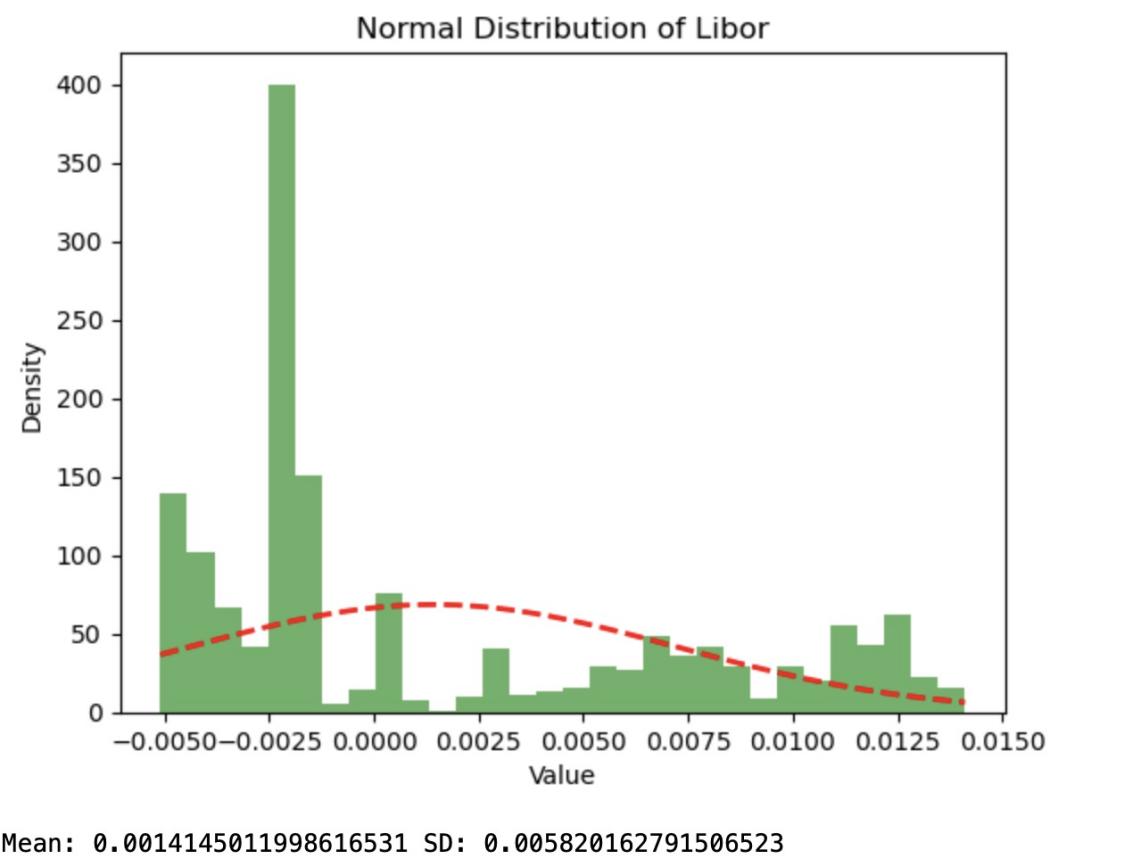
Figure 2: Normal Distribution of Libor
The horizontal coordinate of this graph is the difference between the calculated value of Libor and the true value, the vertical coordinate is the frequency of occurrence, and the dashed portion of the graph is the normal distribution function fitted accordingly.
This paper used the data from the SOFR from 2020 to 2024 to calculate the difference between it and the true risk-free rate, using this data to draw the graph to arrive at.
The horizontal coordinate of this graph is the difference between the calculated value of Libor and the true value, the vertical coordinate is the frequency of occurrence, and the dashed part is the normal distribution function fitted accordingly.
By comparing the two graphs, it is relatively obvious that the smaller the error between the calculated value and the true value using SOFR, i.e., there are more data appearing near error 0. And the standard deviation is also smaller, indicating that the data is more concentrated around the mean and performs better.
Now This paper analyze these data quantitatively. Using the t-test mentioned above, we calculated the t-statistic: 21.68622, P-value: 2.70958e-98, at a significance level of 0.01, the mean absolute value of the error in the calculation of SOFR is smaller than the mean absolute value of the error in the calculation of Libor. Figure 3 is a visualization:
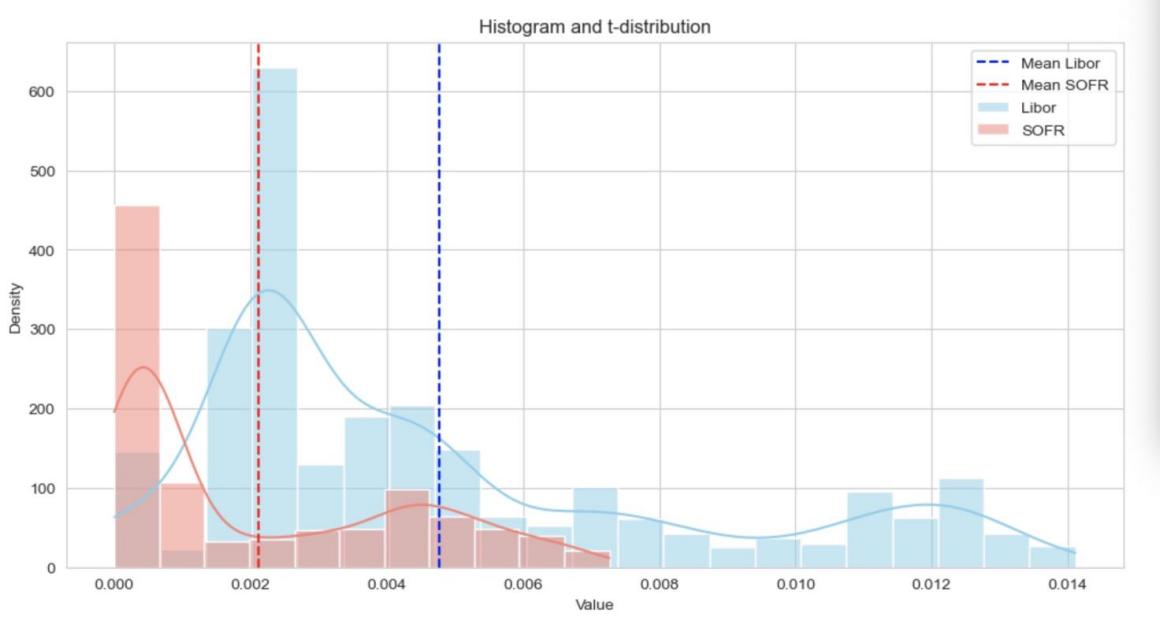
Figure 3: Histogram and t-distribution
We are pretty sure that the sample mean is significantly different from the overall mean. Therefore, we reject the H0 hypothesis and accept the H1 hypothesis. Therefore, we can assume that the results in calculating the risk-free rate using SOFR data are more accurate than Libor calculations and better reflect the real market data.
4. Conclusion
In conclusion, this paper has explored the transition from LIBOR to SOFR and analyzed the impact of this shift on financial markets. The findings suggest that SOFR is a more accurate and transparent benchmark rate compared to LIBOR, contributing to greater stability and fairness in the market. The statistical analysis conducted in this study supports the hypothesis that SOFR calculations are more accurate in determining the risk-free rate compared to LIBOR.
However, there are several limitations in this study that should be addressed in future research. First, the analysis focused primarily on the US dollar market, and the findings may not be applicable to other currencies or regions. Future studies could examine the transition to alternative benchmark rates in other currencies and assess their impact on global financial markets.
Second, the study used historical data to compare the accuracy of SOFR and LIBOR calculations. Future research could incorporate real-time data to provide more up-to-date insights into the effectiveness of SOFR as a replacement for LIBOR.
Additionally, the study did not consider the impact of the transition on specific financial products or market participants. Future research could explore how the shift from LIBOR to SOFR affects different types of financial products, such as loans, derivatives, and securities, and how market participants are adapting to the change.
In terms of future research directions, it would be valuable to continue monitoring the transition from LIBOR to SOFR and assess its long-term impact on financial markets. Researchers could also investigate the development of new benchmark rates and their implications for the financial industry.
Overall, the transition from LIBOR to SOFR represents a significant change in the financial markets, and further research is needed to fully understand its implications. By addressing the limitations of this study and focusing on these future research directions, scholars can contribute to a better understanding of the transition and its impact on the global financial system.
References
[1]. Alternative Reference Rates Committee. (n.d.). https://www.newyorkfed.org/arrc/sofr-transition.
[2]. Kurt, D. (2023, September 30). Secured Overnight Financing Rate (SOFR) definition and history. Investopedia. https://www.investopedia.com/secured-overnight-financing-rate-sofr-4683954
[3]. Indriawan, I., Jiao, F., & Tse, Y. (2022). Price discovery between forward-looking SOFR and LIBOR. Finance Research Letters, 44, 102797. https://doi.org/10.1016/j.frl.2022.102797
[4]. Heidorn, T., & Meier, R. (2024). US Dollar swaps after LIBOR (No. 235). Frankfurt School-Working Paper Series.
[5]. Fassas, A.P. (2021). Price discovery in US money market benchmarks: LIBOR vs. SOFR. Economics Letters, 205, 109882. https://doi.org/10.1016/j.econlet.2021.109882
Cite this article
Zhang,H. (2024). Whether SORF Is a More Effective Substitute for LIBOR in the Market?. Advances in Economics, Management and Political Sciences,121,51-56.
Data availability
The datasets used and/or analyzed during the current study will be available from the authors upon reasonable request.
Disclaimer/Publisher's Note
The statements, opinions and data contained in all publications are solely those of the individual author(s) and contributor(s) and not of EWA Publishing and/or the editor(s). EWA Publishing and/or the editor(s) disclaim responsibility for any injury to people or property resulting from any ideas, methods, instructions or products referred to in the content.
About volume
Volume title: Proceedings of the 8th International Conference on Economic Management and Green Development
© 2024 by the author(s). Licensee EWA Publishing, Oxford, UK. This article is an open access article distributed under the terms and
conditions of the Creative Commons Attribution (CC BY) license. Authors who
publish this series agree to the following terms:
1. Authors retain copyright and grant the series right of first publication with the work simultaneously licensed under a Creative Commons
Attribution License that allows others to share the work with an acknowledgment of the work's authorship and initial publication in this
series.
2. Authors are able to enter into separate, additional contractual arrangements for the non-exclusive distribution of the series's published
version of the work (e.g., post it to an institutional repository or publish it in a book), with an acknowledgment of its initial
publication in this series.
3. Authors are permitted and encouraged to post their work online (e.g., in institutional repositories or on their website) prior to and
during the submission process, as it can lead to productive exchanges, as well as earlier and greater citation of published work (See
Open access policy for details).
References
[1]. Alternative Reference Rates Committee. (n.d.). https://www.newyorkfed.org/arrc/sofr-transition.
[2]. Kurt, D. (2023, September 30). Secured Overnight Financing Rate (SOFR) definition and history. Investopedia. https://www.investopedia.com/secured-overnight-financing-rate-sofr-4683954
[3]. Indriawan, I., Jiao, F., & Tse, Y. (2022). Price discovery between forward-looking SOFR and LIBOR. Finance Research Letters, 44, 102797. https://doi.org/10.1016/j.frl.2022.102797
[4]. Heidorn, T., & Meier, R. (2024). US Dollar swaps after LIBOR (No. 235). Frankfurt School-Working Paper Series.
[5]. Fassas, A.P. (2021). Price discovery in US money market benchmarks: LIBOR vs. SOFR. Economics Letters, 205, 109882. https://doi.org/10.1016/j.econlet.2021.109882