


1. Introduction
The COVID-19 pandemic first occurred in China and then spread out globally. The number of COVID-19 cases drastically increased in the US since March 2020. Across the globe, economic activities were soon shut down due to the government policy on the COVID-19 pandemic, such as quarantine protocols, travel restrictions, and border control. The economy of many countries, including the US, declined dramatically, resulting in a severe economic recession. The stock market, for instance, experienced a sharp decline because of the paralyzed international supply chain. Soon, the Federal Reserve implemented an expansionary monetary policy to revive the economy [1]. Besides the expansionary monetary policy that the FOMC, the Federal Open Market committee, released in March 2020, also implemented a contractionary monetary policy to suppress inflation in 2022 and 2023, during the post-COVID period [2]. As a part of economic functionalities, central bank intervention plays an essential role in market systems. Thus, it is crucial to investigate how the stock market responds to the monetary policies in the COVID and post-COVID period. Apple Inc. is one of the most renowned technology companies worldwide. By looking at the stock price change and beta value change after the disclosure of monetary policies during COVID and the post-COVID period, the relationship between the monetary policy and Apple stock price and beta value can be investigated by analyzing the change of the price and beta monthly, quarterly, semi-yearly, and yearly in 6 months after the policy released. Monetary policies, including interest rate changes, can significantly influence market conditions. Analyzing the effects of monetary policies on Apple's stock price and beta value provides insights into market trends and dynamics.
2. Literature Review
Monetary policies consist of the adjustment of the interest rate. Expansionary monetary policy and contractionary monetary policy are the two mechanisms to stabilize the market. According to the empirical analysis, there is a negative relationship between interest rate and stock price. Gunardi et al. concluded that the interest rate negatively influences stock prices in Indonesia and Malaysia during COVID-19, which means that the lower the interest rates are, the higher the stock prices are. The negative relationship between beta and interest rates can be explained through the concept of stock return [3]. Based on the study conducted by Asgari et al., the Tehran Stock Exchange data shows that beta has a significant positive relationship with stock return [4]. Moreover, Based on the investigation of manufacturing companies listed on the Indonesia Stock Exchange from 2017 to 2020, the researchers concluded that the beta value has a significant relationship with stock returns [5]. Additionally, Assefa et al. claimed a negative relationship between stock returns and interest rates [6]. Thus, combining these studies, the interest rate has a negative relationship with the beta value.
However, these two relationships vary across countries and industries. For example, in the transportation sub-sector in Indonesia, Amanda et al. found that the effect of interest rates on stock prices contradicts the theoretical relationship [7]. Moreover, Bing suggested that the relationship between beta and return can be either negative or positive, which is determined by the positivity of the excess market return [8]. Fletcher, Jonathan concluded from the study of international stock returns: the beta-return relationship varies depending on the stock performance in months [9]. Furthermore, Elsas et al. suggested that conditionally there is a positive and statistically significant relationship between beta and realized returns according to the German stock market [10]. Therefore, the relationship between beta and interest rates can vary depending on different circumstances.
3. Methodology
3.1. Hypothesis
Monetary policies are classified into expansionary monetary policy (decreasing interest rate) and contractionary monetary policy (increasing interest rate).
There is a significant negative relationship between Apple stock price and interest rate.
There is a significant negative relationship between the beta of Apple’s stock and interest rate.
3.2. Variables
1) Dependent variables: Apple beta and stock price.
2) Independent variable: monetary policies/interest rate.
3.3. Statistical Techniques
Data used in the study include historical Apple Inc. stock price, stock return, and S&P 500 return, which are collected from Yahoo Finance; The monetary policies (adjustment of interest rates) released dates are collected from Forbes. Calculations of stock return and beta are used within the framework of the CAPM model[11]:
\( E({r_{i}}) = {r_{f}} + β[E({r_{m}}) - {r_{f}}] \) (1)
\( {β_{i}} = \frac{COV ({r_{m}}, {r_{i}})}{Var ({r_{m}})} \) (2)
Beta is the measure of the relationship between the return of an investment and the market’s return. The beta value indicates the systematic risk of a stock. If the beta is negative, the stock return has a negative relationship with the market Return; If the beta is positive, then a positive relationship is shown [12].
4. Result and Data Analysis
4.1. Expansionary Monetary Policy and Apple Inc. Stock Price in COVID
After the release of the expansionary monetary policy, Apple Inc. stock price increases steadily from March 16th 2020 to August 16th 2020. Although the stock price decreased by 2.164% in September, the price continued increasing from October 16th 2020 to February 16th 2021. There is a drop of 5.721% in stock price within a month after February 16th 2021. Even though the decline of stock price exists in the percentage of change monthly and quarterly, based on the semi-yearly and yearly data, the Apple Inc. stock price increased 85.997% in the first half of the year, 12.353% in the second half of the year, and 108.974% over one year.
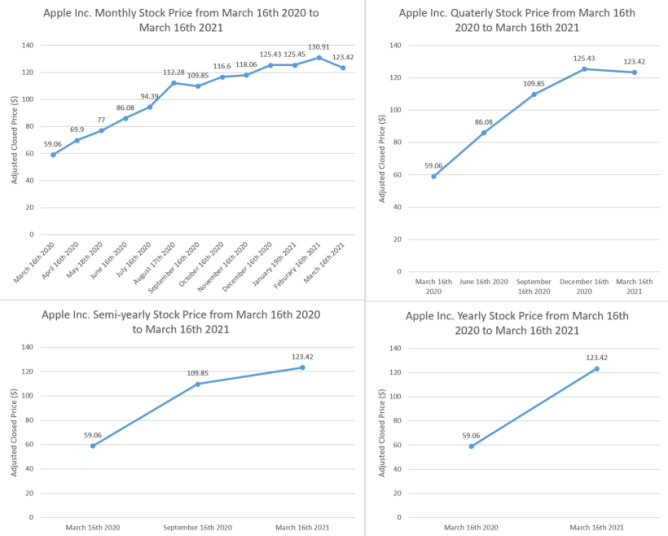
Figure 1: Apple Inc. Stock Price from March 16th 2020 to March 16th 2021 Monthly, Quarterly, Semi-yearly, and Yearly.
Combined with the graph, there are fluctuations in the monthly graph due to the two decreases in the stock price. Apple Inc. stock price increased in a big trend over the year, from $59.06 to $123.42 after a year. Moreover, the slope of the stock price in the graph decreases over the year, indicating that Apple Inc.’s stock price increases at a decreasing rate within a year.
4.2. Contractionary Monetary Policy and Apple Inc. Stock Price in Post-COVID
After the release of the contractionary monetary policy, Apple Inc. stock price increased 2.764% in the first month. Even though the stock price decreases monthly after April 18th 2022 at 9.455% and 11.849%, the stock price ascends again. There are a many fluctuations in the monthly table. The quarterly table also shows the same pattern, a decline follows an increase. According to the semi-yearly table, in the first half of the year the stock price decreases 3.551%, and increases 0.659% in the second half of the year, resulting in a decline of 1.595% over the year.
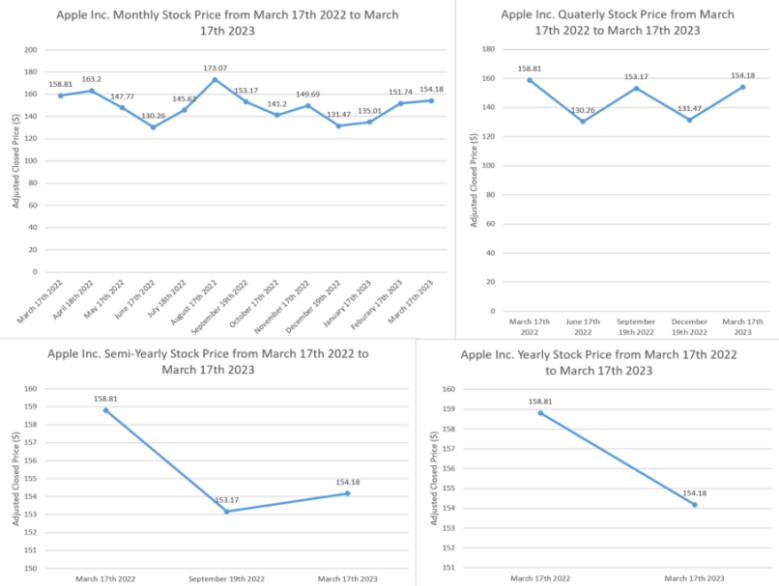
Figure 2: Apple Inc. Stock Price from March 17th 2022 to March 17th 2023 Monthly, Quarterly, Semi-yearly, and Yearly.
Combined with the graph, the stock price fluctuates frequently in the monthly and quarterly graph due to the unstable change of the stock price. According to the monthly and quarterly graph, Apple Inc. stock price fluctuates in a certain range from $130 to $175, and the stock prices on March 17th 2022 and on March 17th 2023 do not change significantly (remain in the range from $150 to $160), albeit the apparent decrease in the yearly graph.
4.3. Expansionary Monetary Policy and Apple Inc. Stock Beta in COVID
After the release of the expansionary monetary policy, Apple Inc. Beta value decreased in the first three month at 19.097%, 25.977%, and 0.265%, and overall declines 40.272% in the first quarter. After the first quarter, the beta value increases in the following two months and decreases at the end of the second quarter. However, the beta value hikes 169.181% in the second quarter. Canceling the decrease in the first quarter, there is an increase of 60.777% in the first half of the year. In the second half of the year, there is a decrease of 14.158% due to the volatile fluctuation monthly. Over the year, an increase of 38.013% is shown.
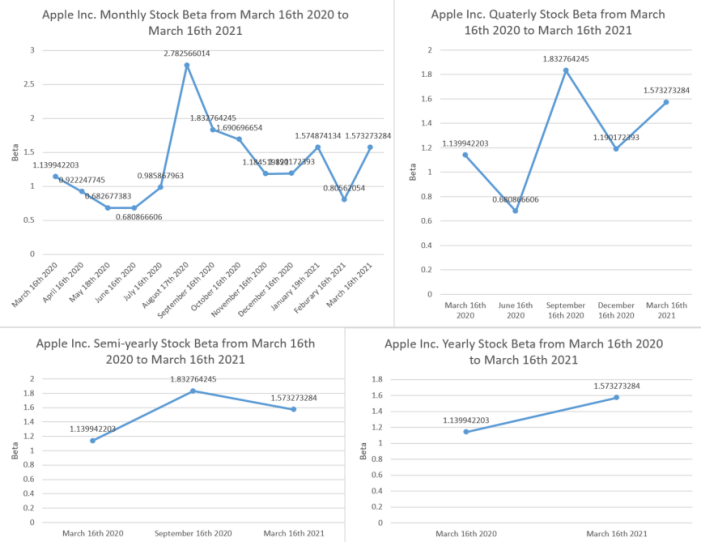
Figure 3: Apple Inc. Beta Value from March 16th 2020 to March 16th 2021 Monthly, Quarterly, Semi-yearly, and Yearly.
Combined with the graph, Apple Inc. beta value is relatively unstable. The beta value first decreases at a decreasing rate and increases at an increasing rate. After the beta value peaked on August 17th 2020, it declined drastically and increased slightly in the last months and quarter in 2023. Although the beta value maintains an upward trend in the yearly graph, the value fluctuates significantly within a year.
4.4. Contractionary Monetary Policy and Apple Inc. Stock Beta in Post-COVID
After the release of the contractionary monetary policy, Apple Inc. beta value fluctuates frequently. There is always a decline followed after an increase. For example, based on the monthly table, the beta value increases 58.486% from October 17th to November 17th 2022 and declines 12.032% monthly on December 19th 2022. This pattern also shows quarterly and semi-yearly. As a result, the beta value does not change significantly over the year. On March 17th 2022, the beta value is 1.112. It increased to 1.116 on March 17th 2023 after a year.
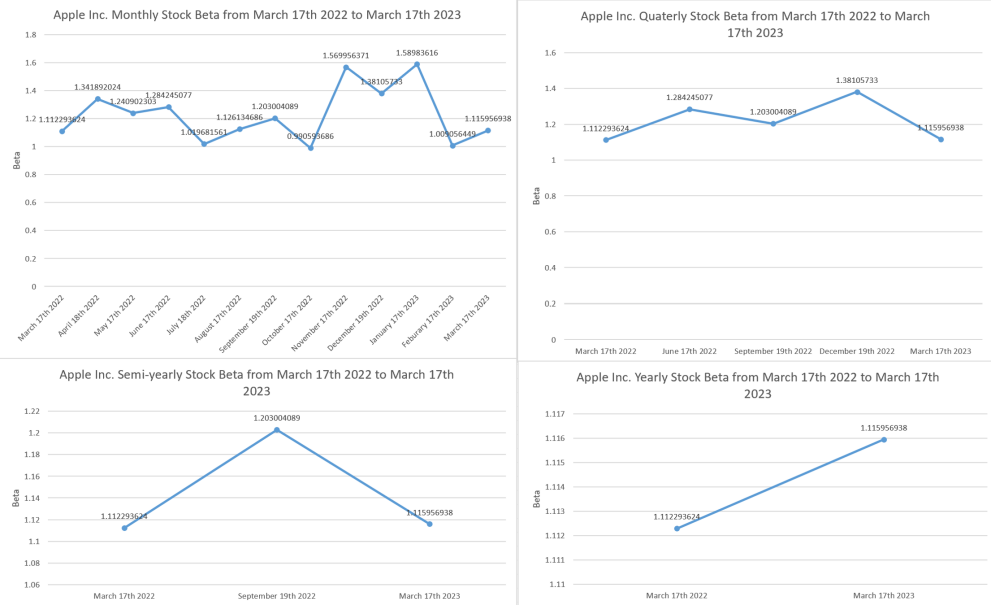
Figure 4: Apple Inc. Beta Value from March 17th 2022 to March 17th 2023 Monthly, Quarterly, Semi-yearly, and Yearly.
In the graph, the unstable fluctuations are shown distinctively. Although the rate of change is different in each month, quarter, and half of the year, a decline is followed after a increase, except for the increase of beta value from July 18th 2022 to September 19th 2022 when the beta value rises consecutively in two months. Within a year, the beta value shows an upward trend. However, the change is not significant.
5. Conclusion
When the expansionary monetary policy was released on March 16th, 2020, Apple Inc.'s stock price increased by around 108.974%. Even though there are distinct fluctuations, the overall trend is rising. Hence, the stock price increases as the interest rate decreases, which supports the hypothesis. In the post-COVID period, the Federal Reserve issued the contractionary monetary policy. Comparing the stock price on March 17th 2022, to the price on March 17th 2023, the price only decreased 1.595%, which is insignificant relative to the 108.974% increase during COVID-19. Therefore, although the relationship between stock price and interest rates is negative during COVID-19 and post-COVID, the significance level varies in two periods (in COVID, the relationship is significant, whereas during post-COVID, the relationship is insignificant). On the other hand, Apple Inc.’s beta value and interest rate showed a significantly negative relationship in 2020, when contractionary monetary policy was released. According to the graph, the fluctuations are volatile. Apple Inc.’s beta value increased by 38.013% in a year, from March 16th 2020 to March 16th 2021. However, the relationship between Apple Inc.’s stock beta and interest rate in the post-COVID period is insignificantly positive. As the interest rate decreased on March 17th, 2022, the beta value increased 0.329% within a year. The beta value roughly fluctuates in the same range based on the figure. Therefore, the hypothesis is partially rejected. The controversy may cause by other determinants, such as the broader market reactions and investor sentiment surrounding changes in sales can impact the stock’s volatility and therefore its beta. Researchers can use more precise calculations to estimate the beta value for future studies and investigate when investors react to the policies.
References
[1]. Assefa, Tibebe A., Omar A. Esqueda, and André Varella Mollick. "Stock returns and interest rates around the World: A panel data approach." Journal of Economics and Business 89 (2017): 20-35.
[2]. Bing, X. I. A. O. "Conditional relationship between beta and return in the US stock market." Expert Journal of Business and Management 4.1 (2016).
[3]. Fletcher, Jonathan. "On the conditional relationship between beta and return in international stock returns." International Review of Financial Analysis 9.3 (2000): 235-245.
[4]. Forbes. (2024) Federal Funds Rate History 1990 to 2023. https://www.forbes.com/advisor/investing/fed-funds-rate-history/.
[5]. Elsas, Ralf, Mahmoud El-Shaer, and Erik Theissen. "Beta and returns revisited: evidence from the German stock market." Journal of International Financial Markets, Institutions and Money 13.1 (2003): 1-18.
[6]. Gunardi, Nugraha, and Maya Sari Disman. "The Effect Of Money Supply And Interest Rate On Stock Price." Journal of Survey in Fisheries Sciences 10.4S (2023): 100-111.
[7]. Feldkircher, Martin, Florian Huber, and Michael Pfarrhofer. "Measuring the effectiveness of US monetary policy during the COVID‐19 recession." Scottish journal of political economy 68.3 (2021): 287-297.
[8]. Asgari Alouj, Hosein, Nahid Maleki Nia, and Seyed Masoud Sajjadian Amiri. "The Effect of Systematic Risk on Cost of Capital Determinants Applying CAPM Model: Evidence from Tehran Stock Exchange (TSE)." Australian Journal of Basic and Applied Sciences 6.10 (2012): 180-188.
[9]. Amanda, Siska Tri, Chairil Akhyar, and Rico Nur Ilham. "The Effect of Inflation, Exchange Exchange, Interest Rate On Stock Price In The Transportation Sub Sector, 2018-2020." Journal of Accounting Research, Utility Finance and Digital Assets 1.4 (2023): 342-352.
[10]. Nasution, Muhamad Syafril, et al. "The Effect of Beta, and Residual Income on Stock Return in The Manufacturing Industry in The Indonesia Stock Exchange." Enrichment: Journal of Management 11.2 (2021): 555-558.
[11]. Rossi, Matteo. "The capital asset pricing model: a critical literature review." Global Business and Economics Review18.5 (2016): 604-617.
[12]. Wijaya, Erric, and Alecia Ferrari. "Stocks investment decision making capital asset pricing model (CAPM)." Jurnal Manajemen 24.1 (2020): 93-108.
Cite this article
Chen,Z. (2024). The Effect of Monetary Policies in COVID and Post-COVID on the Apple Stock Price and Beta. Advances in Economics, Management and Political Sciences,122,89-95.
Data availability
The datasets used and/or analyzed during the current study will be available from the authors upon reasonable request.
Disclaimer/Publisher's Note
The statements, opinions and data contained in all publications are solely those of the individual author(s) and contributor(s) and not of EWA Publishing and/or the editor(s). EWA Publishing and/or the editor(s) disclaim responsibility for any injury to people or property resulting from any ideas, methods, instructions or products referred to in the content.
About volume
Volume title: Proceedings of the 8th International Conference on Economic Management and Green Development
© 2024 by the author(s). Licensee EWA Publishing, Oxford, UK. This article is an open access article distributed under the terms and
conditions of the Creative Commons Attribution (CC BY) license. Authors who
publish this series agree to the following terms:
1. Authors retain copyright and grant the series right of first publication with the work simultaneously licensed under a Creative Commons
Attribution License that allows others to share the work with an acknowledgment of the work's authorship and initial publication in this
series.
2. Authors are able to enter into separate, additional contractual arrangements for the non-exclusive distribution of the series's published
version of the work (e.g., post it to an institutional repository or publish it in a book), with an acknowledgment of its initial
publication in this series.
3. Authors are permitted and encouraged to post their work online (e.g., in institutional repositories or on their website) prior to and
during the submission process, as it can lead to productive exchanges, as well as earlier and greater citation of published work (See
Open access policy for details).
References
[1]. Assefa, Tibebe A., Omar A. Esqueda, and André Varella Mollick. "Stock returns and interest rates around the World: A panel data approach." Journal of Economics and Business 89 (2017): 20-35.
[2]. Bing, X. I. A. O. "Conditional relationship between beta and return in the US stock market." Expert Journal of Business and Management 4.1 (2016).
[3]. Fletcher, Jonathan. "On the conditional relationship between beta and return in international stock returns." International Review of Financial Analysis 9.3 (2000): 235-245.
[4]. Forbes. (2024) Federal Funds Rate History 1990 to 2023. https://www.forbes.com/advisor/investing/fed-funds-rate-history/.
[5]. Elsas, Ralf, Mahmoud El-Shaer, and Erik Theissen. "Beta and returns revisited: evidence from the German stock market." Journal of International Financial Markets, Institutions and Money 13.1 (2003): 1-18.
[6]. Gunardi, Nugraha, and Maya Sari Disman. "The Effect Of Money Supply And Interest Rate On Stock Price." Journal of Survey in Fisheries Sciences 10.4S (2023): 100-111.
[7]. Feldkircher, Martin, Florian Huber, and Michael Pfarrhofer. "Measuring the effectiveness of US monetary policy during the COVID‐19 recession." Scottish journal of political economy 68.3 (2021): 287-297.
[8]. Asgari Alouj, Hosein, Nahid Maleki Nia, and Seyed Masoud Sajjadian Amiri. "The Effect of Systematic Risk on Cost of Capital Determinants Applying CAPM Model: Evidence from Tehran Stock Exchange (TSE)." Australian Journal of Basic and Applied Sciences 6.10 (2012): 180-188.
[9]. Amanda, Siska Tri, Chairil Akhyar, and Rico Nur Ilham. "The Effect of Inflation, Exchange Exchange, Interest Rate On Stock Price In The Transportation Sub Sector, 2018-2020." Journal of Accounting Research, Utility Finance and Digital Assets 1.4 (2023): 342-352.
[10]. Nasution, Muhamad Syafril, et al. "The Effect of Beta, and Residual Income on Stock Return in The Manufacturing Industry in The Indonesia Stock Exchange." Enrichment: Journal of Management 11.2 (2021): 555-558.
[11]. Rossi, Matteo. "The capital asset pricing model: a critical literature review." Global Business and Economics Review18.5 (2016): 604-617.
[12]. Wijaya, Erric, and Alecia Ferrari. "Stocks investment decision making capital asset pricing model (CAPM)." Jurnal Manajemen 24.1 (2020): 93-108.