


1. Introduction
1.1. Research Background and Significance
As an important component of GDP, the real estate and construction industry constantly influences the macroeconomy's expansion and contraction. For the construction industry, slower labor value-added compared to other industries leads to a slow fluctuation frequency in its production factors [1]. However, property prices have a significant degree of stickiness and randomness. GDP-Construction is theoretically influenced by economic conditions and policy regulation, but property prices, as part of the construction industry, directly drive the implementation of contractionary policies [2]. Das, Gupta and Kabundi also mentioned in his research that housing price fluctuations can serve as an indicator of GDP and inflation rate fluctuations [3]. In the latest economic data released on the official website of the US government, it can be seen that the GDP growth rate for the second quarter of 2024 in the United States is 2.9%. Although it ranks among the top in developed countries, its long-term economic trend is not stable, showing significant fluctuations up and down, reflecting the continuous volatility of the overall economic environment in America. As one of the five major pillar industries in America, real estate and construction industry are important components of its economy and are currently in an initial stage of recovery within the economic cycle.
Output and prices are gradually increasing, making them a crucial part of US GDP and one of the driving forces behind economic growth. The significance of the impact of the financial crisis on the construction industry makes the housing market particularly important in terms of GDP forecasts. Real estate as an important indicator for output and prices influences trends in construction industry GDP, both being affected by cycles, interest rates, economic conditions, consumer preferences etc. The significant increase in housing price index drives market profits and boosts activity within the construction industry; investment stimulation directly impacts numerical values for construction industry GDP. The significance of the impact of the financial crisis on the construction industry makes it particularly essential to housing market in terms of GDP forecasts. From a political perspective, housing price indicators play a dominant role in real estate markets which is closely linked to sensitivity towards economic policies; housing prices are always used as a major benchmark. The two theoretically have some unidirectional correlation together reflecting trends in American economy and activity within construction industry while also influencing policy decision-makers' market interventions. However, there needs to be an understanding from a bidirectional perspective regarding issues faced by construction industry within real estate sector (such as excessive inflationary impact on enthusiasm for building under rising conditions or bubble risks) when analyzing housing price indices alongside construction industry GDP.
The article explores the possible linear relationship between FHFA house prices and GDP-Construction, and examines the sensitivity and bidirectional impact of both variables to shocks in different periods. Based on this condition, better fitting predictions can be made for their respective trends. By determining the weight values of variable stimuli affecting fluctuations in the dependent variable during different time periods, can the proportion of influence between variables be intuitively understood. This study infers the reasons for changes in trends and bidirectional impact levels of FHFA house prices and GDP-Construction by combining economic environments, policies, and data from different periods. It provides a deeper analysis of the immediate relationship between FHFA house prices and GDP-Construction, predicts trend changes after removing exogenous variables, helps adjust oneself better to cope with changes in investor consumption preferences and economic policy shifts. Conversely, macroeconomic policies can use this as partial basis for decision-making when effectively regulating inflation's control over the Construction Industry, thus formulating more suitable policies for the real estate industry.
1.2. Literature Review
The price of real estate plays a crucial role in the measurement of GDP-Construction that cannot be overlooked. The 'wealth effect' indicates that the consumption share within the real estate sector directly influences GDP growth, while economic expansion positively impacts housing prices [4]. Plakandaras and Gupta noted that housing prices typically adjust sales volume in response to fluctuations in their own values, suggesting that housing prices exhibit sticky characteristics [5]. According to the characteristics of housing price stickiness, its degree of activity can be analyzed to understand the different impacts it has on the economy. Canarella, Miller and Pollard substantiated through an analysis of unit sales that the long-term fluctuations in housing prices exhibit a 'ripple effect', shaped by various factors within the real estate sector and overarching macroeconomic trends [6]. Nevertheless, Asadov, Brahim and Yildirim’s research indicates that house prices exhibit asymmetric returns in relation to economic growth [7]. The research further demonstrated that residential investments exhibit a lagged payback in their response to fluctuations in the economic cycle [8]. Although the economy theoretically propels consumption within the real estate sector, subsequently stimulating GDP output and influencing the broader economic environment, this straightforward positive correlation fails to adequately account for the concurrent fluctuations observed in both GDP and housing prices during the same period. The interplay between real estate bubbles and economic dynamics is intricate, with housing prices being shaped by a multitude of specific factors, rather than exhibiting a straightforward linear correlation with economic growth [9]. Previous research has substantiated the potential for further investigation into the relationship between housing prices and GDP. While the datasets pertaining to housing prices and GDP exhibit varying degrees of complexity and randomness, the analysis of GDP data offers a broader array of analytical options compared to that of housing prices. In evaluating future trends in housing prices, the Case-Shiller index is extensively utilized. Beyond index analysis, Balcilar, Gupta and Miller opt to employ both linear and nonlinear autoregressive models under macroeconomic conditions to forecast housing prices [10]. Building upon the foundational AR time series model, Gupta and Kabundi employed dynamic factors and Bayesian shrinkage models to forecast overall housing prices in the United States, akin to the BVAR approach utilized by Gupta and Das for effectively predicting housing prices across 20 states [11, 12]. Additionally, Plakandaras, Gupta, Gogas and Papadimitriou opted for BVAR and BAR models due to prior research clearly demonstrating the superior fitting capabilities of vector autoregressive models in housing price prediction. Previous studies have clearly demonstrated the high degree of fitting of vector autoregressive models for house price forecasting, and explored the causes and potential impacts of changes in GDP on house prices under the regulation of vector autoregressive models [5].
Nevertheless, there exists a paucity of research examining the bivariate correlation between housing prices and GDP within the same timeframe. This study intends to employ the VAR model to validate their correlation, perform impulse response analysis, and conduct error variance decomposition predictions. Furthermore, it aims to analyze potential factors contributing to fluctuations in the relationship between GDP and housing prices by assessing the impact of shocks over varying time intervals. Building upon existing literature, this paper investigates these two variables from diverse perspectives to elucidate activity level fluctuations more effectively and provide constructive guidance for economic policy through an examination of external variables.
1.3. Research Contents
Based on the active exploration and analysis of the sensitivity between FHFA house prices and GDP-Construction presented in this article, the research process can be categorized into the following steps according to the study's direction. (1) Utilize a two-variable time series to construct a two-dimensional Vector Autoregression (VAR) model, and forecast the future actual changes in FHFA house prices and GDP-Construction based on this model. (2) Perform impulse response analysis and predict error variance decomposition using the model, systematically examining the effects of short-term fluctuations and variance weighting values. (3) Investigate the underlying causes of varying trend fluctuations within the VAR framework, providing a coherent explanation for alterations in the bidirectional feedback relationship. Following this analysis, relevant recommendations are proposed for macroeconomic considerations.
2. Method
2.1. VAR
This paper cites the housing price index provided by the Federal Housing Finance Agency (FHFA) and the total value of US construction industry GDP from the official website of the US Department of the Treasury. The sample period from September 2008 to March 2024 is selected to construct two quarterly time series. The study aims to explore the dynamics of the US real estate price index and its predictive ability and impact on construction industry GDP.
In the realm of data analysis, a fundamental vector autoregression (VAR) model was employed to conduct a cross-analysis of two time series. The VAR model effectively mitigated the influence of exogenous variables, treating all variables as endogenous. The linear correlation among the endogenous variables was examined based on their interrelationships.
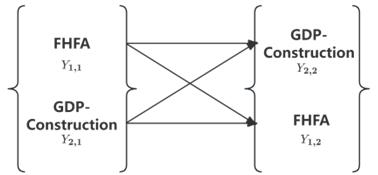
In the VAR model, all variables are represented by y. \( \text{y}_{\text{1,t}} \) is the observed value of variable \( \text{y}_{\text{1}} \) (FHFA housing price) at time t, \( \text{y}_{\text{2,t}} \) is the observed value of variable \( \text{y}_{\text{2}} \) (GDP-Construction) at time t, and \( \text{y}_{\text{1,t}} \) and \( \text{y}_{\text{2,t}} \) jointly act on \( \text{y}_{\text{1,t+1}} \) and \( \text{y}_{\text{2,t+1}} \) respectively. A (2*2) identity matrix was used to show the bidirectional feedback relationship between variables (see figure 1).
|
Figure 1: Two-way feedback relationship of VAR model. |
After considering the impact of white noise process(e) and the self-lag term ( \( \text{ϕ}_{\text{ii}} \) ) on the variable \( \text{y}_{\text{i,t}} \) in L-period lag, a two-dimensional VAR(1) model is assumed with the lag term set to 1 before specific variables are inputted.
\( \text{y}_{\text{1,t+1 }}\text{= }\text{c}_{\text{1 }}\text{+ }\text{ϕ}_{\text{11,1}}\text{y}_{\text{1,t}}\text{ + }\text{ϕ}_{\text{12,1}}\text{y}_{\text{2,}}\text{+ }\text{e}_{\text{1,t+1}} \) (1)
\( \text{y}_{\text{2,t+1 }}\text{= }\text{c}_{\text{2 }}\text{+ }\text{ϕ}_{\text{21,1}}\text{y}_{\text{1,t}}\text{ + }\text{ϕ}_{\text{22,1}}\text{y}_{\text{2,}}\text{+ }\text{e}_{\text{2,t+1}}\text{ } \) (2)
By satisfying accurate prediction requirements under conditions with a small number of variables and few categories, VAR models provide flexibility for analysis. Under this premise, impulse response analysis and variance impact testing are performed to identify immediate relationships between FHFA house price index and US GDP-construction in different intervals, as well as comparing relative effectiveness at sample turning points between these two types of time series models. Specific correlation data analysis results are obtained based on VAR models, revealing reasons behind trend synchronization fluctuations, along with recommendations for both predictions.
2.2. Pretreatment
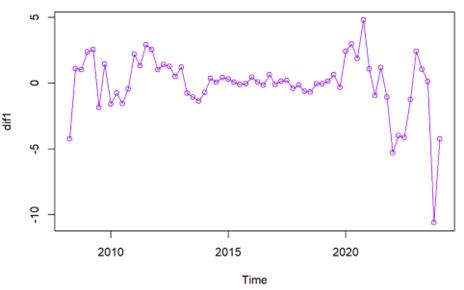
Use the ts function to define the FHFA House Price Index and US GDP-construction as time series data from 2008 to 2024, divided by quarters, and perform preliminary processing. The stationarity of the FHFA House Price Index after first-order differencing is verified through Ljung-Box test. From the initial observation plot (see Figure 2), it can be seen that after experiencing irregular fluctuations around 2010, the FHFA House Price Index tends to remain stable within a certain range but shows significant volatility trends after 2020.
|
Figure 2: FHFA house price index first difference. |
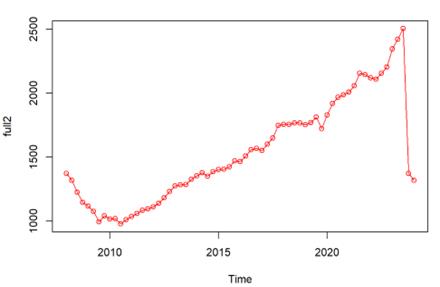
ADF testing confirms that US GDP-construction is a non-white noise sequence, it is observed that it stabilizes and rises after a local minimum point in 2010 but sharply declines after 2020 (see Figure 3).
|
Figure 3: US GDP-construction. |
2.3. Model Assumption
After constructing the VAR model, using ADF test with respect to the overall sample size of the model, the study determines the relationship between polynomial roots and unit circle positions. The results show that all polynomial roots are approximately located inside the unit circle, ensuring the stationarity of VAR model and further validating its reliability. After preliminary evaluation of the model, VAR select function is used to select optimal lag order according to Bayesian criteria with appropriately fitting p-value set at 5 (see Table 1).
Table 1: optimal lag order.
AIC(n) |
HQ(n) |
SC(n) |
FPE(n) |
6 |
6 |
5 |
6 |
When applying VAR model to these two matrices, it is found that standard errors are small and coefficient estimates are relatively accurate. Both FHFA House Price Index and US GDP-construction have p-values less than 0.05 in both first quarter and fifth quarter periods which indicates statistically significant correlations between these variables during different time periods aligning with varying frequency fluctuations of FHFA House Price Index (see Table 2). The multivariate R-squared values for FHFA House Price Index and US GDP-construction are 0.9167 and 0.919 respectively. The difference between F value and P value is very large, and the model fitting effect is remarkable.
Table 2: The results of VAR model.
|
Std. Error |
Pr(>|t|) |
|
Std. Error |
Pr(>|t|) |
(1) FHFA_ts FHFA |
(2) GDP_ts GDP |
||||
FHFA_ts 11 |
0.215764 |
1.91e-10 *** |
FHFA_ts 11 |
15.0100 |
0.018604* |
GDP_ts 11 |
0.003151 |
0.01580 * |
GDP_ts 11 |
0.2192 |
\ |
FHFA_ts 15 |
0.209121 |
0.01458 * |
FHFA_ts 15 |
1.890 |
0.064733 . |
GDP_ts 15 |
0.006854 |
\ |
GDP_ts 15 |
0.396 |
\ |
const |
\ |
0.00725 * |
const |
\ |
0.000227 * |
Note: p < 0.05, * p < 0.01, ** p < 0.001, *** p → 0
After organizing the VAR model, the Table 3 shows that there are outliers in the data. Through correlation analysis, it is found that there is a strong positive correlation coefficient of 0.78 between FHFA house price index and US GDP-construction. Based on their synchronous growth phenomenon, it can be initially hypothesized that there are common driving factors between FHFA house price index and US GDP-construction in the short term, which mutually influence and drive each other.
Table 3: The covariance and correlation.
Covariance matrix of residuals: |
||
|
FHFA_ts.FHFA |
GDP_ts.GDP |
FHFA_ts.FHFA |
3.402 |
184.6 |
GDP_ts.GDP |
184.603 |
16465.5 |
Correlation matrix of residuals: |
||
|
FHFA_ts.FHFA |
GDP_ts.GDP |
FHFA_ts.FHFA |
1.00 |
0.78 |
GDP_ts.GDP |
0.78 |
1.00 |
Using the VAR model to predict FHFA house price index and US GDP-construction (see Figure 4), the results show that the former shows a gradual upward trend while the latter first rises and then falls.
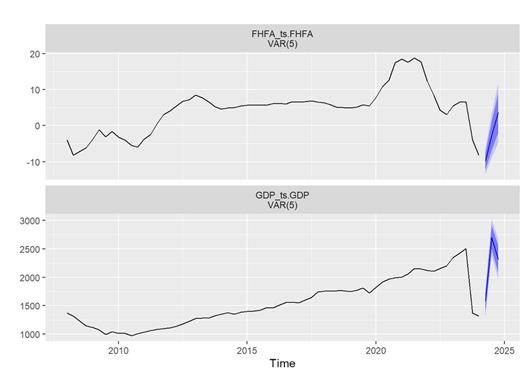
Figure 4: the prediction of FHFA house price index and US GDP-construction.
3. Hypothesis Test
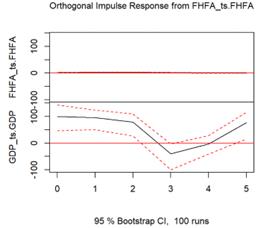
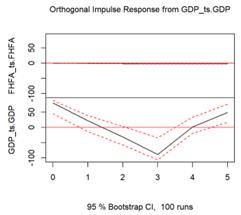
3.1. Pulse Wave Response
Impulse response analysis was conducted on the two variables using the VAR model. From Figure 5, it can be observed that the predicted values fit significantly well within a 95% bootstrap CI, with both variables showing a gradual upward trend after the third period.
|
|
(1) |
(2) |
Figure 5: Pulse Wave Response.
3.2. Homogeneity of Variance Test
The variance decomposition test was performed on the two variables (see Figure 6). It revealed that FHFA house price index contributes relatively more to the variance of US GDP-construction, indicating a significant impact of external shocks from FHFA house price index on US GDP-construction. The proportion charts of these two variables suggest that the influence of construction industry GDP on FHFA house price index gradually increases over quarters, while the impact of FHFA house price index on construction industry GDP shows a monotonic decreasing trend followed by an increasing trend within each quarter and reaches its minimum peak in the third time period.
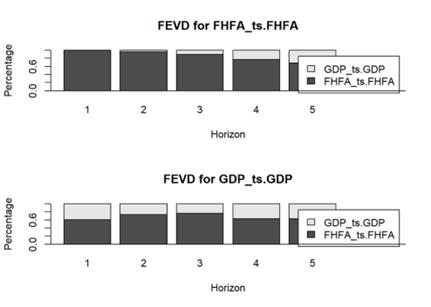
Figure 6: Homogeneity of Variance Test.
4. Discussion
There are several changes that the real estate and construction industry can make from within itself. Firstly, accelerate the transformation of the existing manufacturing and sales forms to adapt to the adjustment of economic policies. Change the cost of goods in the manufacturing process and start from the way goods are exchanged with consumers. Reasonably avoid losses and information errors to a certain extent and avoid the negative impact of inflation and interest rate policies. Not only that, the output of real estate construction and the national investment demand for real estate as the fundamental cause affecting market balance should be given greater focus on research, focusing on the supply and demand relationship in the market and making positive adjustments to it. Accelerate the upgrading and transformation of the real estate and construction industry. In addition, the consumer's preference for real estate selection is reflected directly in the fluctuation of GDP-Construction.
In terms of national policies, firstly, the comprehensive coverage of infrastructure bill funding is one of the important prerequisites for its effective implementation. Regular inspections of the disbursement of funds can help verify the effective implementation of the bill and better utilize government regulation to encourage the active participation of the construction industry. Secondly, the government should make appropriate adjustments to inflation and change the intensity at any time to give the industry time to respond, so that it can better adapt to different periods with greater conformity. Finally, real estate investment, as a high-cost consumption, has fostered a lending chain in the real estate industry, and due to the influence of monetary policy on the cost and quantity of credit, fluctuations in interest rates on loans have a fundamental determining effect on the fluctuations of the housing market. Related authorities should reasonably set the standards for borrowers based on changes in purchasing power and economic environment. Reasonably setting borrowers' expectations can help enhance their rationality and minimize their "zeitgeist" to the greatest extent possible, which Commit to maintaining a balanced credit market [13].
5. Conclusion
According to the VAR model results, it can be analyzed that the FHFA house price index exhibits an unstable trend at both ends, especially the terminal change greatly affects US GDP-construction. In the original time series graph of US GDP-construction, it can be observed that during the economic recovery period after entering the economic crisis around 2010, the growth of US GDP-construction was more constrained by macroeconomic factors. Market instability is a common factor causing fluctuations in both variables. During the transition from decline to recovery, government intervention through monetary policies and other economic measures regulates the market. The government's intervention somewhat suppresses the volatility of house price index, and during this period, there is less impact of FHFA house price index on US GDP-construction.
Both FHFA house price index and US GDP-construction experienced sudden declines in their original data during 2020; however, their correlation steadily increased during this period. Based on this correlation analysis, it can be inferred that exogenous variables influenced both variables in the same direction at this time. Firstly, due to continuously rising inflation rates, Federal Reserve chose to increase loan interest rates as a response policy; multiple increases in mortgage rates impacted consumer demand. Secondly, after a stable boom in its initial stage, real estate industry entered an adjustment phase; meanwhile 2020 marked a period of economic recovery post-pandemic where uncertainty about overall economic environment affected investors' decisions regarding real estate assets - setting up a contraction for FHFA house price index and US GDP-construction.
According to the analysis of FHFA house price index and GDP-Construction, the following correlation suggestions are proposed from both the real estate and construction industry itself and government macro-control perspectives: The construction industry should undergo transformation and upgrading in various aspects, effectively grasp consumer psychology and consumption expectations to intuitively promote positive economic development. At the same time, in different periods, appropriate changes should be made to monetary policies and other economic policies based on existing conditions to more effectively intervene in market regulation and support the long-term development of the construction industry. This will stabilize the economic environment and further drive the gross domestic product of the construction and real estate industries.
However, although the VAR model used in this paper avoids the intervention of exogenous variables, for the variable with large randomness such as housing price, although parameterization can unilaterally analyze the relationship between housing price and GDP-Construction in a short period of time, it is certainly not enough to make the most reasonable analysis of its complex correlation. Several significant issues remain on the agenda for further researches: (1) The randomness of time series weakens the explanatory power of the model, and the prediction credibility of future changes is reduced compared with stable data. (2) The lag class used in this paper is relatively large, which can only predict the short-term trend and is not suitable for the long-term overall analysis. (3) The macroeconomic environment and policy regulation considered in this paper cannot be the only basis for changing the complex relationship between housing price and GDP. Us housing price is not only regulated by economic fluctuations and policies in a certain period of time, but also influenced by a large number of exogenous variables such as household income.
In this regard, further research in the future can expand and improve the method by adding more restrictive factors to the model. For example, adding an intermediate variable to better cope with changes at different times to ensure the accuracy of the index or constructing a multi-dimensional matrix with other factors as variables. For this study, fiscal policy and macroeconomic changes can be represented by fiscal policy variables (FISPOL) and inflation rate (INFL), and significant fluctuations can be separated as key time periods as sub-time series for discussion. In addition to the VAR model used in this study, other models such as radial basis function (RBF), sigmoid, polynomial, and the most common BVAR model and DSGE model can be used. After building and comparing multiple models, the best model can be selected to ensure the validity of the conclusions with a large number of experiments.
References
[1]. Chijoo L, Ghang L, Jongsung W. (2019). Trends of construction productivity growth in Europe, the United States and Japan.Journal of the Architectural Institute of Korea Structure & Construction 35 (4), 175-184.
[2]. Mishkin, S. (2022). Home prices are softening. Fed Chair Powell says that’s a good thing. Barron’s. Retrieved from https://www.barrons.com/articles/home-prices-mortgage-rates-fed51663885684
[3]. Das, S., Gupta, R. and Kabundi, A. (2010). The blessing of dimensionality in forecasting real house price growth in the nine census divisions of the US. Journal of Housing Research, 19 (1), 89-109.
[4]. J Muellbauer, A Murphy. (1990). Is the UK balance of payments sustainable? Economic Policy 5 (11), 347-396.
[5]. V Plakandaras, R Gupta, P Gogas, T Papadimitriou. (2015). Forecasting the U.S. Real House Price Index. Economic Modelling 45, 259-267.
[6]. G Canarella, S Miller, S Pollard. (2012). Unit Roots and Structural Change: An Application to US House-Price Indices. Urban Studies 49 (4), 757-776.
[7]. Al Asadov, MH Ibrahim, R Yildirim. (2023). Impact of House Price on Economic Stability: Some Lessons from OECD Countries. The Journal of Real Estate Finance and Economics, 1-31.
[8]. C Mayer, T Sinai. (2019).U.S. House Price Dynamics and Behavioral Finance. Policy Making Insights from Behavioral Economics, edited by Christopher L. Foote, Lorenz Goette, and Stephan Meier.
[9]. Aizenman, J., Jinjarak, Y., & Zheng, H. (2019). Housing bubbles, economic growth, and institutions. Open Economies Review, 30, 655-674.
[10]. Balcilar M., Gupta R. and Miller M.S. (2015). The Out-of-Sample Forecasting Performance of Non-Linear Models of Regional Housing Prices in the US." Journal of Real Estate Research.
[11]. Gupta, R and Kabundi, A. and Miller, S.M. (2011). Forecasting the US real house price index: structural and non-structural models with and without fundamentals. Economic Modelling, 28, 2013-2021.
[12]. Gupta, R. and Das, S. (2010). Predicting downturns in the US housing market: a Bayesian approach. Journal of Real Estate Finance and Economics, 41 (3), 294-319.
[13]. Shiller, Robert J. (2007). Understanding Recent Trends in House Prices and Home Ownership. Presented at the Federal Reserve Bank of Kansas City Symposium at Jackson Hole, Retrieved from http://www.kc.frb.org/publicat/sympos/2007/PDF/Shiller_0415.pdf.
Cite this article
Jiang,X. (2024). Analysis of Changes in the Sensitivity of US Housing Prices and Construction Sector GDP to Each Other's Activity under VAR Model. Advances in Economics, Management and Political Sciences,123,171-180.
Data availability
The datasets used and/or analyzed during the current study will be available from the authors upon reasonable request.
Disclaimer/Publisher's Note
The statements, opinions and data contained in all publications are solely those of the individual author(s) and contributor(s) and not of EWA Publishing and/or the editor(s). EWA Publishing and/or the editor(s) disclaim responsibility for any injury to people or property resulting from any ideas, methods, instructions or products referred to in the content.
About volume
Volume title: Proceedings of ICEMGD 2024 Workshop: Policies to Enhance Sustainable Development through the Green Economy
© 2024 by the author(s). Licensee EWA Publishing, Oxford, UK. This article is an open access article distributed under the terms and
conditions of the Creative Commons Attribution (CC BY) license. Authors who
publish this series agree to the following terms:
1. Authors retain copyright and grant the series right of first publication with the work simultaneously licensed under a Creative Commons
Attribution License that allows others to share the work with an acknowledgment of the work's authorship and initial publication in this
series.
2. Authors are able to enter into separate, additional contractual arrangements for the non-exclusive distribution of the series's published
version of the work (e.g., post it to an institutional repository or publish it in a book), with an acknowledgment of its initial
publication in this series.
3. Authors are permitted and encouraged to post their work online (e.g., in institutional repositories or on their website) prior to and
during the submission process, as it can lead to productive exchanges, as well as earlier and greater citation of published work (See
Open access policy for details).
References
[1]. Chijoo L, Ghang L, Jongsung W. (2019). Trends of construction productivity growth in Europe, the United States and Japan.Journal of the Architectural Institute of Korea Structure & Construction 35 (4), 175-184.
[2]. Mishkin, S. (2022). Home prices are softening. Fed Chair Powell says that’s a good thing. Barron’s. Retrieved from https://www.barrons.com/articles/home-prices-mortgage-rates-fed51663885684
[3]. Das, S., Gupta, R. and Kabundi, A. (2010). The blessing of dimensionality in forecasting real house price growth in the nine census divisions of the US. Journal of Housing Research, 19 (1), 89-109.
[4]. J Muellbauer, A Murphy. (1990). Is the UK balance of payments sustainable? Economic Policy 5 (11), 347-396.
[5]. V Plakandaras, R Gupta, P Gogas, T Papadimitriou. (2015). Forecasting the U.S. Real House Price Index. Economic Modelling 45, 259-267.
[6]. G Canarella, S Miller, S Pollard. (2012). Unit Roots and Structural Change: An Application to US House-Price Indices. Urban Studies 49 (4), 757-776.
[7]. Al Asadov, MH Ibrahim, R Yildirim. (2023). Impact of House Price on Economic Stability: Some Lessons from OECD Countries. The Journal of Real Estate Finance and Economics, 1-31.
[8]. C Mayer, T Sinai. (2019).U.S. House Price Dynamics and Behavioral Finance. Policy Making Insights from Behavioral Economics, edited by Christopher L. Foote, Lorenz Goette, and Stephan Meier.
[9]. Aizenman, J., Jinjarak, Y., & Zheng, H. (2019). Housing bubbles, economic growth, and institutions. Open Economies Review, 30, 655-674.
[10]. Balcilar M., Gupta R. and Miller M.S. (2015). The Out-of-Sample Forecasting Performance of Non-Linear Models of Regional Housing Prices in the US." Journal of Real Estate Research.
[11]. Gupta, R and Kabundi, A. and Miller, S.M. (2011). Forecasting the US real house price index: structural and non-structural models with and without fundamentals. Economic Modelling, 28, 2013-2021.
[12]. Gupta, R. and Das, S. (2010). Predicting downturns in the US housing market: a Bayesian approach. Journal of Real Estate Finance and Economics, 41 (3), 294-319.
[13]. Shiller, Robert J. (2007). Understanding Recent Trends in House Prices and Home Ownership. Presented at the Federal Reserve Bank of Kansas City Symposium at Jackson Hole, Retrieved from http://www.kc.frb.org/publicat/sympos/2007/PDF/Shiller_0415.pdf.