


1. Introduction
Danny Meyer opened the Shake Shack hot dog stand on New York’s Madison Park Plaza in 2001 near the New York headquarters of Credit Suisse Investment Bank. Soon after the initial cart opened, people began lining up every day during the lunch hour. In 2010, Shake Shack expanded and opened its first location outside of New York in South Beach, Miami. As a result, its menu was expanded from New York-style hot dogs to burgers, fries, and its signature milkshakes. It eventually filed for an IPO in late 2014 and became a publicly traded corporation. Shake Shack is currently one of the best fast-food restaurants in the world [1]. Due to its extreme popularity, this paper aims to analyze Shake Shack’s future development trends. Therefore, Shake Shack could recognize and control future uncertainty, minimizing ignorance of the future. Also, Shake Shack could adjust in advance to achieve better brand development.
2. An Analysis of Stock Price
2.1. Undervalued Stock Price
The discounted cash flow (DCF) can be used to value this company and estimate its future trends through its estimated stock price and real-time stock price. Firstly, all future net cash flows that the firm will generate can be estimated based on three financial statements [2]. The “forecast sheet” function in Excel is suitable for estimating all indices from 2024 to 2028. Then, the appropriate discount rate and discounted future cash flows to the firm can be calculated. The weighted average cost of capital (WACC) and the capital asset process model (CAPM) are utilized to get the final stock price per share. Their respective equations are shown below in number 1 and number 2. In conclusion, after utilizing the DCF, I found that the difference between the final stock price per share of $100.35 and the real-time stock price of $101.38 is $1.03. Therefore, Shake Shack’s stock is overvalued, and its growth will be downward. This prediction is the same as the author Caixia Hu [3]. She states that Shake Shack continues to have growing costs and past borrowings that must be paid off [3]. Compared today and to other competitors, it is believed to be overvalued as its P/E ratio far exceeds its competitors and the industry average due to the accumulated expenses and debts since its IPO [3]. The following are equations necessary for calculating the final stock price.
\( Discount rate (WACC) = cost of debt × weight in debt + cost of equity × weight in equity + cost of preferred share × weight in preferred share \) (1)
\( Cost of equity (CAPM) = risk free rate +levered beta × equity risk premium \) (2)
\( Terminal value=cash flow after 2028×(discount rate-terminal growth rate \) (3)
\( Present value=\frac{unlevered free cash flow}{{(1+discount rate)^{number of years}}} \) (4)
\( DCF price per share=\frac{values of equity}{number of shares outstanding} \) (5)
2.2. Other Impacting Factors
The future trend of Shake Shack can be influenced by many factors, and stock price is not the only predictor. Thus, the following should be considered: the overall market value of the industry and the market demand. The global fast-food industry is valued at approximately USD 907.2 billion as of 2023 and is projected to grow significantly in the coming years[4]. By 2029, it is expected to reach around USD 1.1 trillion, driven by increasing urbanization, higher disposable incomes, and the expansion of fast-food chains into new markets [4]. North America holds the largest market share, and it is particularly dominated by the United States. Europe and the Asia-Pacific regions also contribute significantly to the global market, with fast growth observed in countries like China and India due to changing lifestyles and increasing digital food delivery platforms. Overall, the fast-food industry’s growth is driven by extensive franchise networks and continuous innovation in menu offerings and service methods. Therefore, these two factors may play an important role in affecting Shake Shack’s future development.
3. Key Financial Metrics
3.1. Profitability Metrics
The diluted earnings per share (EPS) of Shake Shack is $0.46/share, which is used by the following equation. A diluted EPS of $0.46/share for Shake Shack indicates that after accounting for all potentially dilutive securities, the company earned $0.46 per share over the reporting period. To fully understand what this figure signifies, it is essential to compare it against industry benchmarks. The average EPS among fast-food restaurants is $7.359 per share. Those food restaurants include McDonald’s, Starbucks, Yum! Brands, Restaurant Brands International, Chipotle Mexican Grill, Domino’s Pizza, Wendy’s, Dunkin’, Papa John’s, and Wingstop. Based on these two distinct numbers, Shake Shack’s EPS of $0.46 is significantly lower than the industry average of $7.359. This indicates that Shake Shack is less profitable on a per-share basis than other fast-food restaurants. A lower EPS could be due to lower revenues or Shake Shack might be in an earlier growth stage compared to its peers. Moreover, the return on equity (RoE) is 4.6%. Its equation is shown below. However, the average return on equity in the fast-food industry is 25.89%. This suggests the underperformance of Shake Shack in terms of profitability compared to the industry norm. Furthermore, the return on assets (RoA) is 1.3%. The equation numbered in 8 below shows how to compute RoA. For fast-food restaurants, RoA can vary widely depending on business model, scale, and operational efficiency. Generally, competitive RoA figures can range from 5% to 10% or higher for successful companies in the industry. Thus, Shake Shack’s RoA of 1.3% may indicate that the company is less efficient in generating profits from its assets than its peers. Last but not least, using the equation numbered in 9 below to obtain Shake Shack’s operating margin of 0.5% manifests that the company has a low-profit margin on its core operations before accounting for other expenses like interest and taxes. This suggests that the company may need to focus on improving efficiency, controlling costs, or optimizing its pricing strategy to enhance profitability.
\( Diluted EPS=\frac{net income}{weighted average shares+convertible securities} \) (6)
\( RoE=\frac{net income}{shareholder{s^{ \prime }} equity}×100 \) (7)
\( RoA=\frac{net income}{total assets}×100 \) (8)
\( Operating Margin=\frac{operating income}{revenue}×100 \) (9)
3.2. Credit Metrics
The financial leverage ratio is 3.6. A financial leverage ratio of 3.6 indicates that Shake Shack relies heavily on debt to finance its operations and growth initiatives. While debt can provide leverage and tax advantages, it also increases financial risk, particularly in volatile economic conditions. Higher leverage ratios can limit Shake Shack’s operational flexibility and ability to undertake additional debt for future growth or expansion initiatives without increasing financial risk.
\( Financial Leverage Ratio=\frac{total assets}{shareholder{s^{ \prime }} equity} \) (10)
4. Strategy Analysis
4.1. Expansion Strategy: Digital Innovation
Successful fast-food restaurants emphasize excellence at every level of their state-of-the-art operations, ensuring longevity [5]. Shake Shack has put a lot of effort into the way it operates. It has grown through a combination of company-owned and franchised locations. They often choose high-traffic urban locations and premium retail spaces to maximize visibility and foot traffic. They are also proficient at promoting their brands through social media. They have their accounts on all major social platforms on which they share pictures of their products to trigger consumers’ attention and retweet to realize the effective communication of their brands. Among the people who know Shake Shack, 67.5% know its brand through social media. Thus, Shake Shack’s brand is mainly known to the public in China through social media such as Weibo and WeChat [6]. In addition, they made online innovations. Since WeChat has more than 1.26 billion users worldwide, Shake Shack has embedded a small program and QR code logo in the menu in China. Consumers can pay attention to the subscription number or order online in the small program by scanning the code, which not only changes the traditional way of consumption of customers but also the tweets in the small program can output information to consumers about brand activities and brand development [7].
4.2. Business Philosophy and Consumers’ Inclination
Shake Shack’s burgers are known as expensive. In China, burgers range from ¥38 to ¥84, and the price of a single-layer signature beef burger is ¥49, which is much higher than the price of burgers in other fast-food chains. Expensive burger brands also need to get to the heart of their product if they want to continue to be revitalized. Burgers, as a staple food, are inherently difficult to make a high sense of value, so there are already some brands that are starting to move closer to multi-category, cost-effective products, which will ensure that customers come back long after the popularity has faded [8]. It’s true that expensive burger restaurants need character for people to pay for burgers. For Shake Shack, its uniqueness is high quality. Shake Shack’s philosophy is “Stand For Something Good,” which means they focus on spreading the concept of healthy fast food. Shake Shack’s burgers are made with top-quality ingredients such as Angus beef, hormone-free beef sausage, organic vegetables, and portobello mushrooms. This is different from other ordinary fast-food brands advocating the concept of convenience and low prices, so this difference ultimately distinguishes Shake Shack from other fast-food brands. Consumer attitudes change constantly and are influenced by age, income, lifestyle, and household composition. In recent years, health factors have become increasingly essential , and they are one of the issue that fast-food operators have had to address in terms of image [9]. The visual identities of Shake Shack are fresh, quality-made and community centered [10]. As a result, Shake Shack has many followers who pursue a healthy diet around the world and they are willing to pay for burgers from Shake Shack. By providing healthy food and organizing regular offline sports activities for community members, Shake Shack has created a reputation for healthy living. When people have a good experience, they will share it with their family and friends. As more and more people get to know this brand, brand communication can be realized, and further earnings can be earned.
5. Predicting Price Trends in China and the U.S.
5.1. The Impact of the Big Mac Index on the Exchange Rate
According to The Economist, the Big Mac Index (BMI) is that, under perfect competition, the same commodity should be priced in the same currency in different countries or markets. The price should be the same in accordance with the Law of One Price or Purchasing Power Parity (PPP). BMI is used to evaluate whether the exchange rates of various countries reflect the ratio of the actual prices of goods in different countries. The principle is to assume that the prices of Big Mac hamburgers sold in McDonald’s restaurants in each country are theoretically equivalent, and then compare the prices of Big Mac hamburgers in each country by converting them into dollars through the exchange rate, so as to arrive at the difference between the level of purchasing power of each country and the actual exchange rate [11]. Shake Shack and McDonald’s are both key players in the fast-food industry and popular restaurants where consumers go for burgers. Also, they both offer expedient service which is quick meals. Given that Shake Shack and McDonald’s exhibit similar market characteristics, this study utilized the prices of Shake Shack in both China and the United States to calculate BMI. Subsequently, since a linear regression model can be utilized to analyze the impact of the BMI on the predicted exchange rate through the theory of PPP, this kind of model was employed so that the actual exchange rate and predicted exchange rate can be compared. The historical exchange rate was sourced from the State Administration of Foreign Exchange, while the pricing data for Shake Shack in both China and the United States was extracted from The Economist [12, 13]. The model is represented as follows:
\( y=7.8984-0.2436x \) (11)
where y signifies the predicted exchange rate between the Renminbi (RMB) and the U.S. dollar (USD), and x denotes the BMI value, which is the price in China over the price in the United States. The coefficients were generated through a programming language called R. Based on the model, an increase in one unit of BMI leads to a 0.2436 decrease in the predicted exchange rate.
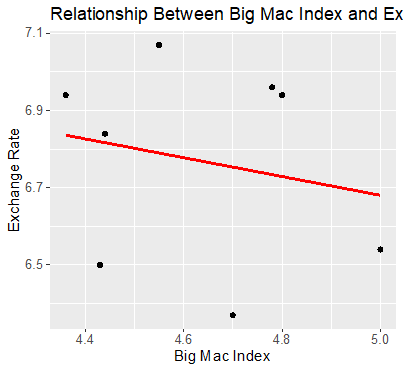
Figure 1: The correlation between the Big Mac Index (BMI) and the predicted exchange rate
5.2. Using Estimated Exchange Rates to Forecast Prices in Both China and the U.S.
Moreover, this paper predicts the future prices of Shake Shack in China and the United States through the future estimated exchange rate. According to the Economy Forecast Agency, the exchange rate of RMB against the U.S. dollar is on an upward trend from 2025 to 2028 [14], which means either RMB depreciates or U.S. dollar appreciates. Since the numerator of x is equal to the price in China and its denominator is equal to the price in the U.S., as x gets smaller and smaller, either the denominator gets larger or the numerator gets smaller or both could happen. Thus, the price of Shake Shack in China is likely to decrease, and on the contrary, the price of Shake Shack in the U.S. is likely to increase.
6. Conclusion
To sum up, Shake Shack’s stock price of $100.35 is overvalued by using the DCF model, and some major financial metrics, including diluted EPS, RoE, RoA, and operating margin, suggest that Shake Shack has little profit margin by comparing Shake Shack with other fast-food restaurants. Nevertheless, more and more people have started paying attention to their health in the contemporary world, and they are more likely to buy burgers from Shake Shack, which will then increase Shake Shack’s sales revenue. In the long run, Shake Shack must take certain measures to ensure it stays profitable. Reducing costs and expanding scales are suggested. Additionally, depending on the BMI and the actual exchange rate, the prices of food in Shake Shack may be more expensive in the U.S. and less expensive in China in the future. In addition, this paper has some shortcomings that need to be taken into consideration. Since Shake Shack is considered a growth company, estimating the stock price with the DCF model may not be very accurate; instead, utilizing Price/Earnings-to-Growth ratio model may be more precise. To better predict the growth prospects of Shake Shack, future research will focus on analyzing its business model and its competition pattern as well as examining competitors’ market shares and competitive strategies.
References
[1]. Jiang, Y. (2023). The Competitiveness of Shake Shack in Chengdu under SWOT Analysis. https://pdfs.semanticscholar.org/1500/a37004b4adb12fc476fc0618e753d9a7c2c6.pdf
[2]. U.S. Securities and Exchange Commission. (n.d.). EDGAR Entity Landing Page. https://www.sec.gov/edgar/browse/?CIK=1620533&owner=exclude
[3]. Hu, C., (2010). Shake Shack IPO Analysis. Journal of Contemporary Educational Research, 2021, Volume 5, Issue 9
[4]. Market Data Forecast. (2024). Fast food market size, share, growth report | 2024 to 2029. https://www.marketdataforecast.com/market-reports/fast-food-market
[5]. Klein, R. (2016). Fast-Food Restaurant Industry: A Cleveland Perspective 1930-2016. https://engagedscholarship.csuohio.edu/cgi/viewcontent.cgi?article=1001&context=msl_ae_ebooks
[6]. Zhang Yuming. (2021). Research on the Communication Strategies of Catering Brands in the Digital Economy Era (Master’s thesis, Capital University of Economics and Business).
[7]. Lu, Y. (2022). Implications of Shake Shack's localization strategy for the development of Chinese catering enterprises. Capital University of Economics and Business.
[8]. Zhou Lixi. (2023). High-end Burgers in Demand: Achieving Long-term Success is Not Easy. China Food (01), 62-64. doi:CNKI:SUN.0.2023-01-009.
[9]. Elliott, P., & Reed, R. (1999). The valuation of fast-food outlets: analysis, methodology, and reliability. Appraisal Journal, 67, 359-369.
[10]. Kuusimaa, V. (2017). Fast food should look good: Scanburger’s new corporate visual identity. https://www.theseus.fi/bitstream/handle/10024/141867/Kuusimaa_Ville.pdf?sequence=8&isAllowed=y
[11]. Jiang Xin. (2022). An Analysis of the RMB Exchange Rate Trend Based on the Big Mac Index Perspective. In Financial and Economic Observations (2021 Issue 2) (pp. 16-23).
[12]. Yao, Z. (2023, August). Chinese Yuan central parity rate. State Administration of Foreign Exchange of China. http://www.safe.gov.cn/AppStructured/hlw/RMBQuery.do?COLLCC=170255276
[13]. The Economist. (2023). Big Mac data and methodology [GitHub repository]. https://github.com/TheEconomist/big-mac-data
[14]. Long Forecast. (2024). Dollar to yuan forecast 2024, 2025, 2026 - 2028 - Long Forecast. https://longforecast.com/chinese-yuan-forecast-2017-2018-2019-2020-2021-usd-to-rmb-and-rmb-to-usd
Cite this article
Li,Q. (2024). Analysis of Shake Shack Development Trend and the Influencing Factors. Advances in Economics, Management and Political Sciences,111,104-109.
Data availability
The datasets used and/or analyzed during the current study will be available from the authors upon reasonable request.
Disclaimer/Publisher's Note
The statements, opinions and data contained in all publications are solely those of the individual author(s) and contributor(s) and not of EWA Publishing and/or the editor(s). EWA Publishing and/or the editor(s) disclaim responsibility for any injury to people or property resulting from any ideas, methods, instructions or products referred to in the content.
About volume
Volume title: Proceedings of the 8th International Conference on Economic Management and Green Development
© 2024 by the author(s). Licensee EWA Publishing, Oxford, UK. This article is an open access article distributed under the terms and
conditions of the Creative Commons Attribution (CC BY) license. Authors who
publish this series agree to the following terms:
1. Authors retain copyright and grant the series right of first publication with the work simultaneously licensed under a Creative Commons
Attribution License that allows others to share the work with an acknowledgment of the work's authorship and initial publication in this
series.
2. Authors are able to enter into separate, additional contractual arrangements for the non-exclusive distribution of the series's published
version of the work (e.g., post it to an institutional repository or publish it in a book), with an acknowledgment of its initial
publication in this series.
3. Authors are permitted and encouraged to post their work online (e.g., in institutional repositories or on their website) prior to and
during the submission process, as it can lead to productive exchanges, as well as earlier and greater citation of published work (See
Open access policy for details).
References
[1]. Jiang, Y. (2023). The Competitiveness of Shake Shack in Chengdu under SWOT Analysis. https://pdfs.semanticscholar.org/1500/a37004b4adb12fc476fc0618e753d9a7c2c6.pdf
[2]. U.S. Securities and Exchange Commission. (n.d.). EDGAR Entity Landing Page. https://www.sec.gov/edgar/browse/?CIK=1620533&owner=exclude
[3]. Hu, C., (2010). Shake Shack IPO Analysis. Journal of Contemporary Educational Research, 2021, Volume 5, Issue 9
[4]. Market Data Forecast. (2024). Fast food market size, share, growth report | 2024 to 2029. https://www.marketdataforecast.com/market-reports/fast-food-market
[5]. Klein, R. (2016). Fast-Food Restaurant Industry: A Cleveland Perspective 1930-2016. https://engagedscholarship.csuohio.edu/cgi/viewcontent.cgi?article=1001&context=msl_ae_ebooks
[6]. Zhang Yuming. (2021). Research on the Communication Strategies of Catering Brands in the Digital Economy Era (Master’s thesis, Capital University of Economics and Business).
[7]. Lu, Y. (2022). Implications of Shake Shack's localization strategy for the development of Chinese catering enterprises. Capital University of Economics and Business.
[8]. Zhou Lixi. (2023). High-end Burgers in Demand: Achieving Long-term Success is Not Easy. China Food (01), 62-64. doi:CNKI:SUN.0.2023-01-009.
[9]. Elliott, P., & Reed, R. (1999). The valuation of fast-food outlets: analysis, methodology, and reliability. Appraisal Journal, 67, 359-369.
[10]. Kuusimaa, V. (2017). Fast food should look good: Scanburger’s new corporate visual identity. https://www.theseus.fi/bitstream/handle/10024/141867/Kuusimaa_Ville.pdf?sequence=8&isAllowed=y
[11]. Jiang Xin. (2022). An Analysis of the RMB Exchange Rate Trend Based on the Big Mac Index Perspective. In Financial and Economic Observations (2021 Issue 2) (pp. 16-23).
[12]. Yao, Z. (2023, August). Chinese Yuan central parity rate. State Administration of Foreign Exchange of China. http://www.safe.gov.cn/AppStructured/hlw/RMBQuery.do?COLLCC=170255276
[13]. The Economist. (2023). Big Mac data and methodology [GitHub repository]. https://github.com/TheEconomist/big-mac-data
[14]. Long Forecast. (2024). Dollar to yuan forecast 2024, 2025, 2026 - 2028 - Long Forecast. https://longforecast.com/chinese-yuan-forecast-2017-2018-2019-2020-2021-usd-to-rmb-and-rmb-to-usd