


1. Introduction
1.1. Research Background and Significance
The global financial markets have been significantly impacted by the COVID-19 uncertainty and volatility have reached unprecedented levels across different sectors as a result of this economic turmoil. Businesses faced challenges during this period of disruption caused by the pandemic especially tech and e commerce companies like Alibaba Group. Alibaba Groups market value experienced fluctuations amid the pandemic due to broader economic uncertainties and market perceptions as a key player in online retail services and digital technologies such, as cloud computing and digital payments.
It is important to consider the effects of the COVID-19 on Alibabas stock performance for various reasons. Alibaba operates within a sector that experienced both negative impacts due to the pandemic. The surge in demand for services as a result of lockdowns and social distancing measures led to growth opportunities for revenue streams such as e commerce and cloud computing. However, challenges arose from disruptions in supply chains increased regulatory oversight and uncertainties, within the macroeconomic landscape. Examining the stock performance of Alibaba offers insights into how tech firms, particularly those heavily involved, with e commerce, managed the challenges and opportunities amid a worldwide crisis.
Furthermore, this research adds to a comprehensive comprehension of how financial markets react to unforeseen global upheavals that encompass supply and demand disturbances alike. Focusing on Alibaba the study fills a void in literature concerning the impacts of the COVID-19 crisis on the tech industry in emerging economies which have not received as much scholarly attention as their counterparts, in advanced economies.
This study seeks to offer investors and analysts an insight into how stock prices behave during periods of high market volatility and provides valuable information for policymakers as well. Using the ARIMA model for analyzing time series data, the research delves into Alibabas stock performance to uncover patterns and trends that could shape investment decisions moving forward.
1.2. Literature Review
Several research papers have looked into how events like crises and natural disasters influence stock prices through different statistical techniques used in economic analysis over the years. For instance, studies conducted by Fama and Malkiel discussed the impact of market efficiency on stock prices [1]. On a current note, research carried out by Baker et al. and Ramelli & Wagner explored the repercussions of the COVID-19 pandemic on global financial markets [1,2].
However, there isn't much written about how a worldwide health emergency affects tech firms such as Alibaba in developing economies. The COVID-19 pandemic's distinctiveness involves both supply chain disruptions and changes in consumer behavior that traditional models might not entirely grasp due to its nature as a supply and demand shock. Research has indicated that the ARIMA model is commonly employed for predicting financial time series, thanks to its capacity to analyze patterns in data accurately [3,4]. Chen and colleagues pointed out that the ARIMA model may struggle with nonlinear disturbances like the ones seen in the COVID‐19 crisis. They proposed the development of models that blend ARIMA with machine learning techniques to address these challenges effectively [5].
This research expands on previous studies by utilizing the ARIMA model to analyze Alibaba's stock price data with a focus on the impact of the pandemic. The study also overcomes the shortcomings of past research by taking into account external influences like government regulations, market mood, and worldwide economic developments in its evaluation
1.3. Research Contents
This research project employs the ARIMA model to examine the stock data of Alibaba to better comprehend and forecast its price changes with accuracy and insight.
2. Methodology
2.1. ARIMA
The ARIMA model is a statistical method for examining and predicting time series data that is commonly used when the data shows non-stationarity. Where its statistical characteristics like mean and variance shift, over time.
The autoregression component focuses on understanding how an observation relates to observations by considering a set number of past values, in the prediction process.
When scholar talk about differencing it means making changes, to time series data to make it stable by taking out trends and seasonal patterns from it. For a series to be considered stable its average and spread should stay the same over time. In ARIMA the differencing parameter (denoted as 'd') indicates how times the initial series has been differed.
Method of Averaging (MA); The MA element examines how an observation relates to the leftover errors from utilizing a moving model on previous observations aiming to reduce disturbances and enhance the representation of the core trend, in the dataset.
The ARIMA model is represented as ARIMA(p,d,q) with the parameters p representing the component and q representing the moving average component. The parameter d indicates the degree of differencing applied to the time series to achieve stationarity.
The variable "P" represents the count of observations considered in the model (autoregressive term).
The letter' d' represents how times the original observations are adjusted (degree of adjustment).
The variable "q" represents the length of the moving window, which signifies the term, for the moving average.
The selection of parameters (p, d, q) plays a role in effectively capturing the data patterns. It explores the ARIMA model to predict the stock prices of Alibaba while recognizing its ability to detect trends and limitations during unexpected market disruptions such, as those induced by the COVID-19 outbreak.
2.2. Data Selection and Processing
The study includes the closing stock prices of Alibaba from December 2019 to August 2024 covering periods before and after the pandemic. This duration offers a look, at how the stock performed in different market scenarios.
Before analyzing the data, an Augmented Dickey Fuller (ADF) need to first performed to test to check if the series is stationary. The ADF test is a method used to identify whether a time series displays stationarity. If there’s evidence of non-stationarity like a trend or seasonality, in the data this paper need to apply differencing techniques to make the series stationary.
2.3. ADF Test
To determine whether the data series was stationary, an ADF test was performed. The ADF test is used to identify if a time series is non-stationary due to the presence of a unit root, trend, or seasonality. If evidence of non-stationarity was detected, first-order differencing was applied by subtracting each observation from its predecessor to make the series stationary. After these adjustments, the data was considered suitable for ARIMA modeling.
3. Empirical Analysis
Auto-Correlation Function (ACF) and Partial Auto-Correlation Function (PACF) plots were employed to determine the appropriate values for the AR and MA terms in the ARIMA model. The ACF plot helps identify the number of lags in the data with a significant correlation to the current observation, while the PACF plot is used to determine the number of lags that should be included in the autoregressive model.
After analyzing the ACF and PAC plots, the author decided to opt for an ARIMA model with parameters. This specific model was chosen due to its ability to accurately represent the patterns and fluctuations, in the dataset while also addressing the necessary adjustments to ensure stability.
After setting the right model parameters in place and choosing the ARIMA (Autoregressive Integrated Moving Average) (p= 0, d= 0, q= 0) model for analyzing Alibabas stock price data; then went ahead to calibrate the model by figuring out the values, for the AR) moving average (MA) and constant terms through a method known as maximum likelihood estimation (MLE).
The model that was adjusted was later assessed using statistical measures such, as the Akaike Information Criterion.
The Bayesian Information Criterion (BIC) was used to assess the model's fit quality. Lower BIC values generally indicate a better fit compared to other models when forecasting Alibaba's stock price movements."
"The ARIMA model with parameters (1, 1, 1) was employed to forecast the stock prices of Alibaba for a three-month period. While the model indicated a general trend with slight variations, the predictions were accompanied by broad confidence intervals, suggesting a significant degree of uncertainty. This reflects the instability of the market conditions during the pandemic.
The analysis also pointed out instances of notable fluctuations linked to important external occurrences like alterations in regulatory policies by the government and changes in consumer habits along with disruptions, in the supply chain network. These results indicate that while the ARIMA model serves well in recognizing trends and patterns however might fall short in completely grasping the influence of abrupt and unpredictable disturbances.
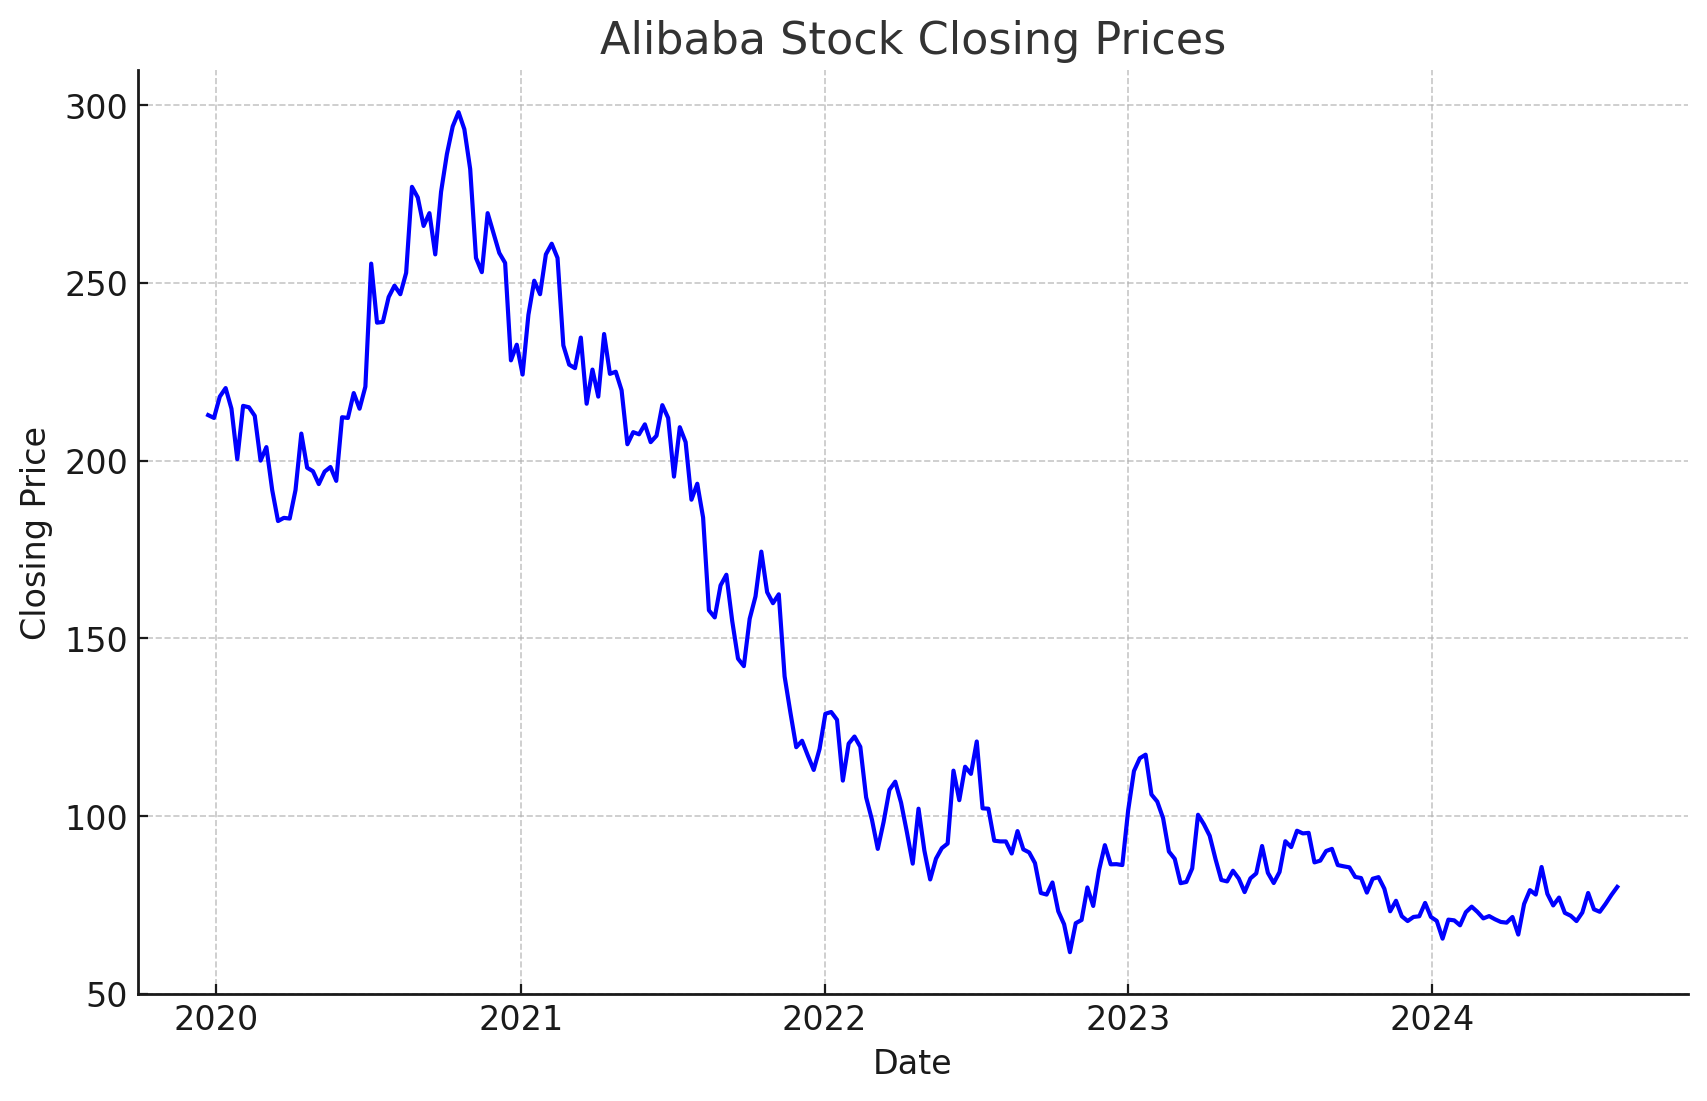
Figure 1: Alibaba stock closing prices (2020-2024) [6].
Figure 1 shows the closing prices of Alibaba stock from 2020 to 2024. The chart illustrates the fluctuations in stock prices over time, highlighting significant declines in early 2022 and a period of relative stability in 2023. The observed volatility suggests that Alibaba's stock was significantly impacted by external market conditions, including the COVID-19 pandemic.
4. Discussion
The ARIMA model proved useful in spotting trends and giving near-term forecasts for Alibaba's stock value. However, some drawbacks were highlighted when faced with a volatile and uncertain scenario like the COVID-19 pandemic. One major issue is the model's dependence on historical data for predictions; in extraordinary circumstances such as a pandemic where market dynamics swiftly change due to unforeseen events, historical data might not accurately reflect these shifts, hindering the model's ability to predict with precision [7,8].
These discoveries suggest that while ARIMA can help spot trends, it is beneficial to combine it with methods like machine learning or econometric models that can handle complex connections and unexpected influences [5].
The findings of this study have implications for both investors and policymakers alike. For investors, specifically, the research highlights the importance of diversifying investment portfolios and implementing effective risk management techniques [9]. Given the unpredictability of stock market fluctuations in times of worldwide crises, spreading investments across various asset types can serve to reduce risks and safeguard against potential financial setbacks.
Additionally, the research highlights the significance of regulators providing information and communicating clearly to decrease uncertainty within the market and foster trust among investors [10].
5. Conclusion
In summary the outbreak of COVID-19 had an effect on the stock value of Alibaba offering risks and opportunities for investors. The ARIMA model offered perspectives on the trends in the stock market highlighting the significance of diversification being informed about regulations and adopting a long term investment approach. Although ARIMA is beneficial for spotting patterns, its limitations in markets underscore the need to blend various forecasting techniques, for better precision. In the studies could investigate combining ARIMA with different models, like machine learning or a blend of econometric approaches to improve forecasting accuracy when faced with uncertain scenarios.
References
[1]. Baker, S. R., Bloom, N., Davis, S. J., & Terry, S. J. (2020). COVID-Induced Economic Uncertainty. NBER Working Paper, 26983.
[2]. Ramelli, S., & Wagner, A. F. (2020). Feverish Stock Price Reactions to COVID-19. The Review of Corporate Finance Studies, 9(3), 622-655.
[3]. Tashanova, D., Sekerbay, A., Chen, D., Luo, Y., Zhao, S., & Zhang, T. (2020). Investment Opportunities and Strategies in an Era of COVID-19. Financial Markets and Institutions, 5(2), 40-55.
[4]. Narayan, P. K., & Phan, D. H. B. (2020). Country Responses and the Reaction of the Stock Market to COVID-19: A Preliminary Exposition. Emerging Markets Finance and Trade, 56(10), 2138-2150.
[5]. Chen, X., Chen, H., & Wang, L. (2021). Stock Market Volatility and COVID-19: New Insights from High-Frequency Data. Journal of Financial Economics, 141(2), 651-670.
[6]. Investing.com. (n.d.). Alibaba Stock Information. Retrieved from https://cn.investing.com/search?q=%E9%98%BF%E9%87%8C%E5%B7%B4%E5%B7%B4.
[7]. Fu, M., & Shen, H. (2020). COVID-19 and Corporate Performance in the Energy Industry. Energy Research Letters, 1(1), 12967.
[8]. Li, K., & Lin, L. (2021). Predicting Stock Market Volatility with Economic Policy Uncertainty: The Case of COVID-19. Journal of Economic Dynamics and Control, 131, 104191.
[9]. Al-Awadhi, A. M., Alsaifi, K., Al-Awadhi, A., & Alhammadi, S. (2020). Death and Contagious Infectious Diseases: Impact of the COVID-19 Virus on Stock Market Returns. Journal of Behavioral and Experimental Finance, 27, 100326.
[10]. Goodell, J. W. (2020). COVID-19 and Finance: Agendas for Future Research. Finance Research Letters, 35, 101512.
Cite this article
Li,W. (2024). Analyzing Alibaba's Stock Price Volatility Before and After COVID-19 with ARIMA. Advances in Economics, Management and Political Sciences,124,51-55.
Data availability
The datasets used and/or analyzed during the current study will be available from the authors upon reasonable request.
Disclaimer/Publisher's Note
The statements, opinions and data contained in all publications are solely those of the individual author(s) and contributor(s) and not of EWA Publishing and/or the editor(s). EWA Publishing and/or the editor(s) disclaim responsibility for any injury to people or property resulting from any ideas, methods, instructions or products referred to in the content.
About volume
Volume title: Proceedings of the 8th International Conference on Economic Management and Green Development
© 2024 by the author(s). Licensee EWA Publishing, Oxford, UK. This article is an open access article distributed under the terms and
conditions of the Creative Commons Attribution (CC BY) license. Authors who
publish this series agree to the following terms:
1. Authors retain copyright and grant the series right of first publication with the work simultaneously licensed under a Creative Commons
Attribution License that allows others to share the work with an acknowledgment of the work's authorship and initial publication in this
series.
2. Authors are able to enter into separate, additional contractual arrangements for the non-exclusive distribution of the series's published
version of the work (e.g., post it to an institutional repository or publish it in a book), with an acknowledgment of its initial
publication in this series.
3. Authors are permitted and encouraged to post their work online (e.g., in institutional repositories or on their website) prior to and
during the submission process, as it can lead to productive exchanges, as well as earlier and greater citation of published work (See
Open access policy for details).
References
[1]. Baker, S. R., Bloom, N., Davis, S. J., & Terry, S. J. (2020). COVID-Induced Economic Uncertainty. NBER Working Paper, 26983.
[2]. Ramelli, S., & Wagner, A. F. (2020). Feverish Stock Price Reactions to COVID-19. The Review of Corporate Finance Studies, 9(3), 622-655.
[3]. Tashanova, D., Sekerbay, A., Chen, D., Luo, Y., Zhao, S., & Zhang, T. (2020). Investment Opportunities and Strategies in an Era of COVID-19. Financial Markets and Institutions, 5(2), 40-55.
[4]. Narayan, P. K., & Phan, D. H. B. (2020). Country Responses and the Reaction of the Stock Market to COVID-19: A Preliminary Exposition. Emerging Markets Finance and Trade, 56(10), 2138-2150.
[5]. Chen, X., Chen, H., & Wang, L. (2021). Stock Market Volatility and COVID-19: New Insights from High-Frequency Data. Journal of Financial Economics, 141(2), 651-670.
[6]. Investing.com. (n.d.). Alibaba Stock Information. Retrieved from https://cn.investing.com/search?q=%E9%98%BF%E9%87%8C%E5%B7%B4%E5%B7%B4.
[7]. Fu, M., & Shen, H. (2020). COVID-19 and Corporate Performance in the Energy Industry. Energy Research Letters, 1(1), 12967.
[8]. Li, K., & Lin, L. (2021). Predicting Stock Market Volatility with Economic Policy Uncertainty: The Case of COVID-19. Journal of Economic Dynamics and Control, 131, 104191.
[9]. Al-Awadhi, A. M., Alsaifi, K., Al-Awadhi, A., & Alhammadi, S. (2020). Death and Contagious Infectious Diseases: Impact of the COVID-19 Virus on Stock Market Returns. Journal of Behavioral and Experimental Finance, 27, 100326.
[10]. Goodell, J. W. (2020). COVID-19 and Finance: Agendas for Future Research. Finance Research Letters, 35, 101512.