


1. Introduction
In recent years, China's fund market has developed rapidly. With the development of China's capital market and the increase in residents' wealth, the overall size of the fund market has grown significantly. According to data from the Asset Management Association of China, as of the end of 2023, the scale of public fund management has exceeded 20 trillion yuan. In addition, the development of financial technology has brought new opportunities to fund management, including the application of big data analysis, artificial intelligence and machine learning. These technologies improve the efficiency and transparency of fund management, while also helping fund managers make better decisions in the market. In general, China's fund market is experiencing rapid growth, diversified development, technological empowerment and globalization trends.
After segmenting the fund market, we will find that not all types of funds have such a good development trend. In China's market, compared with passive funds, the performance of actively managed funds is barely satisfactory, and the market share and weight do show a downward trend to a certain extent. There are many reasons for this phenomenon. First of all, passively managed funds usually have lower management fees and transaction costs than actively managed funds. This cost advantage undoubtedly constitutes a strong attraction for investors. Secondly, the volatility of financial markets has increased in recent years, and risk-averse investors have transferred more funds to less volatile assets. Furthermore, the market competition for actively managed funds has become increasingly fierce, and excellent fund managers and strategies have become scarcer. Finally, as regulatory agencies increase fund disclosure requirements, active fund managers need to assume more responsibilities. Therefore, actively managed funds are in turmoil in the current market environment, and their development prospects are not optimistic.
On the other hand, whether the fund's performance is sustainable is also a question that has been discussed in academic circles. Researches by many scholars have shown that funds with good performance have a "hot hand effect" [1,2,3]. This kind of excellent performance can only be maintained in a short period of time. In the long run, there will be a performance reversal [4,5,6,7]. [8] shows that past returns are no guarantee of future returns. In addition, some China's studies have shown that there is a "tournament effect" in the China's market [9,10]. Fund managers will change their competitiveness and risk appetite based on their ranking performance in the previous period. [11] pointed out that because fund managers are concerned about future career development and reputation, growth funds that perform poorly in the first half of the year are more likely to show higher portfolio return fluctuations. According to the theories of these scholars, adjustments to fund managers' risk preferences will directly affect fund performance. However, there is no unified answer to the direction of the impact, and some studies only mention the impact without giving a clear direction of change. Therefore, the continuation or reversal of fund performance in the next period cannot be clearly predicted.
Some scholars believe that the performance of China's funds is sustainable, but the conditions are very strict and are limited to early China's closed funds [12,13].
In order to provide some help for China's active management funds to get out of the predicament, this paper selects China's active management funds as the research target. Besides, in order to solve the problems of poor fund performance sustainability and difficulty in prediction, and in order to increase the accuracy of prediction and adapt to more responsible data models, this paper uses machine learning methods to predict the performance of fund. This paper proposes a dynamic rolling algorithm based on machine learning, which aims to select excellent funds from actively managed funds to form an investment portfolio and track their performance over the next period of time, hoping to build an effective investment portfolio. Specifically, this paper uses the data of China's actively managed funds from 2015 to 2024, according to the fund in the past 12 months of performance training model, using the features of the next 1 month data to predict performance, and forms five groups of each fund with equal weight based on the predicted performance, and then calculate the portfolio's return over the next month. This paper selects the sample backward for one month to build a new five investment portfolios and track their returns for the next month. Through this method, this paper constructs time series data for each group.
This paper differs from the existing literature in three dimensions. First, this paper uses the 23 actively managed fund’s features to predict the performance, which can explain their complex nature. Fund performance is determined by a series of different features, including the fund manager's multi-faceted capabilities, portfolio size, the volatility of fund performance, fund transaction costs and fees. Therefore, it seems unlikely that using a single or small number of features, such as an ARMA model, to predict performance will be as effective as adopting a large number of features.
Second, most studies adopt linear regression models based on their interpretability[14], often ignoring the potential of machine learning methods. And machine learning models can identify not only skilled managers, but also those whose skills are not fully offset by diseconomies of scale [15]. This paper uses five machine learning methods to predict fund performance: Elastic Net, Decision Tree, Random Forest, Ridge Regression and Lasso Regression, making a horizontal comparison. These methods have better performance and prediction accuracy than traditional linear regression models, and can handle more complex nonlinear relationships.
Third, due to the particularity of China's fund market, the types and years of establishment of funds are subject to certain restrictions, and they are far less mature and complete than foreign fund markets. Therefore, existing research on the China's fund market is relatively scarce, and it is unknown whether mature foreign research methods are applicable to the China's market. The information set used in this paper is the data of China's actively managed funds from 2015 to 2024, which complements the gaps in the research in this area.
The main research results of this paper are divided into several aspects. First, this study uses 23 features combined with the OLS method and five machine learning techniques to make a rolling forecast of fund returns. Funds are grouped by the predicted values and calculating the actual performance of each group. Specifically, the order of cumulative returns of funds grouped according to predicted values is consistent with the actual performance. The group with high predicted values also has the highest actual cumulative returns, and vice versa. In addition, the analysis also found that in the China's fund market, funds in the low-yield group are often accompanied by higher maximum drawdown rates, while funds in the high-yield group have lower maximum drawdown rates.
Secondly, both the five machine learning methods and the OLS method have demonstrated high accuracy in predicting fund returns. This fully demonstrates that the feature set selected in this paper provides effective information input to the model, giving it good predictive capabilities.
Furthermore, comparing the prediction performance and accuracy of different methods, Ridge Regression is superior in performance and accuracy. In addition, the accuracy of OLS methods is generally lower than that of machine learning methods.
Finally, this study also calculated the Rank IC values and ICIR values of 23 features to evaluate their predictive capabilities. The analysis results show that, except for the fund manager's working time and the volatility of capital flows, the other features have shown good prediction effects. Among them, Sharpe ratio, capital flows, stock selection ability, return volatility, and excess return and its t-statistic obtained through FF5 regression show strong predictive ability and stability.
2. Literature review
2.1. Machine Learning Model
Many scholars have previously studied features that help make investment decisions[16], but none of them used predictive models. These studies used regression analysis and found statistically significant relationships, but they did not provide information on relevant performance measures in the validation of the predictions. Some scholars have made certain predictions, but simply using linear regression models [14] cannot effectively capture the complexity of the relationship between fund features and performance.
In recent years, the use of machine learning for base selection research has become an emerging research hotspot. Machine learning methods have been proven by many scholars to be superior to traditional prediction task models[17,18], and more and more literature has begun to use machine learning models to study problems. [19] found that a variety of machine learning models can effectively mine the effective information contained in the basic features of funds.[20]used a variety of deep learning models to achieve effective prediction of fund returns based on the historical net value of the fund. [21] use logistic regression as a baseline model to predict the flows generated by each mutual fund and various machine learning tools. Research by [15] shows that using machine learning methods can capture nonlinearities and interactions in the relationship between fund features and performance, which can help construct tradable mutual fund portfolios. Independent studies by[22,15] combine mutual fund performance with machine learning techniques. The study by [23] uses machine learning methods to predict fund returns or abnormal returns.
2.2. Fund Feature
Fund features that affect fund performance are mainly divided into three aspects. First, when selecting a fund investment portfolio, fund fees are an important feature that directly affects investors’ actual returns. A reasonable fee structure can reduce investment costs and improve long-term returns. The seminal paper of [24] shows that a large proportion of fund managers perform better before fees than after fees, while [25] reach the opposite conclusion. Research by [26] shows that mutual fund fees are an important reference feature for investors.[27] showed that excessive fund fees will inhibit investors’ subscription behavior. Research by [28] shows that mutual funds with high fees perform relatively poorly in expense management. Studies by many scholars have shown that there is a clear negative correlation between fund fees and performance [29,30,31].
Second, capital flows reflect market investors’ confidence in the fund. Healthy capital flows can ensure that funds have sufficient flexibility in the face of market fluctuations, and also help fund managers better implement investment strategies. The predictive effect of capital flows on fund performance was first discovered by [32,33], who found a positive, but rather short-lived and weak relationship. [34] shows that the expected portion of liquidity-inducing trades is positive mutual fund returns in the second year. [35] found that fund flows associated with positive return features lead to negative future fund performance. [36] machine learning approach restored the predictive role of financial flows and showed that financial flows positively predict performance. Several studies have focused on the relationship between labeling a fund as sustainable and the financial flows it receives [37,38].
Third, the fund manager’s stock selection and timing abilities are also very important. Excellent fund managers can select individual stocks with potential and seize the best opportunities for market fluctuations to trade, thereby creating excess returns.[27] found that compared with funds with relatively stable investment risks, funds with increased investment risks have worse future performance, which may be due to principal-agent problems or poor stock selection and timing abilities of fund managers. [39] find that a small group of managers demonstrate a greater ability to consistently achieve excess returns through strategies that switch between recessionary market timing and expansionary stock picking. [40] found that the improvement of ordinary investors' stock selection and timing abilities improved their investment returns. [41] showed that the fund’s alpha return will increase as the fund manager’s stock selection ability improves.
In addition, many scholars have studied the impact of other fund features on fund performance. For example, risk aversion [42], group behavior [43], investment style [44], fund manager compensation [45], stock return dynamics [46], volatility [42], fund size [47], news and sentiment environment related to social networks [48], environment, society and governance ( ESG) [49].
Taking into account all the above features, which are screened and supplemented by this paper, actively managed fund performance was led as a function of 23 features model, including: turnover rate, management fee, fund size, fund establishment time, fund net assets, return volatility, Sharpe ratio , stock selection ability, timing ability, number of stocks held, maximum drawdown, downward standard deviation, fund manager's working time, capital flow, capital flow volatility, and the constant items, determination coefficients and inclusion constants obtained from the Fama French 5 factors regression function of the term and the t-statistic of the five features.
3. Research Design
3.1. Sample Data
This paper studies actively managed funds in the China's market. The sample funds include ordinary stock funds and partial stock hybrid funds. The sample period is from January 2015 to April 2024, and the data frequency is daily. The calculation of some features in this paper requires the use of data from the past year. Therefore, the fund data and feature data used for training in this paper start in January 2016.
This paper applies some filters that are common in the fund literature. First, the research object of this paper mainly includes the stock classes of actively managed funds, so it does not include ETFs and index funds. Secondly, for funds that have been established for less than 12 months, their internal capital flows and changes in net worth fluctuate greatly, which may have a greater impact on the accuracy of the forecast, and the corresponding results cannot be calculated because the time is less than 12 months, thus removing them from the data sample. Furthermore, this paper eliminates samples with missing data, mainly for two reasons. First, to ensure the accuracy and reliability of prediction and analysis. Second, to fit the needs of machine learning methods. The machine learning model used in this paper must eliminate all missing values. The final sample of this paper includes 585 actively managed funds, with a total of 406,091 samples. The feature data in this paper come from Wind and CSMAR databases.
3.2. Features of actively managed funds
For the daily data of each fund category, this paper obtains the closing price of post-rights and calculates the corresponding rate of return. In order to make the fund features more comprehensive and the prediction results more reliable, this paper constructed a data set containing the 23 features of fund from four aspects: fund operations, fund performance, fund manager capabilities, and feature regression statistics. At the fund operation level, this paper includes the features of management fees, fund size, number of shares held, and fund establishment time; at the fund performance level, this paper includes turnover rate, return volatility, Sharpe ratio, maximum drawdown, features such as downward standard deviation, capital flow and capital flow volatility; at the level of fund manager capabilities, this paper includes four features such as stock selection ability, timing ability and fund manager working time; in terms of feature regression and statistics, this paper includes the coefficient of determination, excess return (intercept term) and six t statistics including the intercept term and five features after Fama French 5 factors regression.
Among them, this paper uses the number of days since the fund was established and the number of days the fund manager has been working as the length of fund establishment and the working time of the fund manager.
In addition, this paper draws on the method of [15] and uses the relative growth of TNA adjusted for fee returns to construct daily capital flows:
\( {Flow_{i,t}}=\frac{{TNA_{i,t}}-{TNA_{i,t-1}}(1+{r_{i,t}})}{{TNA_{i,t-1}}} \) (1)
Among them, i is the i-th fund, t is the t-th day, and TNA is the total net assets of the fund. After obtaining the daily data of fund flow, this paper calculates the volatility of fund flow.
The timing ability and stock selection ability of this paper are derived based on the secondary market excess return model:
\( {R_{i,t}}-R{f_{t}}=α+β(R{m_{t}}-R{f_{t}})+γ(R{m_{t}}-R{f_{t}}{)^{2}}+{ε_{i,t}} \) (2)
Among them, i is the ith fund, t is the tth day, R represents the fund's rate of return, Rf is the risk-free rate of return, and Rm is the rate of return of the market index. For the ith fund on the mth day in the sample, this paper uses the data of the past year (252 days) to perform a "rolling window" regression. The timing ability is the \( γ \) calculated based on the secondary market excess return model, and the stock selection ability is the \( α \) calculated based on the secondary market excess return model.
The feature regression and statistical features of this paper are based on the Fama French 5 factors model:
\( {R_{i,t}}-R{f_{t}}=α+{b_{i}}(R{m_{t}}-R{f_{t}})+{s_{i}}SM{B_{t}}+{h_{i}}HM{L_{t}}+{r_{i}}RM{W_{t}}+{c_{i}}CM{A_{t}}+{ε_{i,t}} \) (3)
Among them, i is the i-th fund, t is the t-th day, SMB is the market value feature, HML is the book-to-market feature, RMW is the profit level feature, and CMA is the investment level feature. For the i-th fund on the t-th day in the sample, this paper uses the FF5 features of the past year (252 days) for a "rolling window" regression and calculates the constant term and the t-statistic containing the constant term and the five features. This paper refers to the method of [50] and uses the t-statistic instead of beta as a predictor. In addition, [51] proposed that R2 is an indicator to measure the activeness of the fund, so this paper incorporates the R2 of the FF5 rolling window regression into the predictor of fund performance. The data of the five features are all from the CSMAR database.
The specific features and their definitions are shown in Table 1, and the descriptive statistics of the yield and each feature are shown in Table 2.
Table 1: Fund features and their definitions.
Feature | Definition |
Age | Fund establishment age, as mentioned above |
TOR | Turnover rate, frequency of stock trading in the market |
ER | Management fee rate, ratio of fund expenses to fund net assets |
Size | Fund size, total assets of the fund |
TNA | Total net assets of the fund |
R_Var | Return volatility, variance of return |
SP | Sharpe ratio,ratio of the excess return and volatility |
Select | Selection ability, as mentioned above |
Timing | Timing ability,as mentioned above |
OCV | Number of shares held by the fund |
MDD | Maximum drawdown, ratio of the difference between the peak value and the trough value to the peak value |
D_VOl | Downward standard deviation, volatility when the market is down |
Experience | Manager's working time, as mentioned above |
Flow | Fund flow, as mentioned above |
Flow_VOL | Fund flow volatility |
RSquare | Fama French 5-factor model determination coefficient |
Alpha | The fund excess return in the Fama French 5-factor model |
Alpha_T | The t-statistic of the excess return in the Fama French 5-factor model |
MKT_T | The t-statistic of the market factor return in the French 5-factor model |
SMB_T | The t-statistic of the size factor return in the Fama French 5-factor model |
HML_T | The t-statistic of the value factor return in the Fama French 5-factor model |
RMW_T | The t-statistic of the profitability factor return in the Fama French 5-factor model |
CMA_T | The t-statistic of the investment factor return in the Fama French 5-factor model |
3.3. Feature Description
First, the fund features and fund return data used in this paper are all calculated on a daily basis. Some fund feature financial data are updated quarterly or semi-annually, and are filled in as daily frequency data based on the corresponding periodic report disclosure date.
Second, like [27], we standardize each feature so that its cross-sectional mean is zero and its standard deviation is 1. This helps to highlight the essential features of the data and improve the accuracy and stability of the model prediction. Third, as mentioned above, this paper studies the features of the stocks held by mutual funds to predict the returns of mutual funds, and uses the return of active funds for one month (20 days) after one year of rolling training (252 days) as the target variable, and finally integrates them into one data set.
Table 2: Descriptive Statistics.
Variable | Observations | Mean | Variance | Median | Min | Max |
R | 406,091 | 0.0001 | 0.0002 | 0.0000 | -0.1445 | 0.1999 |
Age | 406,091 | 0.2381 | 0.9088 | -0.0291 | -1.2871 | 2.7707 |
TOR | 406,091 | -0.1202 | 0.6481 | -0.3721 | -0.8155 | 21.7967 |
ER | 406,091 | 0.0450 | 1.0496 | -0.3478 | -1.7774 | 2.9981 |
Size | 406,091 | 0.0447 | 1.1510 | -0.3037 | -0.4834 | 10.2197 |
TNA | 406,091 | -0.0371 | 0.9193 | -0.2511 | -0.4831 | 16.5948 |
R_Var | 406,091 | -0.0501 | 0.7909 | -0.2936 | -1.3601 | 7.9677 |
SP | 406,091 | -0.0049 | 0.9232 | 0.0055 | -8.9694 | 8.3269 |
Select | 406,091 | 0.0012 | 0.9915 | -0.0814 | -4.8276 | 5.2824 |
Timing | 406,091 | -0.0075 | 0.9864 | 0.0070 | -6.3928 | 6.2308 |
OCV | 406,091 | 0.0060 | 1.0157 | -0.3809 | -0.8888 | 7.2636 |
MDD | 406,091 | -0.0595 | 0.8910 | -0.1076 | -2.9466 | 4.2274 |
D_VOl | 406,091 | 0.0089 | 0.9531 | -0.0057 | -5.4303 | 3.4473 |
Experience | 406,091 | 0.0189 | 0.9757 | 0.0165 | -1.9464 | 3.1884 |
Flow | 406,091 | 0.0034 | 0.8735 | 0.0122 | -20.6550 | 23.4390 |
Flow_VOL | 406,091 | 0.0009 | 0.9895 | -0.0822 | -0.3967 | 23.5441 |
RSquare | 406,091 | 0.0060 | 1.0250 | -0.1674 | -1.8492 | 17.3868 |
Alpha | 406,091 | -0.0021 | 0.9869 | -0.1130 | -3.7982 | 5.5103 |
Alpha_T | 406,091 | 0.0063 | 0.9791 | 0.0888 | -13.2954 | 2.6618 |
MKT_T | 406,091 | 0.0104 | 1.0037 | -0.0087 | -4.7681 | 13.8988 |
SMB_T | 406,091 | -0.0072 | 0.9995 | -0.0027 | -3.9602 | 4.4963 |
HML_T | 406,091 | -0.0027 | 1.0063 | 0.0157 | -5.3074 | 4.1623 |
RMW_T | 406,091 | 0.0088 | 0.9850 | -0.0008 | -4.0436 | 8.2443 |
CMA_T | 406,091 | -0.0009 | 1.0043 | 0.0034 | -4.7490 | 3.9452 |
3.4. Model Parameter Setting
Except for the OLS method, the other five machine learning methods all require parameter setting. Bayesian optimization can handle complex objective functions such as multi-peak and non-convex, and can intelligently select the next evaluation point based on historical observations, and find parameter configurations close to the optimal solution within a small number of iterations. Therefore, this paper uses Bayesian optimization to find the optimal parameters of the machine learning model.
4. Performance of machine learning portfolios
4.1. Performance evaluation
This paper uses fund features from the past 12 months (2016-2017) to train each machine learning method and OLS. Then, this paper predicts the fund performance in January 2017 based on these features and training models. This paper divides the funds into five groups based on the predicted performance in early January 2017, forms an equally weighted fund portfolio for each group, and tracks its actual performance data since January 2017. If a fund belonging to the portfolio disappears from the sample during this period, the amount invested in the fund will be evenly distributed to the remaining funds of the fund. Each time a prediction is made, this paper rolls the training sample back one month, trains the algorithm again on the new sample, makes a new prediction for the next month, constructs a new fund portfolio of five groups, and tracks its returns for the next month. This process is repeated until the sample ends (May 2024), and the daily data of the time series data of each group is finally obtained.
This paper regards each group as an investment portfolio, assigns equal weights to the funds in each group, calculates the daily average return of this group, and multiplies the daily average return of each month to finally obtain the cumulative return time series data of each month for the five combinations.
(a) (b)
(c) (d)
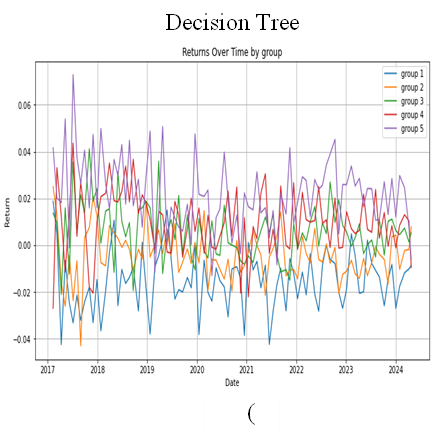
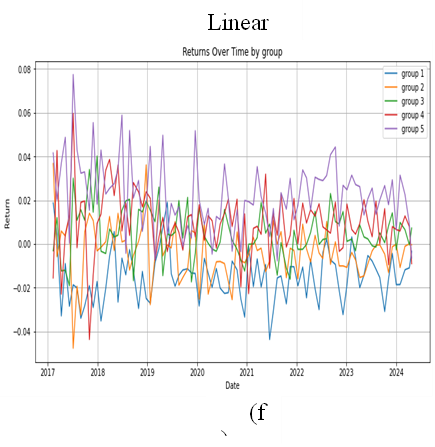
(d) (f)
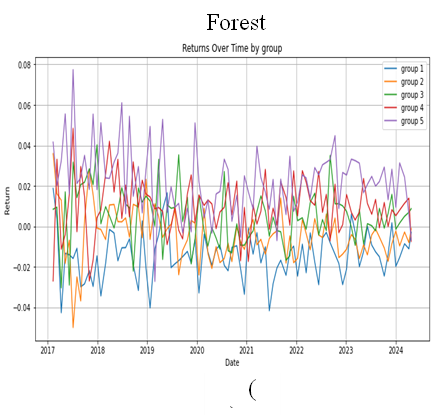
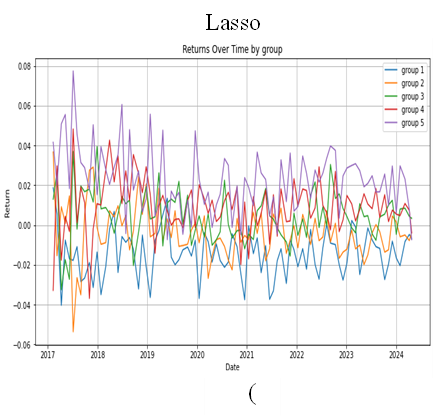
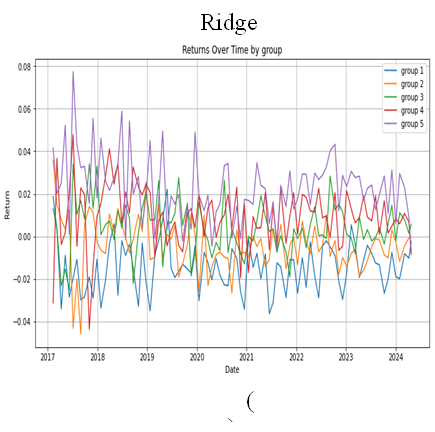
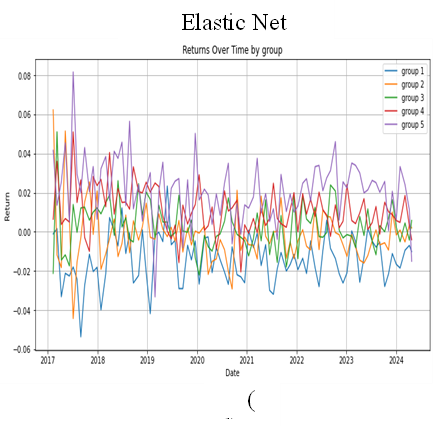
Figure 1: Time Series Chart of Cumulative Return
(a)-(g) in Figure 1 are the monthly cumulative return time series images obtained by OLS and machine learning methods. From the images of each prediction method, it can be seen that the larger group is, closer to the top, that is, the image of the first group is at the bottom, and the image of the fifth group is at the top. From the perspective of the return rate alone, the grouping using the prediction method of this paper can fit the real data well and is an effective strategy for constructing an investment portfolio. In order to make the results more reliable and rigorous, this paper incorporates four indicators: average annualized Sharpe ratio, average annualized information ratio, average annualized volatility, and average annualized maximum drawdown for a more comprehensive analysis.
Panel A in Table 3 gives the results of the Sharpe ratios of the six prediction methods. The average annual Sharpe ratio difference of the two extreme investment portfolios grouped by predicted returns over the eight-year period ranges from 3.70 to 4.01. The Sharpe ratio in each prediction model increases with the group, especially the Sharpe ratio of the fifth group is above 2, indicating that the investment portfolio can obtain higher excess returns when taking unit risk. In addition, this paper adopts the strategy of dividing the five groups equally according to quantiles and the sample size is large enough to exclude contingency to a certain extent. Panel B gives the results of the information ratios of the eight prediction methods. Consistent with the Sharpe ratio, the information ratio also increases with the group. The information ratio of the fifth group is positive, indicating that the best investment portfolio constructed by the method of this paper is better than the sustained performance of the market, and the values are all above 1.2, indicating that the performance of the active portfolio in this risk portfolio has stable returns. Panel C gives the results of return volatility. It can be seen that volatility does not show a trend of increasing or decreasing with the group. In general, the average volatility of the second group is the smallest, which is 0.163, while the volatility difference of the fifth group is the largest, which is 0.229. The difference between the two is 40.49%. Low volatility usually implies low potential returns, and the difference in the Sharpe ratio and information ratio of these two groups is about 507% and 511%, which shows that although the stability of the fifth group is not high, the risk premium is very large and can obtain a large excess return. The maximum drawdown rate is a very important indicator when selecting actively managed funds [52], so this paper includes the maximum backtest rate as an indicator of fund backtesting. According to the maximum backtest results given in Panel D, the maximum backtest rate of the first group is the highest, which is about 13.5%, while the maximum drawdown rate of the fifth group is the lowest, which is about 0.469%. The gap between the two is very large, which shows that the China's actively managed fund market has a relatively stable high return rate, the extreme value of the high return rate group is small, and the extreme value of the low return rate group is large. This is consistent with the conclusion of [53] that funds in the low-yield group of the China's fund market usually have higher maximum drawdowns, while funds in the high-yield group have relatively lower risks. It is worth noting that the maximum drawdowns obtained by each group are lower than the general maximum drawdowns of the market. This is mainly because this paper calculates the maximum drawdowns within each group, and the volatility within the group is relatively small.
Table 3: Descriptive Statistics.
Group | 1 | 2 | 3 | 4 | 5 |
Panel A:Sharpe ratio | |||||
Linear | -1.607 | -0.553 | 0.412 | 0.942 | 2.406 |
Forest | -1.533 | -0.689 | 0.371 | 0.954 | 2.401 |
Lasso | -1.518 | -0.597 | 0.348 | 1.012 | 2.363 |
Ridge | -1.531 | -0.612 | 0.312 | 0.989 | 2.445 |
Elastic Net | -1.509 | -0.389 | 0.181 | 1.170 | 2.187 |
Decision Tree | -1.550 | -0.621 | 0.501 | 1.061 | 2.298 |
Panel B:Information ratio | |||||
Linear | -0.926 | -0.317 | 0.331 | 0.645 | 1.459 |
Forest | -0.871 | -0.436 | 0.274 | 0.644 | 1.430 |
Lasso | -0.852 | -0.355 | 0.274 | 0.739 | 1.377 |
Ridge | -0.866 | -0.360 | 0.254 | 0.694 | 1.465 |
Elastic Net | -0.865 | -0.198 | 0.170 | 0.820 | 1.259 |
Decision Tree | -0.854 | -0.359 | 0.409 | 0.769 | 1.341 |
Panel C:Annual Volatility | |||||
Linear | 0.172 | 0.168 | 0.161 | 0.196 | 0.223 |
Forest | 0.176 | 0.158 | 0.187 | 0.191 | 0.235 |
Lasso | 0.178 | 0.167 | 0.173 | 0.176 | 0.231 |
Ridge | 0.179 | 0.162 | 0.174 | 0.188 | 0.221 |
Elastic Net | 0.181 | 0.175 | 0.171 | 0.164 | 0.238 |
Decision Tree | 0.187 | 0.149 | 0.159 | 0.186 | 0.226 |
Panel D:Max Drawdown | |||||
Linear | -0.142 | -0.052 | -0.019 | -0.015 | -0.004 |
Forest | -0.133 | -0.065 | -0.023 | -0.011 | -0.006 |
Lasso | -0.134 | -0.059 | -0.023 | -0.011 | -0.004 |
Ridge | -0.136 | -0.057 | -0.023 | -0.014 | -0.003 |
Elastic Net | -0.129 | -0.043 | -0.020 | -0.007 | -0.007 |
Decision Tree | -0.139 | -0.058 | -0.015 | -0.010 | -0.005 |
Panel E:R-square | |||||
Linear | 0.777 | 0.886 | 0.793 | 0.827 | 0.856 |
Forest | 0.927 | 0.849 | 0.918 | 0.928 | 0.927 |
Lasso | 0.959 | 0.919 | 0.870 | 0.890 | 0.964 |
Ridge | 0.959 | 0.923 | 0.929 | 0.875 | 0.960 |
Elastic Net | 0.927 | 0.786 | 0.433 | 0.772 | 0.931 |
Decision Tree | 0.838 | 0.885 | 0.860 | 0.876 | 0.893 |
One of the purposes of this paper is to help China's active fund managers make investment portfolio decisions. Therefore, in terms of comparing the performance of each prediction model, this paper focuses on the performance of the fifth group, which is the group with the best predicted fund performance. By comparing the data of the fifth group in panels A, B, C and D, it can be found that in terms of Sharpe ratio, information ratio, volatility and maximum drawdown, Ridge Regression has the best performance, while the performance of elastic network is barely satisfactory. However, the difference between the two is not large. Except for the maximum drawdown, the average performance of Ridge Regression is about 12% better. In addition, in comparison, in terms of the performance of the fifth group, the performance of the portfolio constructed by other machine learning methods except Ridge Regression is lower than that of the portfolio constructed by the OLS method. However, it can be seen from the coefficient of determination in Panel D that in the fifth group, the coefficient of determination of the OLS method is the lowest among all methods. In addition, except for the Elastic Net method, the determination coefficients of the other machine learning methods are generally higher than the OLS method. Compared with the traditional linear model, the machine learning model shows higher potential and efficiency in prediction accuracy. The coefficient of determination can be used to evaluate the prediction accuracy of the model. A higher coefficient of determination indicates that the model can better predict the value of the dependent variable. It is not difficult to see that the coefficients of determination of all models used in this paper are almost close to 0.8 or higher than 0.8, including the OLS method. This shows that the features selected in this paper are highly applicable to all methods, and it is preliminarily proved that these features have a certain explanatory power for the rate of return. Of course, in order to prevent this high accuracy from being caused by overfitting of the model, this paper reduces the number of iterations accordingly when setting some models, and uses Bayesian optimization to find the best model hyperparameters except for the OLS method, so that the model has better generalization performance, thereby indirectly helping to prevent overfitting. In addition, this paper uses 23 features with high correlation with fund yield to predict the yield. These highly correlated features provide rich information for the model, enabling the model to more accurately capture the key features affecting fund yield. In addition, the sample size of this paper is large, and the model can capture more data features and patterns, reduce errors caused by data noise or outliers, and improve the prediction accuracy and generalization ability of the model. Therefore, it is reasonable to obtain a higher coefficient of determination.
4.2. Rank IC value
This paper uses the Spearman correlation coefficient to calculate the monthly Rank IC value of 23 features and lagged one-period yield. The main reason for using the Rank IC value in this paper is that the calculation of the ordinary IC value requires the data to meet the conditions of normal distribution. Although this paper standardizes the feature data, the yield retains the original data. Therefore, the rank correlation coefficient, that is, the Rank IC value, is more used to judge the effectiveness of a single feature.
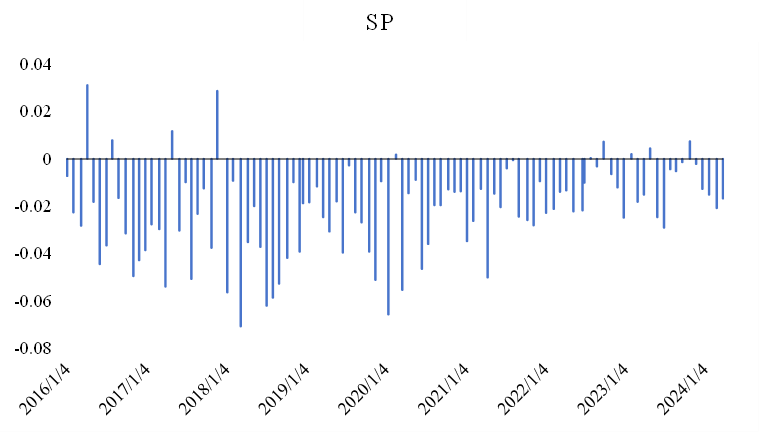
Figure 2: Time Series of SP feature Rank IC
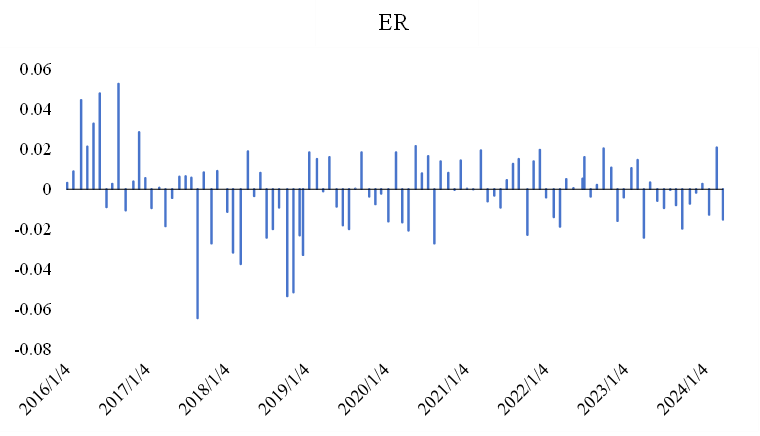
Figure 3: Time Series of ER feature Rank IC
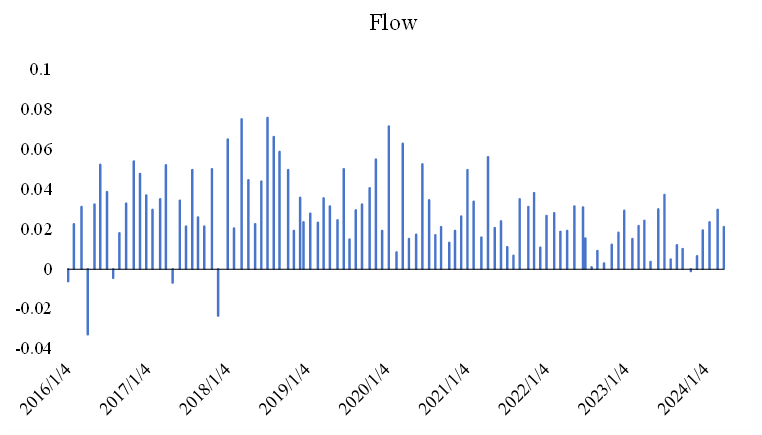
Figure 4: Time Series of Flow feature Rank IC
From the Rank IC values of Sharpe ratio, capital flow and management fee rate since 2016, it can be seen that all three have certain stock selection effects. On the whole, the Sharpe ratio is negatively correlated with the next period's return, that is, the higher the Sharpe ratio of the previous fund, the worse the return performance in the next period, which may be related to mean reversion; while the capital flow ratio is positively correlated with the next period's return, that is, the greater the capital flow of the previous fund, the better the return performance in the next period. The Sharpe ratio and capital flow show a relatively obvious negative and positive relationship, which shows that these two features have strong predictive power for future stock returns. However, most features, such as management fee rate, have Rank IC values that are not constant and will change over time, that is, the correlation between features and next period's return is not constant, reflecting the features of real-time changes in the capital market. After that, this paper took the average of the monthly Rank IC values of all features. In addition, the information ratio ICIR is the ratio of the mean of the IC value sequence to the standard deviation, which takes into account the stock selection ability of the feature and the stability of the feature's stock selection ability, and represents the ability of the feature to obtain Alpha, so the ICIR value of this paper is also taken into consideration. Table 4 shows the summary of Rank IC and ICIR values of 23 features.
From the perspective of IC value, fund manager's working time and the volatility of fund flows have weak predictive ability for future returns; Sharpe ratio, fund liquidity, stock selection ability, return volatility, excess return obtained by FF5 regression and its t statistic have strong predictive ability, and other features also have good predictive ability. From the perspective of Rank IC value and ICIR value, the above six features have high Rank IC value and high ICIR value, which are features with both predictive ability and predictive stability.
5. Conclusion
Based on the current situation and development prospects of actively managed funds in the China's market, this paper combines machine learning methods to explore whether the features selected and constructed in this paper and the generated model algorithm can provide an investment portfolio with excellent performance and provide help to the decision-making of actively managed fund managers.
This paper draws the following conclusions through research:
First, this paper uses 23 features and OLS methods and 5 machine learning methods to make rolling predictions on the fund's yield, groups them according to the predicted values, and calculates the performance of each group based on the grouping. The study shows that the performance of each group is consistent with the real data, that is, the cumulative yield ranking of each group is consistent with the prediction group ranking, the highest yield group has the highest real cumulative yield, and the lowest yield group has the lowest real cumulative yield. In addition, by analyzing the performance, it is found that the funds in the low-yield group of the China's fund market usually have a higher maximum drawdown rate, while the funds in the high-yield group have a relatively low risk.
Second, the accuracy of the prediction results of the 5 machine learning methods and the OLS method are high, with a high decision coefficient, which preliminarily proves that the features used in this paper can provide rich information for the model and have good predictive ability.
Third, by comparing the prediction performance and accuracy of different machine learning methods and OLS methods, it is found that Ridge Regression has the best performance and a high prediction accuracy. In addition, the accuracy of the OLS method is basically lower than that of the machine learning method, indicating that the machine learning method has better flexibility and prediction stability, and has greater advantages in processing nonlinear data.
Fourth, this paper calculates the Rank IC value and ICIR value for 23 features. The analysis shows that, except for the fund manager's working time and the volatility of fund liquidity, the remaining features have good predictive ability, among which the Sharpe ratio, fund liquidity, stock selection ability, return volatility, excess return obtained by FF5 regression and its t statistic have strong predictive ability and prediction stability.
References
[1]. Hendricks, D. , & Zeckhauser, P. R. . (1993). Hot hands in mutual funds: short‐run persistence of relative performance, 1974–1988. Journal of Finance, 48(1), 93-130.
[2]. Goetzmann, W. N. , Ibbotson, R. G. , & Peng, L. . (2001). A new historical database for the nyse 1815 to 1925: performance and predictability. Journal of Financial Markets, 4(1), 1-32.
[3]. Goetzmann, B. W. N. . (1995). Performance persistence. Journal of Finance, 50(2), 679-698.
[4]. Carhart, M. M. . (1997). On persistence in mutual fund performance. Social Science Electronic Publishing, 52(1), 57-82.
[5]. Ni,S., Xiao,H. and Wu,C. (2004) Research on Fund Management Fee Rate Design Based on the Performance in Systems Engineering-Theory and Practice ,(1),25-29.
[6]. Xiao,K. and Yang,Y. (2005) Performance Persistence of Open-end Funds in China. Finance and Trade Research,(2),55-59.
[7]. Yang,X. and Tan,G. (2007) A Empirical Study on the Managers and Hot-hands of Open-ended Funds. Systems Engineering,(6),45-48.
[8]. Malkiel, B. G. , & Saha, A. . (2005). Hedge funds: risk and return. Financial Analysts Journal.
[9]. Shi,C. and Liu,X. (2005) Exploring fund managers' risk adjustment behavior from a competitive perspective. Securities Market Herald ,(2),28-32.
[10]. Shan,L. , & Wang,P. (2012). Performance Ranking and Fund Managers’ Risk-taking Behavior. Review of Investment Studies,31(2),15-30.
[11]. Brown, K. C., Harlow, W. V., & Starks, L. T. (1996). Of Tournaments and Temptations: An Analysis of Managerial Incentives in the Mutual Fund Industry. The Journal of Finance, 51(1), 85–110.
[12]. Hu,W., Nie,S. and Zhang,M. (2004) Performance Persistence of China's Security Funds in Short and Mid-Terms. Systems Engineering,(4),44-48.
[13]. Wang,X. and Wang,G. (2005) An Empirical Study on China's Security-investment-fund Market Momentum and Reversal Phenomenon. Systems Engineering,(1),69-73.
[14]. Diane Del Guercio & Paula A. Tkac.(2008).Star Power: The Effect of Morningstar Ratings on Mutual Fund Flow.The Journal of Financial and Quantitative Analysis(4),907-936.
[15]. DeMiguel Victor,Gil-Bazo Javier,Nogales Francisco J. & Santos André A.P..(2023).Machine learning and fund characteristics help to select mutual funds with positive alpha.Journal of Financial Economics(3).
[16]. Alawneh, Ateyah and Mohammad. (2019). Effect of net cash flows on investors' decisions on companies listed in amman stock exchange during the period of 2001–2017: a case study on industry and service sectors.Review of Investment Studies,15(2).
[17]. Masaya Abe & Hideki Nakayama.(2018).Deep Learning for Forecasting Stock Returns in the Cross-Section..CoRR.
[18]. Zhang, J. , Li, L. , & Chen, W. . (2020). Predicting stock price using two-stage machine learning techniques. Computational Economics.
[19]. Morera Albert,Martínez de Aragón Juan,Bonet José Antonio,Liang Jingjing & de Miguel Sergio.(2021).Performance of statistical and machine learning-based methods for predicting biogeographical patterns of fungal productivity in forest ecosystems.Forest Ecosystems(1).
[20]. Chen, J. , Hong, H. , & Kubik, H. J. D. . (2004). Does fund size erode mutual fund performance? the role of liquidity and organization. American Economic Review, 94(5), 1276-1302.
[21]. Vilas, P. , Andreu, L. , & José Luis Sarto. (2022). Cluster analysis to validate the sustainability label of stock indices: an analysis of the inclusion and exclusion processes in terms of size and esg ratings. Journal of Cleaner Production, 330, 129862-.
[22]. Li, B. , & Rossi, A. G. . (2020). Selecting mutual funds from the stocks they hold: a machine learning approach. SSRN Electronic Journal.
[23]. Gu, S. , Kelly, B. T. , & Xiu, D. . (2018). Empirical asset pricing via machine learning. Social Science Electronic Publishing.
[24]. Jonathan B. Berk & Richard C. Green.(2004).Mutual Fund Flows and Performance in Rational Markets.Journal of Political Economy(6),1269-1295.
[25]. Fama, E. F. and K. R. French (2010). Luck versus skill in the cross-section of mutual fund returns. Journal of Finance 65(5), 1915 – 1947.
[26]. Servaes, H. , & Sigurdsson, K. . The costs and benefits of performance fees in mutual funds. Social Science Electronic Publishing.
[27]. Huang,X. and Wang,X. (2021) Channel Marketing and Capital Flow: Empirical Evidence from China's Open-End Funds. Social Science Front,(2),49-59.
[28]. Galagedera, D. U. A. , Fukuyama, H. , Watson, J. , & Tan, E. K. M. . (2020). Do mutual fund managers earn their fees? new measures for performance appraisal. European Journal of Operational Research, 287.
[29]. Wang,P. and Wang,J. (2009) An empirical analysis of the relationship between fees, performance and capital flow of open-end funds in my country .China Price Journal,(11),38-42
[30]. Zeng,D., Zhou,Z. and Liu,Y. (2005) An Empirical Examination on the Relationship between Managerial Quality and Fund Fees in Mutual Fund . The Theory and Practice of Finance and Economics,(4),49-52.
[31]. Liu,Y. and Cao,G. (2008) A Study on the Correlation between Securities Investment Fund Expenses and Fund Performance. Seeker,(6),23-24+50.
[32]. Gruber, M. J. . (2012). Another puzzle: the growth in actively managed mutual funds. Journal of Finance, 51(3), 783-810.
[33]. Zheng, L. . (1999). Is money smart? a study of mutual fund investors' fund selection ability. Journal of Finance, 54(3), 901-933.
[34]. Lou D .(2012).A Flow-Based Explanation for Return Predictability.The review of financial studies, 25(12):3457-3489.
[35]. Song, Y. . (2017). The mismatch between mutual fund scale and skill. Social Science Electronic Publishing.
[36]. Lin, Z. , Pelger, M. , & Schwert, G. W. . (2023). Machine-learning the skill of mutual fund managers.
[37]. Manuel Ammann,Christopher Bauer,Sebastian Fischer & Philipp Müller.(2019).The impact of the Morningstar Sustainability Rating on mutual fund flows.European Financial Management(3),520-553..
[38]. SAMUEL M. HARTZMARK & ABIGAIL B. SUSSMAN.(2019).Do Investors Value Sustainability? A Natural Experiment Examining Ranking and Fund Flows.The Journal of Finance(6),2789-2837.
[39]. Kacperczyk, M. , Van Nieuwerburgh, S. , & Veldkamp, L. . (2016). A rational theory of mutual funds' attention allocation. Econometrica, 84(2), 571-626.
[40]. Tan,S. and Chen,Y. (2012) Can investment experience improve the returns of stockholders? Journal of Financial Research,(5),164-178.
[41]. Cheng,Y. , & You,Y. (2017) An empirical study on the impact of fund managers' stock selection ability and stock selection enthusiasm on fund performance. Contemporary Economics,(19),38-43.
[42]. Daniel Dorn & Gur Huberman.(2010).Preferred risk habitat of individual investors.Journal of Financial Economics(1),155-173.
[43]. Nofsinger, J. R. , & Sias, R. W. . (2002). Herding and feedback trading by institutional and individual investors. The Journal of Finance.
[44]. K. J. Martijn Cremers & Antti Petajisto.(2009).How Active Is Your Fund Manager? A New Measure That Predicts Performance.The Review of Financial Studies(9),3329-3365.
[45]. Ibert, M. , Kaniel, R. , Nieuwerburgh, S. V. , & Vestman, R. . (2018). Are mutual fund managers paid for investment skill?. Review of Financial Studies, 31(2), 715-772.
[46]. TRAVIS, SAPP, ASHISH, & TIWARI. (2005). Does stock return momentum explain the "smart money" effect?. Journal of Finance.
[47]. Chen,X., Ye,S. , & Ren,Y. (2021). Fund Manager's Active Management Skills and Mutual Fund Performance:Based on the Perspective of Financial Market Cycle. Economic Problems,(1),47-55.
[48]. Aditya Bhardwaj,Yogendra Narayan,Vanraj,Pawan & Maitreyee Dutta.(2015).Sentiment Analysis for Indian Stock Market Prediction Using Sensex and Nifty.Procedia Computer Science85-91.
[49]. Clara Calvo,Carlos Ivorra & Vicente Liern.(2016).Fuzzy portfolio selection with non-financial goals: exploring the efficient frontier.Annals of Operations Research(1-2),31-46.
[50]. David Hunter,Eugene Kandel,Shmuel Kandel & Russ Wermers.(2014).Mutual fund performance evaluation with active peer benchmarks.Journal of Financial Economics(1),1-29.
[51]. Amihud,Y. , Goyenko,R. , Stern,L. N. (2013) in Review of Financial Studies, 26(3),667-694
[52]. Riley, T. , & Yan, Q. . (2022). Maximum drawdown as predictor of mutual fund performance and flows. Financial analysts journal.
[53]. Cao, F. , Xuan, Y. , Yuan, R. , & Zou, H. .(2023) Governance by one-lot shares. Social Science Electronic Publishing.
Cite this article
Zhao,C. (2024). Research on the Prediction of Yield and Portfolio Planning of Actively Managed Funds Based on Machine Learning. Advances in Economics, Management and Political Sciences,130,1-15.
Data availability
The datasets used and/or analyzed during the current study will be available from the authors upon reasonable request.
Disclaimer/Publisher's Note
The statements, opinions and data contained in all publications are solely those of the individual author(s) and contributor(s) and not of EWA Publishing and/or the editor(s). EWA Publishing and/or the editor(s) disclaim responsibility for any injury to people or property resulting from any ideas, methods, instructions or products referred to in the content.
About volume
Volume title: Proceedings of the 8th International Conference on Economic Management and Green Development
© 2024 by the author(s). Licensee EWA Publishing, Oxford, UK. This article is an open access article distributed under the terms and
conditions of the Creative Commons Attribution (CC BY) license. Authors who
publish this series agree to the following terms:
1. Authors retain copyright and grant the series right of first publication with the work simultaneously licensed under a Creative Commons
Attribution License that allows others to share the work with an acknowledgment of the work's authorship and initial publication in this
series.
2. Authors are able to enter into separate, additional contractual arrangements for the non-exclusive distribution of the series's published
version of the work (e.g., post it to an institutional repository or publish it in a book), with an acknowledgment of its initial
publication in this series.
3. Authors are permitted and encouraged to post their work online (e.g., in institutional repositories or on their website) prior to and
during the submission process, as it can lead to productive exchanges, as well as earlier and greater citation of published work (See
Open access policy for details).
References
[1]. Hendricks, D. , & Zeckhauser, P. R. . (1993). Hot hands in mutual funds: short‐run persistence of relative performance, 1974–1988. Journal of Finance, 48(1), 93-130.
[2]. Goetzmann, W. N. , Ibbotson, R. G. , & Peng, L. . (2001). A new historical database for the nyse 1815 to 1925: performance and predictability. Journal of Financial Markets, 4(1), 1-32.
[3]. Goetzmann, B. W. N. . (1995). Performance persistence. Journal of Finance, 50(2), 679-698.
[4]. Carhart, M. M. . (1997). On persistence in mutual fund performance. Social Science Electronic Publishing, 52(1), 57-82.
[5]. Ni,S., Xiao,H. and Wu,C. (2004) Research on Fund Management Fee Rate Design Based on the Performance in Systems Engineering-Theory and Practice ,(1),25-29.
[6]. Xiao,K. and Yang,Y. (2005) Performance Persistence of Open-end Funds in China. Finance and Trade Research,(2),55-59.
[7]. Yang,X. and Tan,G. (2007) A Empirical Study on the Managers and Hot-hands of Open-ended Funds. Systems Engineering,(6),45-48.
[8]. Malkiel, B. G. , & Saha, A. . (2005). Hedge funds: risk and return. Financial Analysts Journal.
[9]. Shi,C. and Liu,X. (2005) Exploring fund managers' risk adjustment behavior from a competitive perspective. Securities Market Herald ,(2),28-32.
[10]. Shan,L. , & Wang,P. (2012). Performance Ranking and Fund Managers’ Risk-taking Behavior. Review of Investment Studies,31(2),15-30.
[11]. Brown, K. C., Harlow, W. V., & Starks, L. T. (1996). Of Tournaments and Temptations: An Analysis of Managerial Incentives in the Mutual Fund Industry. The Journal of Finance, 51(1), 85–110.
[12]. Hu,W., Nie,S. and Zhang,M. (2004) Performance Persistence of China's Security Funds in Short and Mid-Terms. Systems Engineering,(4),44-48.
[13]. Wang,X. and Wang,G. (2005) An Empirical Study on China's Security-investment-fund Market Momentum and Reversal Phenomenon. Systems Engineering,(1),69-73.
[14]. Diane Del Guercio & Paula A. Tkac.(2008).Star Power: The Effect of Morningstar Ratings on Mutual Fund Flow.The Journal of Financial and Quantitative Analysis(4),907-936.
[15]. DeMiguel Victor,Gil-Bazo Javier,Nogales Francisco J. & Santos André A.P..(2023).Machine learning and fund characteristics help to select mutual funds with positive alpha.Journal of Financial Economics(3).
[16]. Alawneh, Ateyah and Mohammad. (2019). Effect of net cash flows on investors' decisions on companies listed in amman stock exchange during the period of 2001–2017: a case study on industry and service sectors.Review of Investment Studies,15(2).
[17]. Masaya Abe & Hideki Nakayama.(2018).Deep Learning for Forecasting Stock Returns in the Cross-Section..CoRR.
[18]. Zhang, J. , Li, L. , & Chen, W. . (2020). Predicting stock price using two-stage machine learning techniques. Computational Economics.
[19]. Morera Albert,Martínez de Aragón Juan,Bonet José Antonio,Liang Jingjing & de Miguel Sergio.(2021).Performance of statistical and machine learning-based methods for predicting biogeographical patterns of fungal productivity in forest ecosystems.Forest Ecosystems(1).
[20]. Chen, J. , Hong, H. , & Kubik, H. J. D. . (2004). Does fund size erode mutual fund performance? the role of liquidity and organization. American Economic Review, 94(5), 1276-1302.
[21]. Vilas, P. , Andreu, L. , & José Luis Sarto. (2022). Cluster analysis to validate the sustainability label of stock indices: an analysis of the inclusion and exclusion processes in terms of size and esg ratings. Journal of Cleaner Production, 330, 129862-.
[22]. Li, B. , & Rossi, A. G. . (2020). Selecting mutual funds from the stocks they hold: a machine learning approach. SSRN Electronic Journal.
[23]. Gu, S. , Kelly, B. T. , & Xiu, D. . (2018). Empirical asset pricing via machine learning. Social Science Electronic Publishing.
[24]. Jonathan B. Berk & Richard C. Green.(2004).Mutual Fund Flows and Performance in Rational Markets.Journal of Political Economy(6),1269-1295.
[25]. Fama, E. F. and K. R. French (2010). Luck versus skill in the cross-section of mutual fund returns. Journal of Finance 65(5), 1915 – 1947.
[26]. Servaes, H. , & Sigurdsson, K. . The costs and benefits of performance fees in mutual funds. Social Science Electronic Publishing.
[27]. Huang,X. and Wang,X. (2021) Channel Marketing and Capital Flow: Empirical Evidence from China's Open-End Funds. Social Science Front,(2),49-59.
[28]. Galagedera, D. U. A. , Fukuyama, H. , Watson, J. , & Tan, E. K. M. . (2020). Do mutual fund managers earn their fees? new measures for performance appraisal. European Journal of Operational Research, 287.
[29]. Wang,P. and Wang,J. (2009) An empirical analysis of the relationship between fees, performance and capital flow of open-end funds in my country .China Price Journal,(11),38-42
[30]. Zeng,D., Zhou,Z. and Liu,Y. (2005) An Empirical Examination on the Relationship between Managerial Quality and Fund Fees in Mutual Fund . The Theory and Practice of Finance and Economics,(4),49-52.
[31]. Liu,Y. and Cao,G. (2008) A Study on the Correlation between Securities Investment Fund Expenses and Fund Performance. Seeker,(6),23-24+50.
[32]. Gruber, M. J. . (2012). Another puzzle: the growth in actively managed mutual funds. Journal of Finance, 51(3), 783-810.
[33]. Zheng, L. . (1999). Is money smart? a study of mutual fund investors' fund selection ability. Journal of Finance, 54(3), 901-933.
[34]. Lou D .(2012).A Flow-Based Explanation for Return Predictability.The review of financial studies, 25(12):3457-3489.
[35]. Song, Y. . (2017). The mismatch between mutual fund scale and skill. Social Science Electronic Publishing.
[36]. Lin, Z. , Pelger, M. , & Schwert, G. W. . (2023). Machine-learning the skill of mutual fund managers.
[37]. Manuel Ammann,Christopher Bauer,Sebastian Fischer & Philipp Müller.(2019).The impact of the Morningstar Sustainability Rating on mutual fund flows.European Financial Management(3),520-553..
[38]. SAMUEL M. HARTZMARK & ABIGAIL B. SUSSMAN.(2019).Do Investors Value Sustainability? A Natural Experiment Examining Ranking and Fund Flows.The Journal of Finance(6),2789-2837.
[39]. Kacperczyk, M. , Van Nieuwerburgh, S. , & Veldkamp, L. . (2016). A rational theory of mutual funds' attention allocation. Econometrica, 84(2), 571-626.
[40]. Tan,S. and Chen,Y. (2012) Can investment experience improve the returns of stockholders? Journal of Financial Research,(5),164-178.
[41]. Cheng,Y. , & You,Y. (2017) An empirical study on the impact of fund managers' stock selection ability and stock selection enthusiasm on fund performance. Contemporary Economics,(19),38-43.
[42]. Daniel Dorn & Gur Huberman.(2010).Preferred risk habitat of individual investors.Journal of Financial Economics(1),155-173.
[43]. Nofsinger, J. R. , & Sias, R. W. . (2002). Herding and feedback trading by institutional and individual investors. The Journal of Finance.
[44]. K. J. Martijn Cremers & Antti Petajisto.(2009).How Active Is Your Fund Manager? A New Measure That Predicts Performance.The Review of Financial Studies(9),3329-3365.
[45]. Ibert, M. , Kaniel, R. , Nieuwerburgh, S. V. , & Vestman, R. . (2018). Are mutual fund managers paid for investment skill?. Review of Financial Studies, 31(2), 715-772.
[46]. TRAVIS, SAPP, ASHISH, & TIWARI. (2005). Does stock return momentum explain the "smart money" effect?. Journal of Finance.
[47]. Chen,X., Ye,S. , & Ren,Y. (2021). Fund Manager's Active Management Skills and Mutual Fund Performance:Based on the Perspective of Financial Market Cycle. Economic Problems,(1),47-55.
[48]. Aditya Bhardwaj,Yogendra Narayan,Vanraj,Pawan & Maitreyee Dutta.(2015).Sentiment Analysis for Indian Stock Market Prediction Using Sensex and Nifty.Procedia Computer Science85-91.
[49]. Clara Calvo,Carlos Ivorra & Vicente Liern.(2016).Fuzzy portfolio selection with non-financial goals: exploring the efficient frontier.Annals of Operations Research(1-2),31-46.
[50]. David Hunter,Eugene Kandel,Shmuel Kandel & Russ Wermers.(2014).Mutual fund performance evaluation with active peer benchmarks.Journal of Financial Economics(1),1-29.
[51]. Amihud,Y. , Goyenko,R. , Stern,L. N. (2013) in Review of Financial Studies, 26(3),667-694
[52]. Riley, T. , & Yan, Q. . (2022). Maximum drawdown as predictor of mutual fund performance and flows. Financial analysts journal.
[53]. Cao, F. , Xuan, Y. , Yuan, R. , & Zou, H. .(2023) Governance by one-lot shares. Social Science Electronic Publishing.