


1. Introduction
According to the financial statement analysis of Tesla, Ganga Bhavani pointed out that, according to the data from 2015 to 2017, a potential threat caused by the long-term debt existed. Ganga Bhavani used the method of analyzing financial data to describe Tesla’s situation with indexes – current ratio, gross profit and liquidity ratio, etc [1].
This paper expounds on Tesla's position in the market by using a similar illustrative method of financial statement analysis. The analysis of financial statements is helpful in highlighting the outstanding characteristics, highlighting the important aspects of financial status and operating results, and identify the advantages and disadvantages of enterprises [1]. Financial statement analysis can be defined as decomposing, interpreting, and translating data contained in financial statements, and providing useful information for the future possibilities of various stakeholders [2]. Choate's research shows that the main goal of financial statement analysis is to find the trend and change in company performance and provide information to investors in time [3]. Tools and
Financial statement analysis techniques include general scale analysis, comparative analysis, trend analysis and ratio analysis. Among the four commonly used financial statement analysis techniques, ratio is the most powerful tool to interpret financial statements. In the ratio analysis, the numberThe judgment of financial statements on the company [4]. Financial ratio provides a method to study meaningful relationship by combining two or more financial figures into one figure, so it can be used to determine the performance of a company in time and effectively [5]. Consequently, people choose to take some ratios out of the financial statements – Earning per share, net profit margin on sales, and return on equity to analyze the profitability of Tesla and make a judgement whether the leader of the Battery Electric Vehicles is worthy to invest and reveal the future of the battery electric vehicles.
2. Overview of the Development of Tesla
Tesla, Inc., an American manufacturer of electric automobiles, solar panels, and batteries for cars, was founded in 2003 by American entrepreneurs Martin Eberhard and Marc Tarpenning and was named after Serbian American inventor Nikola Tesla, best known for discovering the properties of rotating electromagnetic fields. In 2008, Tesla’s new invention– Roadster—entered production. Though the Roadster has a variety of technical advantages in the field of electric vehicles, its high price still makes it a luxury for most customers. Meanwhile, Elon Musk, whose face will be Tesla’s in the next ten years, took over as CEO. In 2010, Elon Musk and his team rang the bell of Nasdaq's listing, and Tesla became the first automobile company listed in the United States since Ford Motor Company in 1956. In 2012, Tesla delivered Model S to the first customers and launched the first SUV Model X prototype. At the same time, Tesla opened its first independent charging station, called a supercharger. Starting from six locations in California, by April 2024, it has expanded to more than 50,000 companies around the world. Entering the mass consumer market, in 2016, Tesla released the Model 3 sedan. This is the company's first car for major markets, and the price will be less than 70,000 dollars. On the background of a series of strong quarterly profits and rising analysts, Tesla's stock soared, exceeding $235 at the end of the year. In January this year, it became the most valuable automobile manufacturer in the United States, with a market value of more than $100 billion, which rose to $250 billion in July. By August 2020, Tesla's market value will reach 400 billion US dollars, becoming the most valuable automobile manufacturer in the world, surpassing Toyota. According to Tesla's report, in 2021, more than 936,000 vehicles were delivered worldwide, an increase of nearly 50% over the previous year [6-7].
3. Tesla’s Profitability
3.1. Data Collection and Index Selection
This thesis collects the data – earning per share, net profit margin on sales and return on equity, that is from 2020 to 2023, from the Tesla’s official website. The formulas of them and reasons that we choose them are:
Earning Per Share can be calculated by net profit divided by the number of common shares.
\( EPS=\frac{Net Income-Preferred Dividends}{End of Period Common Shares Outstanding} \) (1)
The definition of EPS is a metric to estimate corporate value. EPS will indicate how much money a company makes for each share of its stock. By the definition, it is obvious that EPS is an important index to analyze a company’s profitability.
For net profit margin, its formula is
Profit Margin = \( \frac{Profit}{Revenue} × 100\% \) (2)
It will illustrate how much profit is generated as percentage of revenue. Such a factor will provide investors with information about the company’s cost and the company’s efficiency to help investors to judge whether the company is healthy enough to invest.
As for return on equity (ROE), its formula is
\( ROE= \frac{company \prime s net income}{ shareholders \prime equity} × 100\% \) \( (3) \)
Return on net assets is an expression of an enterprise's overall profitability. It can be simply regarded as the amount of gold in each currency unit. Additionally, investors will know the shareholders’ confidence of this company. It is an important index for investors to make a judgement of this company. That is why this paper chooses these three factors.
3.2. Earnings Per Share
Earnings per share and EPS growth , listed on the Tesla’s official websit from 2020 to 2023, are shown in Table 1 below. As the table shows, Tesla’s EPS is growing at a positive rate and has improved dramatically form 2020 to 2023. Besides, Tesla’s EPS has reached its highest point in history in 2023 but there is still one thing worthy to mention: the EPS growth has decreased gradually.
Table 1: EPS and EPS growth of Tesla in 2020~2023.
Time | 12/30/2020 | 12/30/2021 | 12/30/2022 | 12/30/2023 |
EPS | 0.21$ | 1.63$ | 3.62$ | 4.3$ |
EPS growth | 164.97% | 667.84% | 122.04% | 18.85% |
3.3. Net Profit Margin on Sales
Tesla’s 2020-2023 profit margin are displayed below in Table 2. It is obvious to see that the index has increased substantially. Based on the formula, it seems clear that our target's profitability has achieved an significant jump from 2020 to 2021 and is working more and more effectively until 2023.
Table 2: profit margin of Tesla in 2020~2023.
Time | 12/30/2020 | 12/30/2021 | 12/30/2022 | 12/30/2023 |
profit margin | 2.19% | 10.26% | 15.54% | 15.50% |
3.4. Return on Equity
As Table 3 shows Tesla’s Return on equity has a considerable boost from 2020 to 2023, especially for 2020~ 2021. But it can be also observed that there is a comparatively small drop between 2022 and 2023.
Table 3: ROE of Tesla in 2020 ~ 2023.
Time | 12/30/2020 | 12/30/2021 | 12/30/2022 | 12/30/2023 |
ROE | 4.8% | 21.1% | 33.6% | 27.9% |
4. Tesla’ s Current Dilemma
4.1. Falling Demand Caused by the Competition.
According to Kelly’s bluebook, in the first quarter of 2024, there are 270,000 electric vehicles sold in USA Tesla's global sales totaled 387,000 vehicles, up 2.6% from the same period last year, but down 7.3% from the last quarter of 2023. Meanwhile, Tesla's market share has fallen from 62% in early 2023 to 51% now and Tesla's global sales totaled 387,000 vehicles, down 13% from the same period last year (Figure 1) [8]. The drastic competition of electric vehicles in USA accounts for Tesla’s falling demand. Tesla’s Emerging competitors are seeing double - or even triple-digit sales growth. Traditional car brands such as Hyundai, Mercedes and BMW have also seen an increase in electric vehicle sales, eating into Tesla's market share.
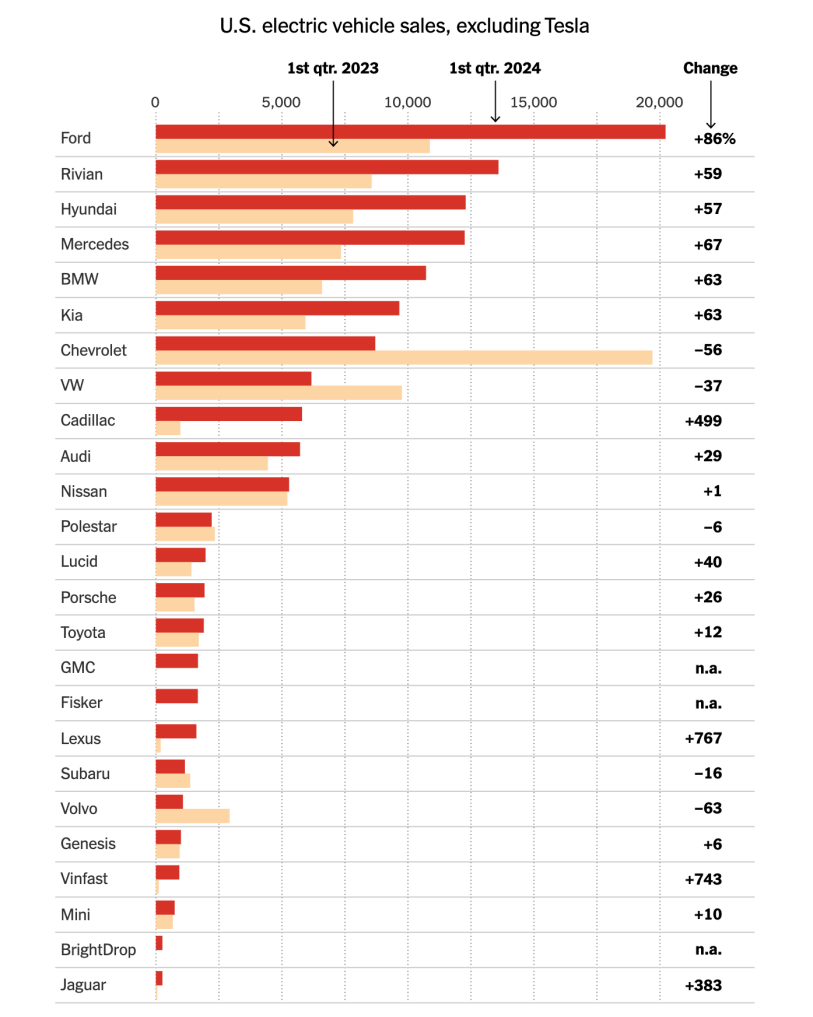
Figure 1: Electric Vehicle Sales in the USA [8].
Not only the competitors in the USA, but also the competitors in China. The Chinese EV industry has been aided by more than a decade of strong support from Beijing in the form of subsidies, tax breaks and consumer incentives, which is a strong opponent to Tesla. Besides, as more and more competitors enter the market, Tesla has no choice but to sacrifice its profit for its living room.
Tesla has lowered the starting prices of four models sold in its largest overseas market, mainland China, by 14,000 yuan (equivalent to 1,932 USD). The company's best-selling Model Y in the domestic market now starts at 249,900 yuan (34,502 USD), the lowest price ever. But China’s opponent has also taken corresponding actions: Chinese electric vehicle manufacturer Li Auto (LI), led by billionaire entrepreneur Li Xiang, responded by announcing an immediate price reduction for all four of its models. The company claims that the Li Mega, the world's largest passenger electric vehicle, is now priced 30,000 yuan (4,142 USD) cheaper. Guangzhou-based electric vehicle manufacturer XPeng Motors announced that it would offer subsidies worth 500 million yuan (69 million USD) to buyers of its four models. In March, BYD lowered the starting price of its cheapest electric vehicle, the Seagull hatchback, by 5% to 69,800 yuan (9,670 USD). Later that month, smartphone manufacturer Xiaomi also joined the electric vehicle competition by launching the SU7 sedan, aiming to compete with Tesla.
4.2. Tesla’s Quality
Tesla’s recall service is to repair the cars which have been sold for free. Tesla once recalled more than 125,000 cars that had defect in the seat belt system and put consumers at risk of injury. This recall is just a part of the company's 2.5 million recalls issued in 2024 so far. In January 2024, Tesla recalled Models Y, S, and X produced in 2023 because of a reversing software issue. During the next month, the company again recalled 2.2 million vehicles due to the “incorrect front size” on its instrument panel. Later, in April, Tesla recalled all MY 2024 Cybertrucks made from November 2023 to April 2024 for faulty accelerator pedals. These recall numbers all point out that there is some potential problem with the quality of Tesla’s vehicles. According to the lending tree’s analysis, there are 23.54 accidents per 1,000 Tesla’s drivers, which is the highest accident rate of any car in 2023. Moreover, after NHTSA’s 3-year investigation, its newly invented autopilot system has been defined as “very weak”. On August 13, 2021, NHTSA conducted an engineering safety analysis of Tesla, citing more than 10 autopilot-related accidents. Now, after three years, in April, NHTSA finally announced that the research showed that of the 956 incidents involved, the autopilot system’s "critical safety gaps" contributed to 467 [9]. Besides, of those, 211 involved a Tesla vehicle hitting another vehicle or an obstacle head-on with enough time to react; A further 256 accidents were linked to drivers misoperating the Autosteer system, or the system being activated incorrectly in low-friction conditions, such as rainy days.
5. Suggestions for Future Development
By fully leveraging Tesla's advanced technological advantages, Tesla can spend money on doing research on battery technology, including solid- state batteries, autopilot systems, and solar energy. By finishing this research, Tesla can lower its production costs and attract customers’ interest. Besides, Tesla should also coordinate with relevant departments to produce vehicles that will pass the regulations.
6. Conclusion
This article primarily discusses Tesla's development process, analyzes its financial status, and addresses the challenges it has encountered at various stages. Tesla is clearly the leading company in the electric vehicle (EV) industry in the 21st century. By examining its past financial data—EPS, net profit margin on sales, and return on equity, this paper analyzes the rapid growth and substantial profits it achieved from 2020 to 2023. However, according to our data analysis, we also know that it faced setbacks towards the end of 2023. These setbacks mainly stemmed from intense competition within the EV industry, particularly the price wars initiated by Chinese companies, and issues related to EV quality, such as seat belt problems and the autonomous driving feature. This indicates that the EV market is nearing saturation, and the accompanying problem is the quality of EVs.
A current limitation of this article is the absence of a specific model to analyze Tesla's future development. This can be addressed by establishing a comprehensive model and conducting a detailed data analysis. Future research may focus on Tesla's development in the post-pandemic era, examining how the company adapts to changes in market dynamics and consumer behavior. Additionally, it will be important to conduct research on Tesla's performance following workforce reductions and how these changes impact its operational efficiency and innovation capabilities. By developing robust analytical models, we can gain deeper insights into Tesla's potential trajectories and the broader implications for the EV industry as a whole.
References
[1]. Mehta, A., & Bhavani, G. (2018). Financial statements analysis on Tesla. Academy of Accounting and Financial Studies Journal, 22(6), 1-9.
[2]. Choate, G.M. (1974). Financial ratio analysis. Hospital Progress, 55(1), 49-57.
[3]. Laitinen, E. K. (2002). A dynamic performance measurement system: evidence from small Finnish technology companies. Scandinavian journal of management, 18(1), 65-99.
[4]. Nuhu, M. (2014). Role of ratio analysis in business decisions: A case study NBC Maiduguri Plant. Journal of Educational and Social Research, 4(5), 105-118.
[5]. Ross, S. A., Westerfield, R. W. & Jordan, J. (2013) Fundamentals Corporate Finance, 1st Middle East edition, Mc Graw- Hill.
[6]. Shi, M., Zhang, Y., & Zhu, C. (2022). A Review of Factors Affecting Tesla's Profitability, BCP Business & Management, 26:18-24, DOI:10.54691/bcpbm.v26i.1821.
[7]. Badolato, P. (2022). Understanding Corporate Income Tax Reporting: Tesla’s Electrifying Ride to Profitability. SAGE Publications: SAGE Business Cases Originals. DOI: https://doi.org/10.4135/9781529774702
[8]. Electric Vehicle Sales Report Q1 2024, Kelly Blue Book, Cox Automotove, coxautoinc.com, extension://bfdogplmndidlpjfhoijckpakkdjkkil/pdf/viewer.html?file=https%3A%2F%2Fwww.coxautoinc.com%2Fwp-content%2Fuploads%2F2024%2F04%2FQ1-2024-Kelley-Blue-Book-Electric-Vehicle-Sales-Report.pdf
[9]. Kikkas, O. A. (2020). Financial performance assessment of tesla, inc. and nissan motor company.
Cite this article
Zhang,Z. (2024). An Analysis of Tesla’s Development and Profitability. Advances in Economics, Management and Political Sciences,131,108-113.
Data availability
The datasets used and/or analyzed during the current study will be available from the authors upon reasonable request.
Disclaimer/Publisher's Note
The statements, opinions and data contained in all publications are solely those of the individual author(s) and contributor(s) and not of EWA Publishing and/or the editor(s). EWA Publishing and/or the editor(s) disclaim responsibility for any injury to people or property resulting from any ideas, methods, instructions or products referred to in the content.
About volume
Volume title: Proceedings of the 8th International Conference on Economic Management and Green Development
© 2024 by the author(s). Licensee EWA Publishing, Oxford, UK. This article is an open access article distributed under the terms and
conditions of the Creative Commons Attribution (CC BY) license. Authors who
publish this series agree to the following terms:
1. Authors retain copyright and grant the series right of first publication with the work simultaneously licensed under a Creative Commons
Attribution License that allows others to share the work with an acknowledgment of the work's authorship and initial publication in this
series.
2. Authors are able to enter into separate, additional contractual arrangements for the non-exclusive distribution of the series's published
version of the work (e.g., post it to an institutional repository or publish it in a book), with an acknowledgment of its initial
publication in this series.
3. Authors are permitted and encouraged to post their work online (e.g., in institutional repositories or on their website) prior to and
during the submission process, as it can lead to productive exchanges, as well as earlier and greater citation of published work (See
Open access policy for details).
References
[1]. Mehta, A., & Bhavani, G. (2018). Financial statements analysis on Tesla. Academy of Accounting and Financial Studies Journal, 22(6), 1-9.
[2]. Choate, G.M. (1974). Financial ratio analysis. Hospital Progress, 55(1), 49-57.
[3]. Laitinen, E. K. (2002). A dynamic performance measurement system: evidence from small Finnish technology companies. Scandinavian journal of management, 18(1), 65-99.
[4]. Nuhu, M. (2014). Role of ratio analysis in business decisions: A case study NBC Maiduguri Plant. Journal of Educational and Social Research, 4(5), 105-118.
[5]. Ross, S. A., Westerfield, R. W. & Jordan, J. (2013) Fundamentals Corporate Finance, 1st Middle East edition, Mc Graw- Hill.
[6]. Shi, M., Zhang, Y., & Zhu, C. (2022). A Review of Factors Affecting Tesla's Profitability, BCP Business & Management, 26:18-24, DOI:10.54691/bcpbm.v26i.1821.
[7]. Badolato, P. (2022). Understanding Corporate Income Tax Reporting: Tesla’s Electrifying Ride to Profitability. SAGE Publications: SAGE Business Cases Originals. DOI: https://doi.org/10.4135/9781529774702
[8]. Electric Vehicle Sales Report Q1 2024, Kelly Blue Book, Cox Automotove, coxautoinc.com, extension://bfdogplmndidlpjfhoijckpakkdjkkil/pdf/viewer.html?file=https%3A%2F%2Fwww.coxautoinc.com%2Fwp-content%2Fuploads%2F2024%2F04%2FQ1-2024-Kelley-Blue-Book-Electric-Vehicle-Sales-Report.pdf
[9]. Kikkas, O. A. (2020). Financial performance assessment of tesla, inc. and nissan motor company.