


1. Introduction
Data has become a crucial driver in modern finance, advancing quantitative finance and improving decision-making. However, technological advancements have also facilitated more sophisticated financial crimes, such as money laundering. To address these threats, financial institutions must adopt advanced risk monitoring tools. Regulatory measures like the Patriot Act in the U.S. and the anti-money laundering (AML) directive in Europe have imposed stricter compliance requirements, highlighting the need for innovative AML strategies. Jack et al. [1] investigated graph neural networks (GNNs) and recurrent neural networks (RNNs) for analyzing transaction patterns to detect money laundering, while Akash et al. [2] compared various machine learning algorithms for fraud detection. Yongshan et al. [3] proposed a method combining comparative learning with generative adversarial networks (GANs) for anomaly detection in multivariate time series. Despite AI's potential, challenges such as model interpretability and reliance on labeled data remain.
In addition to traditional machine learning methods, GNN technology has increasingly been applied to the field of AML. Liyu & Qiang [4] explored how GNNs can capture complex dependencies between nodes in a graph and improve model accuracy through a message-passing mechanism that updates node features. Additionally, Simone & Stefano [5] applied various GNN architectures, including Graph Convolutional Networks (GCNs), Graph Attention Networks (GATs), Chebyshev space Convolutional Neural Networks (ChebNet), and Graph Sample and Aggregated (GraphSAGE), to classify bitcoin transactions, demonstrating the effectiveness of GNNs in handling complex financial data. Moreover, Bin et al. [6] introduced multi-fraud, a heterogeneous learning framework that utilizes multi-view heterogeneous information GNNs for advanced fraud detection. These studies indicate that integrating GNNs with knowledge graphs significantly enhances the intelligence and automation of AML systems.
This research aims to enhance AML systems by integrating knowledge graphs and GNNs. By modeling financial transactions as knowledge graphs and applying GCNs and GATs, it identifies hidden money laundering patterns that traditional rule-based methods often miss. This approach addresses inefficiencies in existing systems and reduces compliance costs. Experimental results show that combining GNNs with knowledge graphs significantly improves detection accuracy, especially with GCNs. These findings offer financial institutions and regulators scalable tools to better detect suspicious activities, streamline compliance, and strengthen financial market security.
2. Methodology
2.1. Dataset Description and Preprocessing
This research used a synthetic dataset provided by International Business Machines Corporation (IBM), which is designed to simulate financial transaction data while addressing privacy and proprietary concerns associated with real financial data [7]. The dataset comprises 1,243 detailed transactions from various banks, starting from September 1, 2022. It includes information such as transaction timestamps, involved accounts, banks of receipt and payment, transaction amounts, currencies, payment methods, and a label indicating whether a transaction is suspected of money laundering. A description of the relevant variables is presented in Table 1. During the preprocessing phase, categorical variables such as payment method and currency type were encoded numerically, and timestamps were normalized. Account details were consolidated into unique identifiers to maintain consistency.
Table 1: Variable-related descriptions.
# | Column | Non-Null Count | Dtype |
1 | Timestamp | 1243 non-null | object |
2 | From Bank | 1243 non-null | int64 |
3 | Account | 1243 non-null | object |
4 | To Bank | 1243 non-null | int64 |
5 | Account.1 | 1243 non-null | object |
6 | Amount Received | 1243 non-null | float64 |
7 | Receiving Currency | 1243 non-null | object |
8 | Amount Paid | 1243 non-null | float64 |
9 | Payment Currency | 1243 non-null | object |
10 | Payment Format | 1243 non-null | object |
2.2. Proposed Approach
This research aims to develop an efficient money laundering detection model by applying GNNs to a knowledge graph constructed from comprehensive financial transaction data. The process begins with data preprocessing, which involves encoding categorical variables, normalizing timestamps, and merging account details into unique identifiers (as illustrated in Figure 1). A knowledge graph is then constructed, where nodes represent accounts and edges represent transactions, capturing complex relationships and attributes such as transaction amounts, currencies, and payment methods. The model is based on GAT, chosen for its ability to learn node features through an attention mechanism. The architecture consists of four graph attention layers with multiple heads to aggregate attention weights, followed by a fully connected layer for classification, using focus loss to handle class imbalance. Performance is evaluated through standard metrics, and the structure of the knowledge graph is visualized and analyzed. This study hypothesizes that GAT can effectively capture intricate relationships within the data, leading to improved detection accuracy. While the model shows promising results during training, further optimization is needed to address overfitting and potential data distribution discrepancies. Ultimately, this research seeks to provide a robust and scalable solution that enhances the security and compliance capabilities of financial institutions.
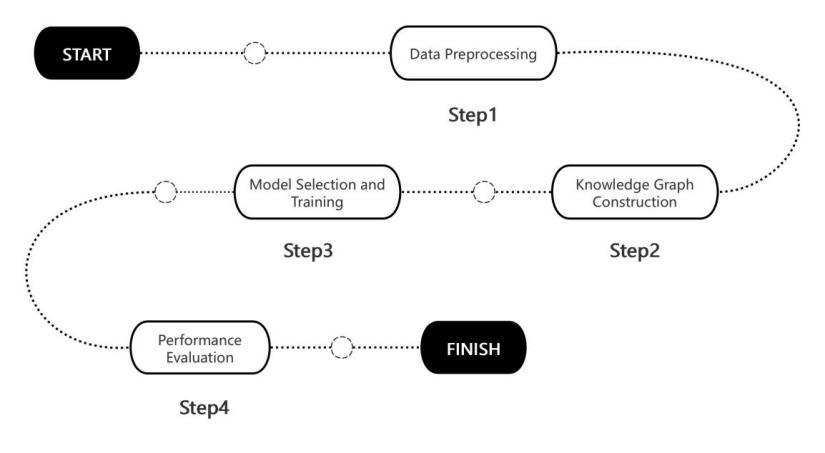
Figure 1: Research process.
2.2.1. Knowledge Graph
A Knowledge Graph is a structured semantic network that represents entities and their relationships through nodes and edges [8], adding semantic meaning to data for deeper insights and reasoning [9]. Key features include semantic understanding, structured organization, scalability, and reasoning capabilities, making Knowledge Graphs valuable for analyzing large, complex datasets in areas like recommender systems and search engines (see in Figure 2). In this experiment, a knowledge graph is built from financial transaction data, where nodes represent bank accounts, edges depict transactional relationships, and attributes like transaction amounts and money laundering labels are included. The GAT model is used for classification, applying a four-layer attention mechanism and a fully connected layer for final predictions. Focal loss is employed to handle class imbalance and improve performance.
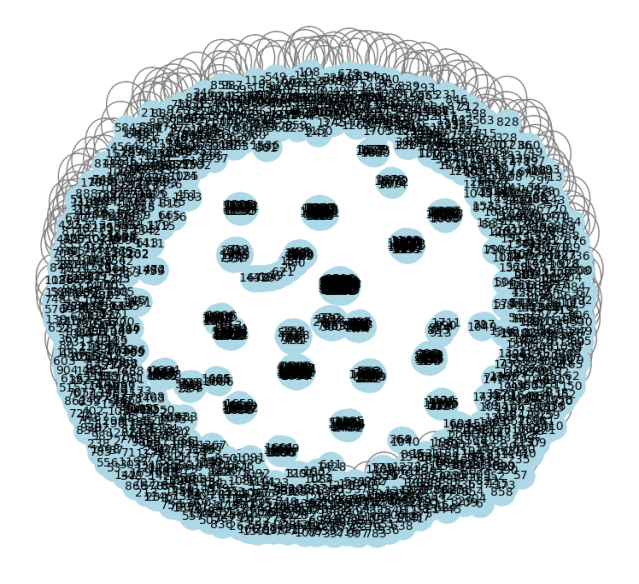
Figure 2: Graph visualization.
2.2.2. Graph Neural Networks (GNNs)
GNNs are neural network models designed to process graph-structured data, capturing relationships between nodes and edges [10]. Unlike traditional networks, GNNs excel in learning node representations by aggregating and updating information from neighboring nodes, making them highly effective for tasks like classification and prediction. They capture both local and global information, handle irregular data structures, and adapt to graph topology [11], making them useful in fields like social network analysis and bioinformatics. Among GNN variants, GAT enhances flexibility by incorporating an attention mechanism that assigns different weights to nodes, improving performance on heterogeneous graphs. In this experiment, a four-layer GAT model is trained on financial transaction data, with focal loss applied to address class imbalance. The model's performance is evaluated using accuracy, precision, recall, and F1 score, with ongoing optimization to improve generalization.
2.2.3. Focal Loss
Focal loss is a loss function specially designed to solve the problem of category imbalance, especially in target detection and classification tasks. The core idea is to improve the model's ability to recognise a small number of classes by decreasing the loss contribution to easy-to-categorise samples and thus increasing the attention to difficult-to-categorise samples [12]. The formula for focal loss is as equation (1):
\( Focalloss=-{a_{t}}{(1-{p_{t}})^{γ}}log{({p_{t}})}\ \ \ (1) \)
\( {p_{t}} \) represents the predicted probability: if the true label y = 1, then \( {p_{t}}=p \) ; if y = 0, then \( {p_{t}}=1-p \) , where p is the model’s predicted probability for the positive class. αt is an optional balancing factor used to adjust the balance between positive and negative samples, typically to control the weighting for class imbalance. The parameter γ is a focusing parameter, which controls the rate at which easy and hard samples’ loss decays. Generally, when γ ≥ 0, the harder-to-classify samples (i.e., smaller pt ) have larger weights.
Focal loss introduces the term \( {(1-{p_{t}})^{γ}} \) , which dynamically adjusts the loss weight of each sample. For easy-to-classify samples (i.e., \( {p_{t}} \) close to 1), this term approaches 0, reducing their loss contribution; for hard-to-classify samples (i.e., smaller pt), this term is larger, increasing their loss weight. This mechanism ensures that the model focuses more on difficult-to-classify samples during training, thereby improving the recognition performance for minority classes. Focal Loss reduces the loss contribution from easy samples, allowing the model to better learn from minority class samples, and can be flexibly applied to different tasks by adjusting the parameters γ and α.
3. Result and Discussion
3.1. Model Performance
This research builds a model for money laundering detection using the GAT applied to knowledge graph data. The process involves data preprocessing to convert the data into a graph structure, followed by model training and evaluation. Focal Loss is used to handle class imbalance, and the final results include a classification report and graph visualization. The hypothesis is that the GAT can capture complex relationships between nodes, enhancing the detection of money laundering activities.
Table 2: Training set model performance.
Model | Loss | Accuracy | Precision | Recall | F1-score |
GAT | 4.3261 | 0.75 | 0.76 (0.0) 0.71(1.0) | 0.74(0.0) 0.73(1.0) | 0.76(0.0) 0.72(0.0) |
Table 3: Testing set model performance.
Model | Loss | Accuracy | Precision | Recall | F1-score |
GAT | 4.3261 | 0.75 | 0.73 (0.0) 0.68 (1.0) | 0.70 (0.0) 0.71 (1.0) | 0.71 (0.0) 0.69 (1.0) |
As displayed in Table 2 and Table 3, on the training set, the GAT model achieved a loss of 4.33 and 75% accuracy, with better metrics for category 0 than category 1, indicating strong performance. However, on the test set, the model's loss increased to 4.88, and accuracy dropped to 70%, showing reduced generalization, likely due to overfitting or data distribution differences. Overall, while the GAT model shows promise for detecting money laundering (see in Figure 3), it requires further tuning to improve prediction performance on test data. Sensitivity analysis on different data volumes will help assess and enhance the model’s robustness, improving stability and accuracy in practical applications.
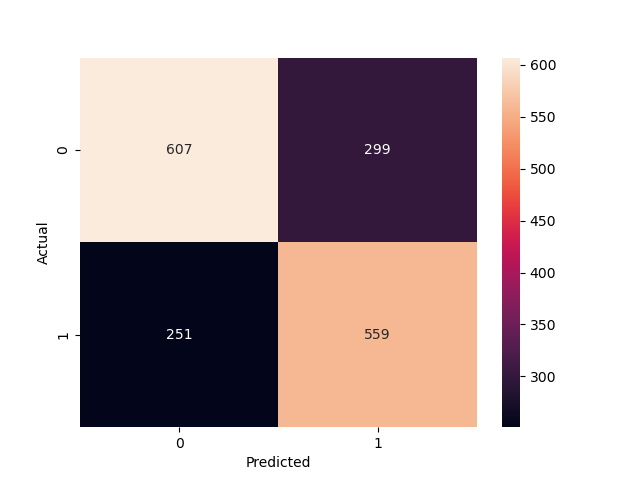
Figure 3: Confusion matrix of test set prediction results.
3.2. Sensitivity Analysis
In financial data analysis, the stability and generalization ability of a model is very important [13]. In order to further assess the robustness of the GAT model in AML tasks, this research conducts a detailed sensitivity analysis, which aims to determine the model's response to different data variations and assess its performance under various conditions.
3.2.1. Volume Analysis
To test the model's sensitivity to variations in data volume, this research randomly generated subsets of 2000, 3000, and 4000 transaction records to evaluate the model's performance. This approach aims to assess the model's stability and check for signs of overfitting or underfitting.
Table 4: Comparison of model performance with different amount of data.
Data Volume | Accuracy | Recall Rate | F1-score |
2000 | 0.70 | 0.67 | 0.71 |
3000 | 0.68 | 0.64 | 0.68 |
4000 | 0.65 | 0.60 | 0.65 |
As illustrated in the Table 4, with 2000 records, the model performs best, achieving an accuracy of 0.70, recall of 0.67, and an F1 score of 0.71, indicating that it classifies effectively with smaller datasets. However, the superior performance suggests potential overfitting. As the data volume increases to 3000 records, the accuracy drops slightly to 0.68, with recall at 0.64 and F1 score at 0.68, reflecting a more stable performance, and the model seems to generalize better at this data level. When the data volume increases to 4000 records, the model's performance declines further, with accuracy falling to 0.65, recall to 0.60, and the F1 score to 0.65, suggesting underfitting as the model struggles to capture the complex patterns in larger datasets.
3.2.2. Feature Importance Analysis
In order to further understand the behaviour of the model, this research analysed the importance of the features and assessed the performance of the model after removing certain features by calculating the extent to which each feature affects the model predictions. The analysis of the importance of features helps to identify which features are most critical to model performance (as shown in Table 5), thus providing further direction for optimisation.
Table 5: Importance scores for different features.
Feature | Importance Score | Accuracy After Removal | Recall Rate After Removal | F1-score After Removal |
Timestamp | 0.25 | 0.68 | 0.62 | 0.67 |
Account | 0.18 | 0.70 | 0.64 | 0.69 |
Payment Format | 0.22 | 0.69 | 0.63 | 0.68 |
Amount Received | 0.15 | 0.67 | 0.60 | 0.66 |
Amount Paid | 0.20 | 0.68 | 0.61 | 0.67 |
This table demonstrates that 'Timestamp' is the most critical feature, with its removal causing the greatest performance drop (accuracy to 0.68, recall to 0.62, F1-score to 0.67). Removing 'Payment Format' also leads to a significant decline (accuracy to 0.69), while 'Account' and 'Payment Amount' cause smaller reductions in performance. For instance, removing ' Amount Paid' drops accuracy to 0.68, but has less impact overall. These findings highlight the importance of 'Timestamp' in optimizing the model, while 'Amount received' has the least effect, guiding better feature selection and model tuning.
3.2.3. Time Period Analysis
The time period sensitivity analysis divides data into "Morning" (6:00-12:00), "Afternoon" (12:00-18:00), and "Evening" (18:00-24:00) intervals. Removing the "Timestamp" showed a more significant impact on model performance in the evening compared to morning and afternoon. This suggests the model relies more on this feature in the evening, highlighting opportunities for optimizing performance based on time of day.
Table 6: Importance scores for different time periods.
Feature | Importance Score | Accuracy After Removal | Recall Rate After Removal | F1-score After Removal |
Timestamp | 0.25 | 0.68 | 0.62 | 0.67 |
Account | 0.18 | 0.70 | 0.64 | 0.69 |
Payment Format | 0.22 | 0.69 | 0.63 | 0.68 |
Amount Received | 0.15 | 0.67 | 0.60 | 0.66 |
Amount Paid | 0.20 | 0.68 | 0.61 | 0.67 |
The Table 6 reveals the feature importance scores, along with the accuracy, recall, and F1 score for each time period. In the morning, the feature importance score is highest at 0.30, with the model performing robustly—achieving an accuracy and F1 score of 0.70. During midday, despite a lower feature importance score of 0.20, the model achieves the highest accuracy (0.72), although the recall is lower at 0.66, indicating a potential bias in the predictions. In the evening, the feature importance score is 0.25, with the model's performance slightly lower than midday, showing a decline in overall prediction effectiveness. These results highlight the significant impact of time-specific features on model accuracy, with morning characteristics contributing most to the model’s success.
3.3. Model Comparison
In this subsection, this research compares the performance of four graph neural network models: GAT, GCN, GraphSAGE, and GIN. By applying these models to the anti-money laundering detection task on the test set data, the accuracy, recall and f1 score of each model are analyzed in detail and their performance is evaluated (as shown in Figure 4).
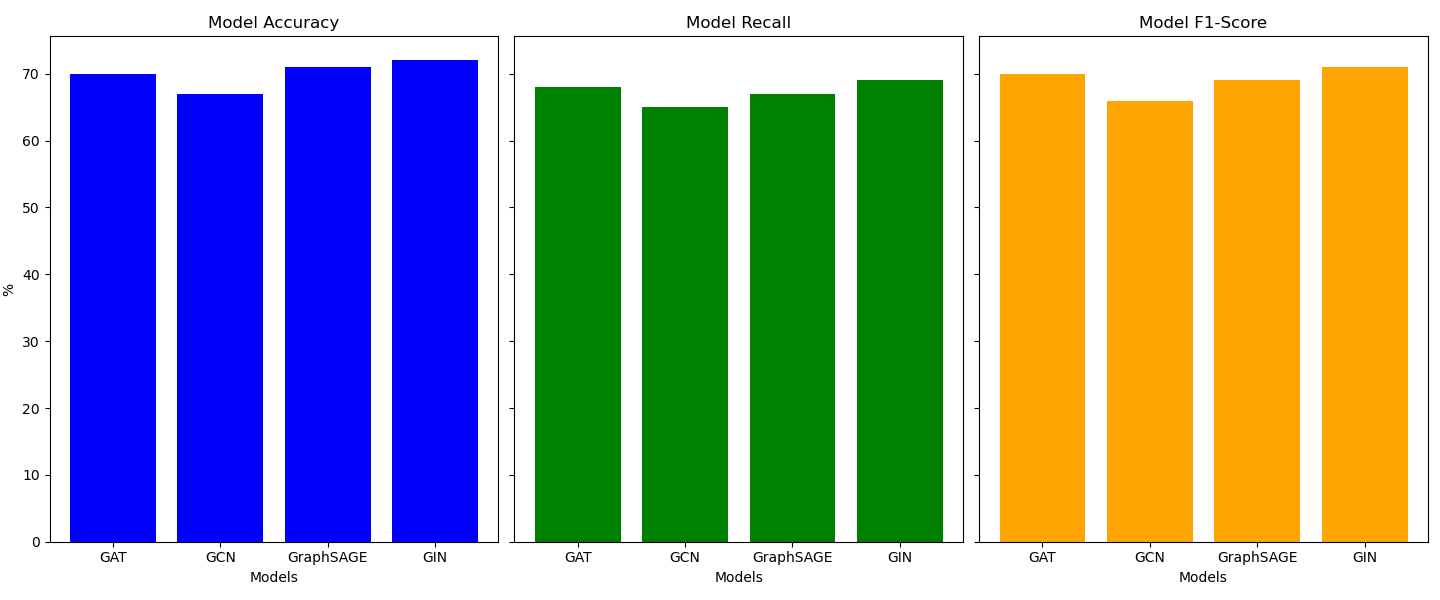
Figure 4: Comparison of different graph neural network models.
The GIN model outperforms others with the highest accuracy (0.72) and F1-score (0.71), showing its ability to classify effectively and balance precision and recall. In contrast, the GAT model excels in recall (0.68), making it particularly effective at detecting money laundering activities, but it has a slightly lower accuracy (0.70) and F1-score (0.70) compared to GIN. While both GIN and GAT demonstrate strong performance, GIN's higher accuracy suggests better overall classification, whereas GAT's higher recall highlights its superior detection of positive instances. Overall, GIN is better at capturing key features and managing complex, nonlinear relationships, while GAT offers enhanced sensitivity to detecting rare events.
4. Conclusion
This research investigates the integration of knowledge graphs and GNNs to strengthen AML efforts, addressing the growing demand for advanced technological solutions in the financial sector. While the GAT model demonstrated strong performance on the training data, it faced challenges in generalization and overfitting on the test data, particularly with larger datasets. Feature analysis underscored the significance of variables like timestamps, offering valuable insights into model optimization and feature selection. Further analyses revealed that the GAT model performed more effectively during morning transaction periods, and suggested that the GIN model may offer superior data processing capabilities under certain conditions. These findings provide practical recommendations for enhancing AML systems through AI-driven methods. Future research could focus on refining the models to improve generalization, paving the way for further advancements in AML technology.
References
[1]. Jack, N., Aditya, K., & Nhien-An, L. (2021) Financial Cybercrime: A Comprehensive Survey of Deep Learning Approaches to Tackle the Evolving Financial Crime Landscape, IEEE Access, 9, 163965-163986.
[2]. Akash, G., Kapil, G., Aman Kumar, P., & Dharm, R. (2024) Fraud Detection Using Machine Learning and Deep Learning, SN Computer Science, 5(7), 1-1.
[3]. Yongshan, Z., Zhiyun, J., Cong, P., Xiumei, Z., & Gang, W. (2024) Management Analysis Method of Multivariate Time Series Anomaly Detection in Financial Risk Assessment, JOURNAL OF ORGANIZATIONAL AND END USER COMPUTING, 36(1), 1-19.
[4]. Liyu, G., & Qiang, C. (2019) Exploiting Edge Features for Graph Neural Networks, Proceedings - IEEE Computer Society Conference on Computer Vision and Pattern Recognition, 9211-9219
[5]. Simone, M., & Stefano, F. (2024) Anti-Money Laundering in Cryptocurrencies Through Graph Neural Networks: A Comparative Study, 2024 IEEE 21st Consumer Communications & Networking Conference, 272-277.
[6]. Wu B, Chao K M, Li Y. (2024) Heterogeneous graph neural networks for fraud detection and explanation in supply chain finance. Information Systems, 121, 102335.
[7]. Ahmad Naser, E., Jacopo, B., David, A., David, P., João Tiago, A., Pedro, B., & Pedro, R. (2021) Anti-Money Laundering Alert Optimization Using Machine Learning with Graphs, CoRR, abs/2112.07508
[8]. Wu, Z., Pan, S., Long, G., Jiang, J., Chang, X., & Zhang, C. (2020) Connecting the Dots: Multivariate Time Series Forecasting with Graph Neural Networks, KDD '20: The 26th ACM SIGKDD Conference on Knowledge Discovery and Data Mining Virtual Event CA USA July, 2020, abs/2005.11650, 753-763.
[9]. Qingyu, G., Fuzhen, Z., Chuan, Q., Hengshu, Z., Xing, X., Hui, X., & Qing, H. (2022) A Survey on Knowledge Graph-Based Recommender Systems, IEEE Transactions on Knowledge and Data Engineering, 34(8), 3549-3568.
[10]. Shaoxiong, J., Shirui, P., Erik, C., Pekka, M., & Philip S., Y. (2022) A Survey on Knowledge Graphs: Representation, Acquisition, and Applications, IEEE Transactions on Neural Networks and Learning Systems, 33(2), 494-514.
[11]. Rui, C., & Qing, L. (2021) Modeling The Momentum Spillover Effect For Stock Prediction Via Attribute-Driven Graph Attention Networks, AAAI Conference on Artificial Intelligence, 35, 55-62.
[12]. Nadia, P., Mirko, Z., Fabio, M., Muhammad Zohaib, S., & Stefano, F. (2023) Detecting anomalous cryptocurrency transactions: An AML/CFT application of machine learning-based forensics, Electronic Markets, 33(1), 1-17.
[13]. Matthias, T., Carolina Raquel, M., & Edin, I. (2021) Measuring and Mitigating Systemic Risks: How the Forging of New Alliances Between Central Bank and Academic Economists Legitimize the Transnational Macroprudential Agenda, Review of international political economy, 28(6), 1433-1458.
Cite this article
Yu,Q. (2024). Enhancing Anti-Money Laundering Systems Using Knowledge Graphs and Graph Neural Networks. Advances in Economics, Management and Political Sciences,118,280-288.
Data availability
The datasets used and/or analyzed during the current study will be available from the authors upon reasonable request.
Disclaimer/Publisher's Note
The statements, opinions and data contained in all publications are solely those of the individual author(s) and contributor(s) and not of EWA Publishing and/or the editor(s). EWA Publishing and/or the editor(s) disclaim responsibility for any injury to people or property resulting from any ideas, methods, instructions or products referred to in the content.
About volume
Volume title: Proceedings of the 3rd International Conference on Financial Technology and Business Analysis
© 2024 by the author(s). Licensee EWA Publishing, Oxford, UK. This article is an open access article distributed under the terms and
conditions of the Creative Commons Attribution (CC BY) license. Authors who
publish this series agree to the following terms:
1. Authors retain copyright and grant the series right of first publication with the work simultaneously licensed under a Creative Commons
Attribution License that allows others to share the work with an acknowledgment of the work's authorship and initial publication in this
series.
2. Authors are able to enter into separate, additional contractual arrangements for the non-exclusive distribution of the series's published
version of the work (e.g., post it to an institutional repository or publish it in a book), with an acknowledgment of its initial
publication in this series.
3. Authors are permitted and encouraged to post their work online (e.g., in institutional repositories or on their website) prior to and
during the submission process, as it can lead to productive exchanges, as well as earlier and greater citation of published work (See
Open access policy for details).
References
[1]. Jack, N., Aditya, K., & Nhien-An, L. (2021) Financial Cybercrime: A Comprehensive Survey of Deep Learning Approaches to Tackle the Evolving Financial Crime Landscape, IEEE Access, 9, 163965-163986.
[2]. Akash, G., Kapil, G., Aman Kumar, P., & Dharm, R. (2024) Fraud Detection Using Machine Learning and Deep Learning, SN Computer Science, 5(7), 1-1.
[3]. Yongshan, Z., Zhiyun, J., Cong, P., Xiumei, Z., & Gang, W. (2024) Management Analysis Method of Multivariate Time Series Anomaly Detection in Financial Risk Assessment, JOURNAL OF ORGANIZATIONAL AND END USER COMPUTING, 36(1), 1-19.
[4]. Liyu, G., & Qiang, C. (2019) Exploiting Edge Features for Graph Neural Networks, Proceedings - IEEE Computer Society Conference on Computer Vision and Pattern Recognition, 9211-9219
[5]. Simone, M., & Stefano, F. (2024) Anti-Money Laundering in Cryptocurrencies Through Graph Neural Networks: A Comparative Study, 2024 IEEE 21st Consumer Communications & Networking Conference, 272-277.
[6]. Wu B, Chao K M, Li Y. (2024) Heterogeneous graph neural networks for fraud detection and explanation in supply chain finance. Information Systems, 121, 102335.
[7]. Ahmad Naser, E., Jacopo, B., David, A., David, P., João Tiago, A., Pedro, B., & Pedro, R. (2021) Anti-Money Laundering Alert Optimization Using Machine Learning with Graphs, CoRR, abs/2112.07508
[8]. Wu, Z., Pan, S., Long, G., Jiang, J., Chang, X., & Zhang, C. (2020) Connecting the Dots: Multivariate Time Series Forecasting with Graph Neural Networks, KDD '20: The 26th ACM SIGKDD Conference on Knowledge Discovery and Data Mining Virtual Event CA USA July, 2020, abs/2005.11650, 753-763.
[9]. Qingyu, G., Fuzhen, Z., Chuan, Q., Hengshu, Z., Xing, X., Hui, X., & Qing, H. (2022) A Survey on Knowledge Graph-Based Recommender Systems, IEEE Transactions on Knowledge and Data Engineering, 34(8), 3549-3568.
[10]. Shaoxiong, J., Shirui, P., Erik, C., Pekka, M., & Philip S., Y. (2022) A Survey on Knowledge Graphs: Representation, Acquisition, and Applications, IEEE Transactions on Neural Networks and Learning Systems, 33(2), 494-514.
[11]. Rui, C., & Qing, L. (2021) Modeling The Momentum Spillover Effect For Stock Prediction Via Attribute-Driven Graph Attention Networks, AAAI Conference on Artificial Intelligence, 35, 55-62.
[12]. Nadia, P., Mirko, Z., Fabio, M., Muhammad Zohaib, S., & Stefano, F. (2023) Detecting anomalous cryptocurrency transactions: An AML/CFT application of machine learning-based forensics, Electronic Markets, 33(1), 1-17.
[13]. Matthias, T., Carolina Raquel, M., & Edin, I. (2021) Measuring and Mitigating Systemic Risks: How the Forging of New Alliances Between Central Bank and Academic Economists Legitimize the Transnational Macroprudential Agenda, Review of international political economy, 28(6), 1433-1458.