


1.Introduction
In the financial markets, stock price forecasting is critical, particularly for well-known firms like Mercedes-Benz. Precise projections of stock prices may offer financial experts and investors significant perspectives to facilitate better decision-making. Because of their simplicity and capacity to identify linear trends in time series data, models like the Autoregressive Integral Sliding Average (ARIMA) model have historically been employed extensively [1]. But these models frequently find it difficult to account for the financial markets' innate nonlinearity and volatility [2]. As machine learning develops, more sophisticated models like Random Forests (RF) and Long Short-Term Memory Networks (LSTM) hold considerable potential for handling complex non-linear correlations in stock market data [3]. The goal of this study is to provide a comprehensive analysis and comparison of several models in order to determine the most effective strategy for Mercedes-Benz stock price prediction.
Research on stock price forecasting has been quite significant. Because ARIMA can simulate and forecast linear patterns in past data, it is frequently utilized [1]. Even with its widespread use, ARIMA frequently performs poorly in erratic markets, which leads to the hunt for substitutes [2].
The adaptability and enhanced stock price prediction performance of machine learning techniques have drawn interest. Strong prediction skills have been shown in multiple experiments by the potent integrated learning technique RF, and RF is very good at managing high-dimensional data and identifying intricate feature interactions that conventional models frequently miss [4]. In a similar vein, RF offers more accuracy in financial forecasting after comparing it to Support Vector Machines (SVM) [5].
There has been a lot of interest in research because LSTM, a form of Recurrent Neural Network (RNN), can detect long-term relationships in sequential data [3]. Fischer and Krauss demonstrate how LSTM networks perform better in time dependence modeling for stock price prediction than conventional techniques like ARIMA [3]. Additional research by Krollner and Wadi emphasizes the benefits of LSTM in handling the serial nature of financial data [6,7].
Comparative studies highlight how much better machine learning models are than more conventional techniques. In their evaluation of the efficacy of ARIMA, Artificial Neural Network (ANN), and SVR, for example, Guresen and Daim found that machine learning models frequently provided better prediction accuracy [8]. Furthermore, research conducted by Patel and Kotecha reinforced the general agreement that machine learning methods, specifically RF and LSTM, offer more reliable and accurate forecasts in a complex and unstable stock market setting [9].
In order to estimate Mercedes-Benz stock values, this study compares the predictive powers of the RF, LSTM, and ARIMA models. ARIMA is used at the start of the study to identify linear patterns in the data. Next, long-term dependencies within the time series are modeled using LSTM, and non-linear correlations are taken into account using RF. To assess the predicted accuracy of the models, performance measurements like Mean Square Error (MSE) and Root Mean Square Error (RMSE) are used. The results highlight the promise of sophisticated machine learning methods, especially in financial forecasting, and offer investors and financial experts’ insightful information.
2.Methodology
2.1.Dataset Description and Preprocessing
The Mercedes-Benz Historical Stock Dataset, which was obtained from Kaggle, is the dataset utilized in this investigation [10]. The models used in the study require this dataset in order to be trained and evaluated. Data preprocessing entailed removing outliers and missing values from the data. To preserve data integrity, missing data points were either imputed or removed, and outliers were recognized and dealt with properly. To improve the prediction ability of the model, feature engineering was used to create new variables, such as the 20-day and 50-day Simple Moving Averages (SMA) and daily returns.
2.2.Proposed Approach
Developing several machine learning models for Mercedes-Benz stock price prediction is the primary goal of this project. Figure 1 shows the main stages of the study methodology: feature engineering, model creation, assessment, and data preparation. Three models—ARIMA, RF, and LSTM networks—are compared in this study. As each model has unique advantages and disadvantages, the objective is to choose the model with the best prediction accuracy for Mercedes-Benz stock prices. After preprocessing the raw data, the pipeline extracts feature that identify significant trends in stock price movements. To ascertain the models' efficacy, they are subsequently trained and assessed using predetermined metrics.

Figure 1: The pipeline of the model.
2.2.1.ARIMA Model
Traditional time series forecasting techniques like the ARIMA model are used to identify trends and seasonality in stock price movements. The simplicity and comprehensibility of the ARIMA model have made it well-liked. Because the method makes predictions about future values based on past values of a time series, it is suitable for data sets that show a consistent pattern across time.
In this study, the time series is first ensured to be stationary using differencing before the ARIMA model is utilized to forecast Mercedes-Benz stock prices. The next step is examining autocorrelation and partial autocorrelation plots to ascertain the proper p and q values. The ARIMA model is then trained using these variables, and its validity is checked by contrasting anticipated and real stock prices. Although the ARIMA model is helpful for capturing long-term trends and cyclical tendencies, it has limitations when it comes to non-linear patterns and market volatility. For comparative analysis, ARIMA is a helpful baseline model due to its inherent simplicity. However, considering the complexity of the stock market, more advanced models like RF and LSTM are also believed to increase forecast accuracy. Despite these limitations, the ARIMA model remains a valuable tool for detecting and forecasting patterns in financial time series data.
2.2.2.Random Forest Model
The average forecast of all the decision trees combined is produced by the ensemble learning method known as RF, which creates several decision trees during training. It is particularly appropriate for stock price prediction because of its remarkable effectiveness in processing high-dimensional data and capturing complex non-linear feature interactions. The RF model's resilience is enhanced by its ability to reduce overfitting and increase prediction accuracy by averaging the results of several decision trees.
The RF model was trained in this study using preprocessed stock price data for Mercedes-Benz. Daily returns and 20- and 50-day SMAs were used as training data for the model. The optimal values for parameters such the number of trees, maximum tree depth, and minimum samples required for segmentation were discovered by employing a grid search technique in order to enhance the model's performance. When it comes to predicting accuracy, the RF model often outperforms more basic models like ARIMA, showing higher ability in finding complex patterns and correlations within data sets. The model can manage interactions between features and non-linear relationships, which given the extremely volatile and complicated environment of the stock market. Although the RF model requires greater computational resources, its flexibility and predictive power make it an excellent candidate for accurately predicting stock prices in this study.
2.2.3.LSTM Network
Continuous dependencies are recognized and recorded by specialized RNNs known as LSTM networks. LSTM networks perform very well in period-series prediction problems, such as stock market forecasting, since the model needs to hold onto previous data for a considerable amount of time in order to provide a prediction that is accurate. The LSTM's unique design enables it to get around the gradient vanishing problem that traditional RNNs have by employing memories that can store data for long periods of time. The LSTM's unique design enables it to get around the gradient vanishing problem that traditional RNNs have by employing memory cells that can store data for long periods of time.
In this work, Mercedes-Benz serial stock price data is processed using LSTM networks. The sliding window method is used to organize the data as sequences, with each input sequence corresponding to a distinct historical price time window. The LSTM network may predict future prices by using previous patterns after processing these sequential inputs. The network's architecture consists of several LSTM layers, with the ultimate prediction being produced by the dense layers. LSTM networks are a potent forecasting tool because they are good at identifying dependencies in stock price. In many situations, LSTM networks outperform more conventional models like ARIMA because of their capacity to simulate the continuity of stock prices while accounting for trends. For the purpose of evaluating forecasting methods in this study, LSTM is a crucial model despite being computationally demanding due to its high predictive accuracy.
2.3.Implementation Details
The system is written in Python and makes use of libraries like TensorFlow for LSTM, scikit-learn for RF, and pandas for data processing. The system employs data augmentation techniques, including adding noise to the training set, to make the model more resilient. In order to optimize every model's performance, hyperparameter tuning makes use of grid search to optimize variables like learning rate, tree depth, and number of LSTM cells.
3.Result and Discussion
In order to anticipate the price of Mercedes-Benz shares, three machine learning models were compared and analyzed. The results are shown in this section: ARIMA, RF, and LSTM. As seen in the tables and figures, the accuracy, advantages, and disadvantages of each model's performance are examined.
3.1.Exploratory Data Analysis (EDA)
The purpose of the visualization of data is to gain an in-depth understanding of trends in stock prices. The closing price is drawn in combination with the SMA to visually show the overall trend of the stock and identify potential buy/ sell signals. Before applying more sophisticated prediction models, this visualization is critical to understanding the data's time structure. The matrix used to evaluate the relationship between the characteristics showed that the 50-day SMV was most relevant to the closing price. Figure 2 and Figure 3 show the relationship between the share price and the SMV and the characteristic matrix.
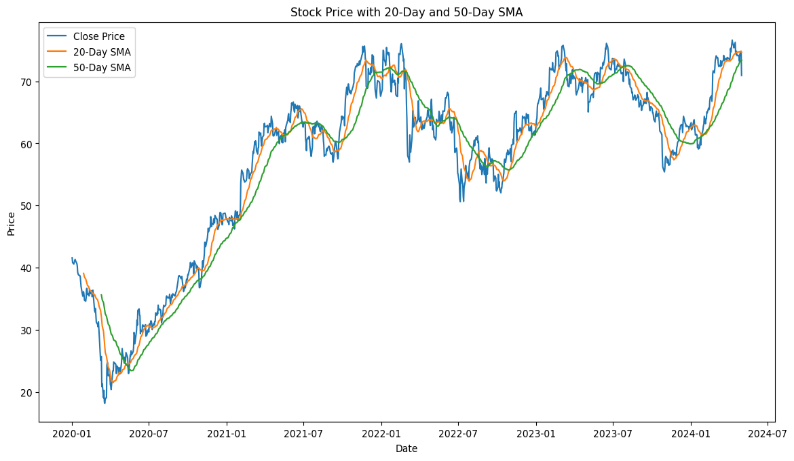
Figure 2: Mercedes-Benz stock price with 20-Day and 50-day SMA.
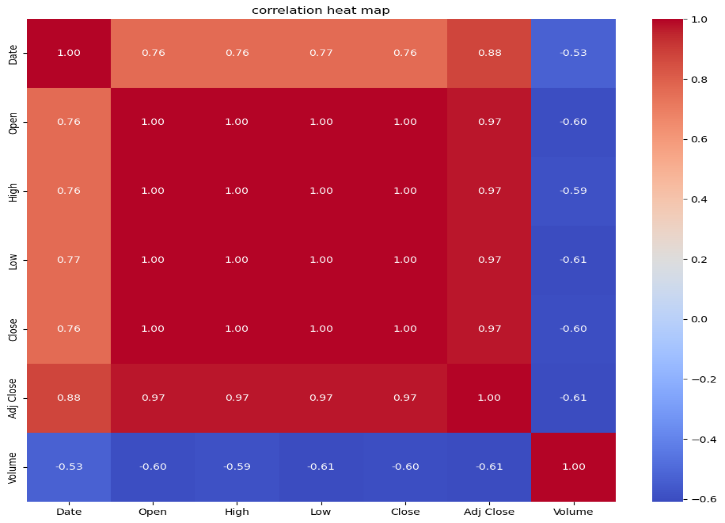
Figure 3: Correlation matrix of features.
3.2.ARIMA Model
Figure 4 illustrates how well the ARIMA model captures the overall trend of Mercedes-Benz stock prices; yet, it is not particularly effective at mitigating short-term volatility. Prices for the stock show an overall increasing trend, and the movements are reflected in the ARIMA model. It is less successful, nevertheless, in circumstances characterized by high volatility and frequent price swings. The ARIMA model's inadequacies in non-linear or highly dynamic market conditions can be largely explained by its reliance on linear assumptions. According to these results, ARIMA might not be the best option for short-term prediction in erratic markets, even though it might be useful for long-term forecasting.
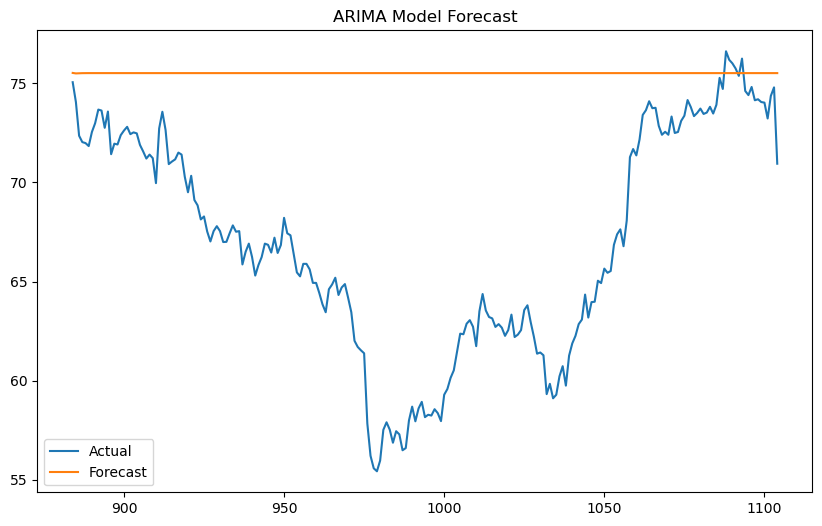
Figure 4: Comparison of model predictions vs actual prices (ARIMA Model).
3.3.Random Forest Model
Figure 5 shows how well the RF model performs when compared to other models. It is especially effective at identifying the patterns present in the stock data. Because of its ability to account for interactions between factors, the RF model exhibits a high degree of accuracy to the real stock price. This can be attributed to its ensemble learning strategy, which combines several decision trees' outputs to produce a prediction that is more accurate. The RF model is robust across a range of market conditions as evidenced by its high accuracy in both short- and long-term projections. Because of the model's adaptability to feature interaction, quick price changes can be predicted with accuracy.
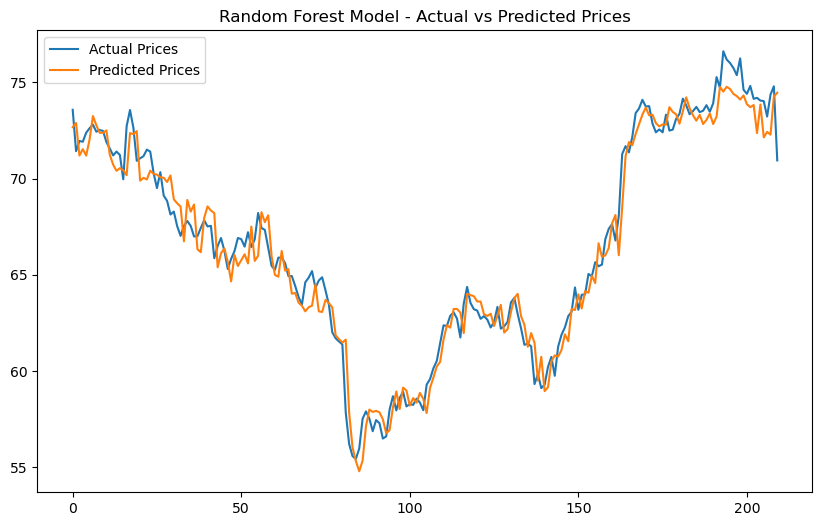
Figure 5: Comparison of Model Predictions vs. Actual Prices (RF Model).
3.4.LSTM Model
Figure 6 illustrates how well the LSTM model captures long-term relationships in the stock price data. The LSTM network is particularly good at two tasks: long-term trend prediction and sequential data modeling. But when it comes to short-term forecasting, the LSTM model does not perform as well as the RF model. The discrepancy can be explained by the model's inability to accurately predict sudden price movements due to its reliance on long-term temporal patterns.
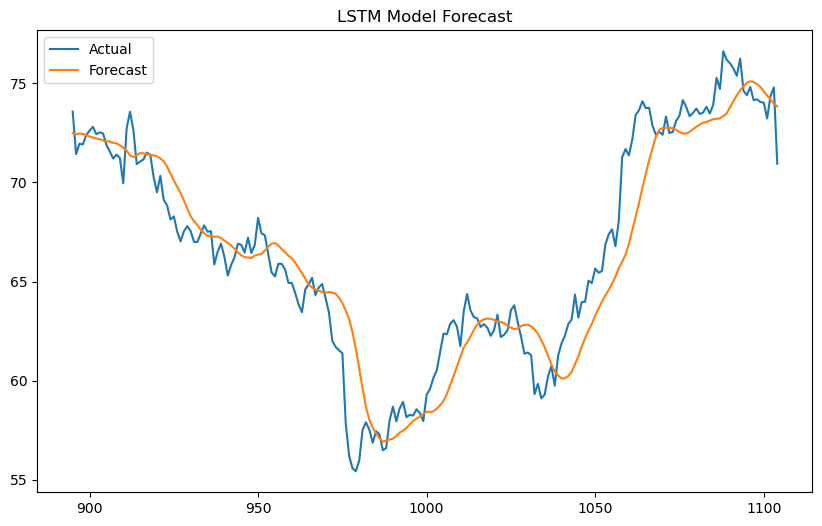
Figure 6: Comparison of model predictions vs actual prices (LSTM Model).
On stock forecasting, it was found that the RF model worked best. The model offers a balanced approach to accuracy, accounting for both short- and long-term perspectives, providing investors with a reliable tool for well-informed decision-making.
4.Conclusion
Three models—RF, LSTM, and ARIMA—were used in this study to anticipate Mercedes-Benz stock values. The RF model excelled in capturing complex non-linear interactions, making it the best performer, particularly for short-term price changes. For long-term trends, the LSTM model performed well. But short-term forecasts yielded lower accuracy. The ARIMA model, although capable of identifying broad trends, struggled with volatility and short-term price fluctuations. In order to increase forecast accuracy, future research will concentrate on integrating macroeconomic indicators and market sentiment data. Furthermore, the application of more sophisticated models, such Transformer networks, may improve stock price predictions even more.
References
[1]. Box, G.E.P., & Jenkins, G.M. (1970) Time Series Analysis: Forecasting and Control. San Francisco: Holden-Day.
[2]. Ariyo, A.A., Adewumi, A.O., & Ayo, C.K. (2014) Stock Price Prediction Using the ARIMA Model. UKSim-AMSS 16th International Conference on Computer Modelling and Simulation, 106-112.
[3]. Fischer, T., & Krauss, C. (2018) Deep learning with long short-term memory networks for financial market predictions. European Journal of Operational Research, 270(2), 654-669.
[4]. Reddy, V.K.S., Sai, K. (2018) Stock market prediction using machine learning. International Research Journal of Engineering and Technology, 5(10), 1033-1035.
[5]. Kumar, M., & Thenmozhi, M. (2006) Forecasting Stock Index Movement: A Comparison of Support Vector Machines and Random Forest. SSRN Electronic Journal, 12, 152.
[6]. Almasarweh, M., & Wadi, S.A. (2018) ARIMA Model in Predicting Banking Stock Market Data. Modern Applied Science, 12(11), 309.
[7]. Krollner, B., Vanstone, B., Finnie, G. (2010) Financial time series forecasting with machine learning techniques: A survey. European Symposium on Artificial Neural Networks: Computational Intelligence and Machine Learning, 25-30.
[8]. Guresen, E., Kayakutlu, G., & Daim, T.U. (2011) Using artificial neural network models in stock market index prediction. Expert Systems with Applications, 38(8), 10389-10397.
[9]. Patel, J., Shah, S., Thakkar, P., & Kotecha, K. (2015) Predicting stock and stock price index movement using trend deterministic data preparation and machine learning techniques. Expert Systems with Applications, 42(1), 259-268.
[10]. Mursaleen, A. (2024) Mercedes-Benz | Historical Stock Dataset. Retrieved on 2024, Retrieved from: https://www.kaggle.com/datasets/innocentmfa/mercedes-benz-historical-stock-dataset
Cite this article
Wang,W. (2024). Comparative Analysis of ARIMA, Random Forest, and LSTM Models for Mercedes-Benz Stock Price Prediction. Advances in Economics, Management and Political Sciences,134,1-8.
Data availability
The datasets used and/or analyzed during the current study will be available from the authors upon reasonable request.
Disclaimer/Publisher's Note
The statements, opinions and data contained in all publications are solely those of the individual author(s) and contributor(s) and not of EWA Publishing and/or the editor(s). EWA Publishing and/or the editor(s) disclaim responsibility for any injury to people or property resulting from any ideas, methods, instructions or products referred to in the content.
About volume
Volume title: Proceedings of the 3rd International Conference on Financial Technology and Business Analysis
© 2024 by the author(s). Licensee EWA Publishing, Oxford, UK. This article is an open access article distributed under the terms and
conditions of the Creative Commons Attribution (CC BY) license. Authors who
publish this series agree to the following terms:
1. Authors retain copyright and grant the series right of first publication with the work simultaneously licensed under a Creative Commons
Attribution License that allows others to share the work with an acknowledgment of the work's authorship and initial publication in this
series.
2. Authors are able to enter into separate, additional contractual arrangements for the non-exclusive distribution of the series's published
version of the work (e.g., post it to an institutional repository or publish it in a book), with an acknowledgment of its initial
publication in this series.
3. Authors are permitted and encouraged to post their work online (e.g., in institutional repositories or on their website) prior to and
during the submission process, as it can lead to productive exchanges, as well as earlier and greater citation of published work (See
Open access policy for details).
References
[1]. Box, G.E.P., & Jenkins, G.M. (1970) Time Series Analysis: Forecasting and Control. San Francisco: Holden-Day.
[2]. Ariyo, A.A., Adewumi, A.O., & Ayo, C.K. (2014) Stock Price Prediction Using the ARIMA Model. UKSim-AMSS 16th International Conference on Computer Modelling and Simulation, 106-112.
[3]. Fischer, T., & Krauss, C. (2018) Deep learning with long short-term memory networks for financial market predictions. European Journal of Operational Research, 270(2), 654-669.
[4]. Reddy, V.K.S., Sai, K. (2018) Stock market prediction using machine learning. International Research Journal of Engineering and Technology, 5(10), 1033-1035.
[5]. Kumar, M., & Thenmozhi, M. (2006) Forecasting Stock Index Movement: A Comparison of Support Vector Machines and Random Forest. SSRN Electronic Journal, 12, 152.
[6]. Almasarweh, M., & Wadi, S.A. (2018) ARIMA Model in Predicting Banking Stock Market Data. Modern Applied Science, 12(11), 309.
[7]. Krollner, B., Vanstone, B., Finnie, G. (2010) Financial time series forecasting with machine learning techniques: A survey. European Symposium on Artificial Neural Networks: Computational Intelligence and Machine Learning, 25-30.
[8]. Guresen, E., Kayakutlu, G., & Daim, T.U. (2011) Using artificial neural network models in stock market index prediction. Expert Systems with Applications, 38(8), 10389-10397.
[9]. Patel, J., Shah, S., Thakkar, P., & Kotecha, K. (2015) Predicting stock and stock price index movement using trend deterministic data preparation and machine learning techniques. Expert Systems with Applications, 42(1), 259-268.
[10]. Mursaleen, A. (2024) Mercedes-Benz | Historical Stock Dataset. Retrieved on 2024, Retrieved from: https://www.kaggle.com/datasets/innocentmfa/mercedes-benz-historical-stock-dataset