


1. Introduction
Apple was created by many people, and while the mythos around the company is all about Steve Jobs being a sort of brilliant demigod who chose what he wanted to be successful (even though it didn't quite work out that way on his first shot. And second.), for sure there are others involved with Apple's success. Originally founded in 1971(and not official until 1977), Apple started with the Blue Box; Wozniak and Jobs first project, a device which emulated the tones of a telephone system allowing for free long-distance calls [1]. While this project did not result in the eventual creation of Apple, it was an effort that allowed work between these two creators and gave them a solid foundation for their knowledge of tech and marketing. It initiated the era of personal computing when, in 1976, their Apple I became the first personal computer. That success led to the Apple II, which made Apple a household name and introduced the personal computer revolution in the mid- to late 1970s and early 1980s. The first-generation iPhone was released on June 29, 2007 and Apple went from a billion-dollar company to multi-billion dollar company over night. To date, Apple has sold more than 2 billion iphone [2], with the sale of smartphones is too large and influential to ignore.
Over the decades, Apple has enjoyed success in both business and technology, but there are many factors that can drive change in a company's stock price: market demand; level of technological innovation; the company's profitability; macroeconomic conditions, etc. The ability to predict the long-term stock price movements of Apple is essential practice for many in investing and analytics. In such cases Time series analysis models like ARIMA (Auto-Regressive Integrated Moving Average) turn out to be a handy tool.
ARIMA model is a technique used for time series data analysis and prediction, generally used for short range forecasting of financial markets. It forecasts future data movements by reviewing historical trends and seasonal patterns[3]. ARIMA models have been applies: to explain and forecast the behavior of demand; to predict foreign exchange rates, and stock prices; in forecasting economic growth among others. Nevertheless, while the ARIMA model excels in short-term forecasting, it can be rather limited for long term points of time. With the high volatility and non-linearity nature of stock market, it is a norm that if using ARIMA model to long-term prediction will filled with large normal noise with abnormal market fluctuations which caused the long-term prediction become fake as well [3].
This study is however aiming to forecast stock price of Apple by the ARIMA model in next year and to discover the reasonability and limitation for prediction mechanisms with that allowable precision. In this article, we are going to use the historical stock data of Apple to — analyze it, build an ARIMA model using it and access its performance on short term as well as long term prediction. Specifically we will seek to uncover why the ARIMA model is not suited for long-term market forecasting, and suggest present avenues for enhancement. Based on this analysis, the study can serve as a reference for investors and market analysts, in addition to a novel theoretical perspective for future studies of stock market prediction methods.
According to the analysis and findings of this research, information in ARIMA models are useful tool for forecasting the stock but its restricted to long term trend forecasting. The model struggles to handle the dynamic and non-stationary nature of financial markets due to linear assumptions. As a result of this internal rigidity, ARIMA may struggle to capture the interaction between many different factors in the market, not least of which are economic changes taking effect last minute, the rapid emergence of political events that were unforeseen ahead of time or even completely novel products that send the marketplace into chaos. So, when it comes to long-term forecast, ARIMA models might give incorrect or misleading forecast because they can easily be manipulated by noise and abnormal fluctuation. This study advocates for further studies to combine ARIMA with more sophisticated models such as machine learning approaches and GARCH, which are better in capturing the volatility and non-linear patterns. These hybrid models can offer a model robustness towards the prediction of long-term trend on highly volatile markets like stock market.
2. Analyze approaches
2.1. ARMA model
Based on George E.P. Box and Gwilym Jenkins in 1970. Autoregressive moving average model (ARMA model) is a kind of time series model. This model describes a stationary stochastic process by means of two polynomials.
One is for autoregression (AR): to capture momentum and mean-reverting effects that are common in trading markets:
\( {X_{t}}=c+{ϕ_{1}}{X_{t-1}}+{ϕ_{2}}{X_{t-2}}+…+{ϕ_{p}}{X_{t-p}}+{ϵ_{t}} \) (1)
The other is used as a moving average (MA) to reflect the shock effect in white noise:
\( {X_{t}}=μ+{ϵ_{t}}+{θ_{1}}{ϵ_{t-1}}+{θ_{2}}{ϵ_{t-2}}+…+{θ_{q}}{ϵ_{t-q}} \) (2)
The ARMA(p, q) model is actually a combination of the autoregressive model AR(p) and the moving average model MA(q):
\( {X_{t}}=c+{ϕ_{1}}{X_{t-1}}+{ϕ_{2}}{X_{t-2}}+…+{ϕ_{p}}{X_{t-p}}+{ϵ_{t}}+{θ_{1}}{ϵ_{t-1}}+{θ_{2}}{ϵ_{t-2}}+…+{θ_{q}}{ϵ_{t-q}} \) (3)
2.2. ARIMA model extension
Auto regressive integrated moving average (ARIMA)Extend ARMA to fit non-stationary time series data. With the Differencing Step in ARIMA model: In case of a time series data having trend or nonstationarity, ARIMA model can be used. The general representation of the ARIMA model is written as ARIMA(p,d,q) where :
(a). p is the number of lags in the autoregressive (AR) term, which refers to a linear combination of the first p observations in the time series;
(b). d is the order of the difference (I) term, which makes it possible that non-stationary data can be transformed in stationary data.
(c). The rate of the moving average (MA) term is denoted by q, which includes error terms up to its first q.
The ARIMA model will have the following mathematical representation.
\( (1-{ϕ_{1}}B-{ϕ_{2}}{B^{2}}-⋯-{ϕ_{p}}{B^{p}})(1-B{)^{d}}{X_{t}}=(1+{θ_{1}}B+{θ_{2}}{B^{2}}+⋯+{θ_{q}}{B^{q}}){ϵ_{t}} \) (4)
3. ARIMA analyzation
ARIMA has been a popular statistical model that used for many time series analysis and forecasting since its method being applied to analyze the US economic, especially in business and finance with some application like sales data forecast or weather forecast [4]. The ARIMA model is preferred for many forecasting tasks because of its flexibility in handling different types of data, including those which follow a trend or seasonal pattern.
Stock marketApplication of ARIMA model to short-term prediction of stock price or index. Its advantage is to capture the short-term fluctuations and change patterns in an agile way, which can be regarded as a provisionally reference for investors as well as analysts. Nevertheless, despite that, the ARIMA model also has its limits; when it encounters long term prediction generation, compared to other FAI models or their families, the ARIMA is bypassed regarding taking place its calculation during data contamination and events that have been no history to be modeled with previous cycles of time-frame variables. 2. Analysis of apple stock price
In R we can use the following code to plot the time sequence of raw data as below.
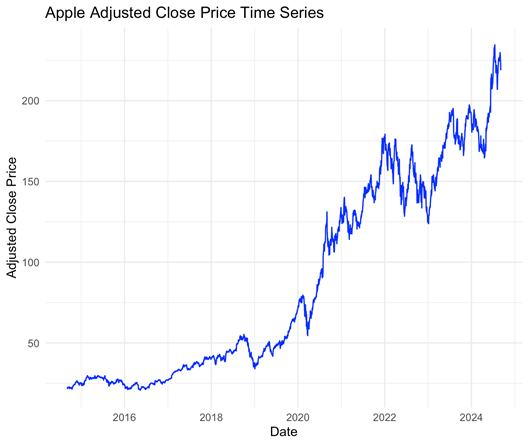
Figure 1: The Apple Adjusted close price time series (Picture credit: Original)
Figure 1 indicates a clear upward trend in Apple’s stock prices over the observed period.
And the D-F coefficient is -2.325, and its absolute value is between 5% and 10%level, so the data can be considered to be close to stable, but not very stable. Therefore, in order to ensure the absolute stability of the data, the logarithm of the data can be differentially processed, and the Figure2 can be obtained:
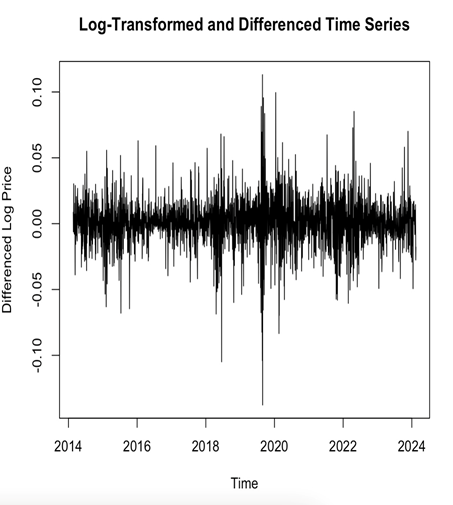
Figure 2: Log-transformed and differenced time series (Picture credit: Original)
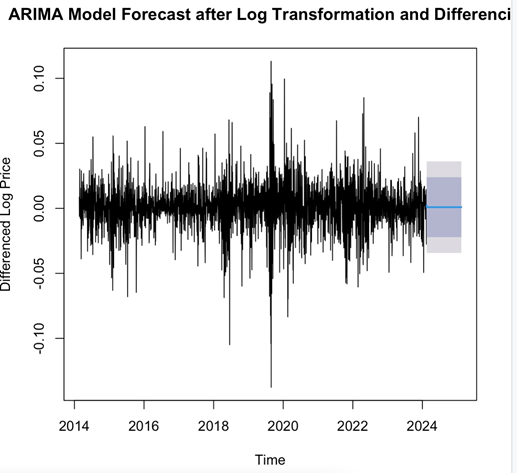
Figure 3: ARIMA forecast after Log-transformed and difference (Picture credit: Original)
At this time, it was found that the D-F coefficient was far less than -3.4435, and the P-value was equal to 0.01, which proved that there was a 99% probability to reject the null hypothesis and that the data were stable.
After the data are stable, ARIMA prediction can be performed on the data. The following results were obtained:
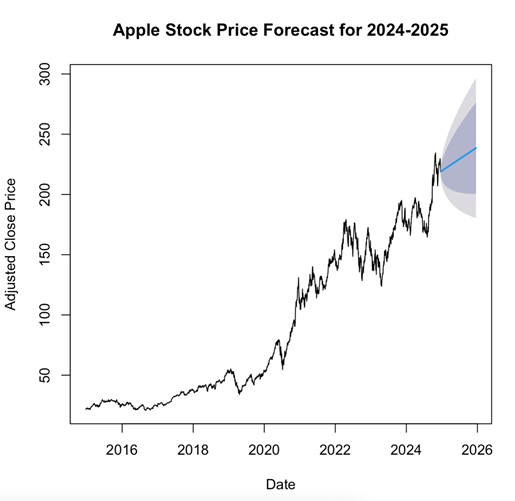
Figure 4: Apple stock price forecast for 2024-2025 (Picture credit: Original)
Through the ARIMA prediction graph, Figure 4, because ARIMA is a linear function, only the approximate range of future data can be obtained. However, from the parameters given by ARIMA, it is found that ME is very small, almost close to zero, and the deviation of model prediction is small. However, the AIC value has been exaggerated to -13089.33, which proves that the fitting accuracy of the model is very high.
4. Improvement and suggestion
By starting analysis by looking at the historical stock price trend of Apple from 2014 to 2024, in this article, the authors estimated the Apple stock price in 2024–2025 by an ARIMA model. It gets future stock price forecasts from a wide range. And this is also, where the disadvantages of ARIMA get exposed. Anyway, if those data just linear mannered well ARIMA would work perfectly, and it can be the huge disappointment in case you have only non-linear but exploding out data like volatility values. Great that we can fit non-trending series though catching trend exposed by unit root fails. Second, ARIMA takes a long time to predict data in the long run. Moreover, the ARIMA model is a very slow learner and requires a large assumption of historical data to make predictions thus it has high static utilization tendency. If a model cannot adapt in time due to radical changes in the market environment or company conditions, then we could see large prediction discrepancies [5].
The ARIMA model is a linear regression fitting model, but the data in the market are for the most part non-linear" crypto quality. However, if the prediction results are to be accurate, you need the data processed either without any time lag or missing[6]. Thus, the analysis that follows only serves a preliminary prediction analysis. Too many out-of-house specifics come and go un-examined.
Moreover, since ARIMA model can only describe linear structure as well, GARCH model which is able to represent volatility data [7], is as a result of that more suitable candidate to refine better the model. The values predicted by the models can be compared and the model with prediction of data closest to true value will be preferred more by researchers [8].
Though historically the benchmark index types have demonstrated relatively low returns relative to risk in all the Table, brand index in all tables show decent performance compared to the other benchmarks [9]. Investors need to stay away from conformity and rather follow the common sense of investing in clearly important stock companies. Meanwhile, ARIMA model can improve the prediction reliability by adding extra nonlinear data processing models for more accurate market trend prediction. Moreover, having high-quality companies which have good fundamentals and strong growth prospects would be a wise approach to keep them over an extended period. When these methods are combined together then investors can better make decisions to get maximum benefits on their investment but with minimum risk [10].
5. Conclusion
In conclusion, this study showed that the ARIMA model is useful for forecasting Apple stock price in the short term, but on long-term market behavior its limitations are highlighted. The linear dependence of the model is inefficient to tackle the nonlinearity and high volatility that are inherent in financial market prices. Moreover, since the ARIMA model relies on historical data patterns to predict future sales, it is likely to react inertly if drastic market shifts occur or unforeseen scenarios arise and hence may produce inaccuracies in its forecasts.
In this sense, other more advanced models such as Garch-type or Machine Learning based ones could likely joint with ARIMA to reduce the stock market volatility. ARIMA could be combined with machine learning methods or other nonlinear models to give insight on the secular trends. Furthermore, it is recommended to not use ARIMA alone for long-term forecasting based on this study and consider ARIMA as a complement to other tools in the armamentarium of investors. If they would diversify forecasting methods and also mix quantitative with qualitative analysis of market conditions, we would have a more fair investment strategy.
In any case, no matter how bad ARIMA models are performing, they may still be a good player in early trend analysis which is strong enough to give us an omen of the beef or flag of stocks on a short-term basis. Going forward, there is a clear need for further research which can investigate hybrid models of ARIMA alongside stronger forecasting techniques that can make them more useful in broader potential financial forecasting contexts. These will be of great help for Investors to react better in complex and uncertain market dynamics and optimize the decision-making process that reduces risks.
References
[1]. Kubilay, İ.A. (2015) The Founding of Apple and the Reasons Behind Its Success. Procedia-Social and Behavioral Sciences, 195, 2019-2028.
[2]. Li, T. (2024) Apple: A Clever Integration of Psychology and Scientific Marketing. International Journal of Global Economics and Management, 3(2), 280-285.
[3]. Peng, J., Deng, C., & Chen, Y.C. (2022) Application of ARIMA Time Series Model in Stock Data Prediction. In International Conference on Intelligent Information Hiding and Multimedia Signal Processing, 341, 223-232
[4]. Shumway, R. H., Stoffer, D. S., Shumway, R. H., & Stoffer, D. S. (2017). ARIMA models. Time series analysis and its applications: with R examples, 75-163.
[5]. Yıldırım, E., & Cengiz, M. A. (2022). Modeling and Forecasting of USD/TRY Exchange Rate Using ARMA-GARCH Approach. İstatistik Araştırma Dergisi, 12(2), 1-13.
[6]. Guo, K., Jiang, Z., & Zhang, Y. (2023). Prediction of S&P500 Stock Index Using ARIM and Linear Regression. Highlights in Science, Engineering and Technology, 38, 399-407.
[7]. Xu, S., & Liang, X. (2019) Research on Stock Price Prediction Based on ARIMA-GARCH Model. Journal of Henan Institute of Education (Natural Science Edition), 28(04), 20-24.
[8]. Trivez, F.J., & Catalan, B. (2009) Detecting Level Shifts in ARMA-GARCH (1, 1) Models. Journal of Applied Statistics, 36(6), 679-697.
[9]. Bank, S., & Yazar, E.E. (2023) Brand Index: A New Suggestion for Stock Market Indices. International Journal of Economics and Business Research, 26(2), 179-200.
[10]. Yagi, I., Masuda, Y., & Mizuta, T. (2020) Analysis of the Impact of High-Frequency Trading on Artificial Market Liquidity. IEEE Transactions on Computational Social Systems, 7(6), 1324-1334.
Cite this article
Cao,E. (2024). Predicting Apple Stock Price Based on ARIMA Model. Advances in Economics, Management and Political Sciences,141,200-205.
Data availability
The datasets used and/or analyzed during the current study will be available from the authors upon reasonable request.
Disclaimer/Publisher's Note
The statements, opinions and data contained in all publications are solely those of the individual author(s) and contributor(s) and not of EWA Publishing and/or the editor(s). EWA Publishing and/or the editor(s) disclaim responsibility for any injury to people or property resulting from any ideas, methods, instructions or products referred to in the content.
About volume
Volume title: Proceedings of ICFTBA 2024 Workshop: Finance's Role in the Just Transition
© 2024 by the author(s). Licensee EWA Publishing, Oxford, UK. This article is an open access article distributed under the terms and
conditions of the Creative Commons Attribution (CC BY) license. Authors who
publish this series agree to the following terms:
1. Authors retain copyright and grant the series right of first publication with the work simultaneously licensed under a Creative Commons
Attribution License that allows others to share the work with an acknowledgment of the work's authorship and initial publication in this
series.
2. Authors are able to enter into separate, additional contractual arrangements for the non-exclusive distribution of the series's published
version of the work (e.g., post it to an institutional repository or publish it in a book), with an acknowledgment of its initial
publication in this series.
3. Authors are permitted and encouraged to post their work online (e.g., in institutional repositories or on their website) prior to and
during the submission process, as it can lead to productive exchanges, as well as earlier and greater citation of published work (See
Open access policy for details).
References
[1]. Kubilay, İ.A. (2015) The Founding of Apple and the Reasons Behind Its Success. Procedia-Social and Behavioral Sciences, 195, 2019-2028.
[2]. Li, T. (2024) Apple: A Clever Integration of Psychology and Scientific Marketing. International Journal of Global Economics and Management, 3(2), 280-285.
[3]. Peng, J., Deng, C., & Chen, Y.C. (2022) Application of ARIMA Time Series Model in Stock Data Prediction. In International Conference on Intelligent Information Hiding and Multimedia Signal Processing, 341, 223-232
[4]. Shumway, R. H., Stoffer, D. S., Shumway, R. H., & Stoffer, D. S. (2017). ARIMA models. Time series analysis and its applications: with R examples, 75-163.
[5]. Yıldırım, E., & Cengiz, M. A. (2022). Modeling and Forecasting of USD/TRY Exchange Rate Using ARMA-GARCH Approach. İstatistik Araştırma Dergisi, 12(2), 1-13.
[6]. Guo, K., Jiang, Z., & Zhang, Y. (2023). Prediction of S&P500 Stock Index Using ARIM and Linear Regression. Highlights in Science, Engineering and Technology, 38, 399-407.
[7]. Xu, S., & Liang, X. (2019) Research on Stock Price Prediction Based on ARIMA-GARCH Model. Journal of Henan Institute of Education (Natural Science Edition), 28(04), 20-24.
[8]. Trivez, F.J., & Catalan, B. (2009) Detecting Level Shifts in ARMA-GARCH (1, 1) Models. Journal of Applied Statistics, 36(6), 679-697.
[9]. Bank, S., & Yazar, E.E. (2023) Brand Index: A New Suggestion for Stock Market Indices. International Journal of Economics and Business Research, 26(2), 179-200.
[10]. Yagi, I., Masuda, Y., & Mizuta, T. (2020) Analysis of the Impact of High-Frequency Trading on Artificial Market Liquidity. IEEE Transactions on Computational Social Systems, 7(6), 1324-1334.