


1. Introduction
1.1. Background
With the global population growth and the acceleration of urbanization, the demand for food has been steadily increasing. The security of food supply is essential for national economic stability and sustainability, which led to the importance of an efficient and stable Grain Supply Chain (GSC) to provide sufficient and safe food, stabilize market prices, and stimulate agricultural production. The GSC encompasses various stages, beginning with farmers and growers, moving on to producers and food companies, and then wholesalers and retailers [1]. Agriculture and grain production serve as the foundational components of the GSC. Previous research has pointed out that the GSC of China is facing severe challenges, including environmental pollution, the irrational use of fertilizers and pesticides, and a lack of breeding technologies [2]. In addition, grain production is also constrained by land and water resources, affecting the stability and adequacy of the GSC.
1.2. Related Research
Both domestically and internationally, scholars have analyzed GSC management and agricultural productivity through various approaches and models. Some scholars assert that the source of geographical diversity, cash flow management, and suppliers are the most important enablers for the ripple effects and the systemic interrelationships in GSC using Pareto analysis, total interpretive structural modeling, and matrice d'impacts croisés multiplication appliquée à un classement (MICMAC) methods, showing the complex relationships between variables, sustainability, and food security [3]. An impaired decision model under the government-subsidized producer framework was used to examine how government subsidies affect GSC loss reduction and member benefits [4]. Some scholars have used factor analysis, entropy weight method-TOPSIS, and grey relational analysis to show that Guangdong's GSC has low external risks of low yields and food reserves. The main elements determining higher internal risks include food production, food enterprise risk resistance, and the consumer price index for food [5]. This study emphasizes food production's importance to GSC integrity. However, in the field of food production research, factor analysis is one of the most common methods for categorizing the influencing factors of grain production into comprehensive input factors and disaster factors, ranking the contribution of each, and proposing corresponding suggestions [6]. An extensive range of nonlinear models, such as Gaussian Process Regression and Gradient Boosting Decision Trees, have been developed to construct a food production forecasting model for Chongqing, demonstrating the area of cultivation, agricultural machinery, labor, and disaster-affected area substantially impact food production [7]. Using spatial autocorrelation and a Geodetector model, some researchers developed a model for the quality of rural production spaces in Songnen Plain and examined the influencing factors and spatial agglomeration characteristics. Although various factors impacted the rural production environment, the main influences on the quality were the purchasing power of production resources, infrastructure, and agricultural mechanization [8]. Geographically weighted regression has been used to compare grain yield factors in Henan and Heilongjiang provinces. The two provinces were significantly different in terms of the influencing factors, which included input factors, socioeconomic factors, and the geographical environment in this comparative study [9].
Currently, research concerning the GSC mainly emphasizes technological advancements, governmental assistance, and risk evaluation. Nonetheless, there is limited research addressing grain production in certain regions, particularly in Heilongjiang Province, which has flat landscapes, rich soil, and significant organic matter content, making it the largest crop production base in China. However, with the uncertainties of the economic structure and climate change, crop production in this region encounters various problems, such as land degradation and inadequate agricultural infrastructure, which pose serious challenges for the GSC [10]. The existing literature predominantly emphasizes macro-level discussions, from the perspectives of national policies and industrial dynamics, addressing market supply and demand relationships, agricultural production models, and so forth. The research lacks empirical research on the micro-level factors, specifically how the individual stages of grain cultivation are influenced by external factors, making it difficult to assess Heilongjiang Province's grain production and growth potential.
1.3. Objection
This study aims to close the gap by building a Multiple Linear Regression (MLR) model within the framework of Stepwise Regression analysis focusing on the factors impacting Grain Yield in Heilongjiang Province from 1992 to 2022 within the context of the GSC. It provides empirical analysis and strategic recommendations for the grain production inputs, the stability of the GSC, and the agricultural sustainable development in Heilongjiang Province.
2. Methodology
2.1. Data
This study focuses on eight independent variables covering the years from 1992 to 2022 and aims to explore the elements affecting Grain Yield in Heilongjiang. The data was derived from the China Statistical Yearbook, the China Agricultural Yearbook, and the Heilongjiang Provincial Statistical Yearbook. The name and definition of each variable are illustrated in Table 1.
Table 1: Variable Definition
Variable name | Variable symbol | Unit | Explanation of variables |
Grain Yield | Y | 104 t | The number of grains produced by a crop |
Grain Sown Area | X1 | 103 hm2 | The land area where agricultural crops are grown |
Effective Irrigated Area | X2 | 103 hm2 | The effective irrigated area |
Disaster-Affected Area | X3 | 103 hm2 | The land area affected by natural disasters |
Pesticide Usage | X4 | 104 t | The use of agricultural fertilizers and pesticides |
Total Power of Agricultural Machinery | X5 | 104 kW | The overall power of the cultivator |
Employment in Primary Industry | X6 | 104 people | The number of labor force employed in the primary sector |
Per Capita Regional Gross Domestic Product (GDP) | X7 | Yuan | The total output value of a specific region is divided by its total population over a given time period. |
Value Added in Primary Industry | X8 | 108 Yuan | The additional value created by the primary sector |
2.2. Models
In this study, Stepwise Regression Analysis and the conventional MLR model were conducted to perform the Grain Yield model.
Stepwise Regression Analysis is a method for building Linear Regression Models that assesses the statistical significance of each independent variable in the model. Using a stepwise approach, this process entails the method of an ideal predictive model, with variables being added and removed according to the statistical importance and contribution to the overall performance. The Stepwise Regression method utilizes the Coefficient of Multiple Determination (R²) and the significance of Regression Coefficients as its criteria. Specifically, the dependent variable was analyzed in each independent variable separately. The primary regression equation was used by the regression equation incorporated with the most significant independent variable, followed by other less significant independent variables sequentially. If the outcome improves the overall model performance by an increase in R² while other parameters remain significant, then the variable was kept, otherwise eliminated. This procedure was repeated until there were no considerable changes to R². The flowchart of Stepwise Regression Analysis Variable Selection is shown in Figure 1 below.
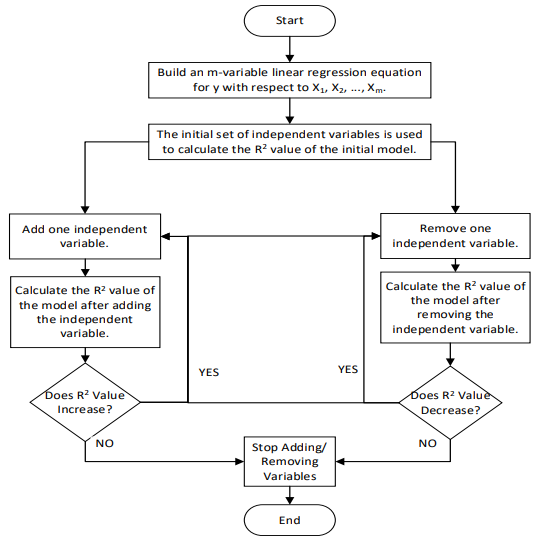
Figure 1: Stepwise Regression Analysis Variable Selection Flowchart [11]
Suppose that the MLR model consists of one dependent variable (Y) and k independent variables, which can be represented as follows:
Y = β0 + β1X1 + β2X2 +… + βKXK + μ (1)
In this MLR model, k represents the number of independent variables from one to eight. Y is the dependent variable, X₁, X₂...X8 are the independent variables, while β₀, β₁, β₂…β8 are the regression coefficients, and μ represents the residual. While the residual μ shows the percentage of Y variation that cannot be determined by the current independent factors, the regression coefficients show the degree to which the independent variables affect the dependent variable.
2.3. Research Framework
This study has following steps:
Step 1: Descriptive Statistical Analysis. The objective of the first step is to identify the overall characteristics, trends, outliers, and potential correlations of all variables in the raw data. This process serves as a foundation for further studies concentrating on the relationships between Grain Yield and various factors.
Step 2: Benchmark Regression Model (BRM) Analysis. This step shows the basic connections between variables through a simple linear regression equation, which helps to build later models and to simplify the overall model. If the BRM shows inadequate fit, the study moves on to Step 3.
Step 3: Variable Selection Based on Stepwise Regression. The purpose of this step is to resolve Multicollinearity issues that are present in the BRM and to improve the model fit by eliminating independent variables that do not contribute to the dependent variable.
Step 4: MLR Analysis and model validation. This final step aims to assess the importance of each parameter in the regression model by utilizing the tests of economic and statistical significance, Residual Normality Analysis, Homoscedasticity Analysis, Autocorrelation Analysis, and Multicollinearity Analysis to ensure that all variables are significant and uncorrelated, thereby confirming the rationality and validity of the regression model.
3. Results
3.1. Descriptive Statistics of the Data
Descriptive Statistical Analysis of all variables was conducted in R, as shown in Table 2.
Table 2: Descriptive Statistics of the Data
Variable Name | Max | Min | Mean | Sd | Kurtosis | Skewness |
Y (104 t) X1 (103 hm2) X2 (103 hm2) X3 (103 hm2) | 7104.39 11384.49 6220.51 7393.7 | 1792.01 3867.1 1015.4 97.4 | 4144.91 7165.75 3494.97 3093.65 | 2100.52 2640.33 1908.11 1688.96 | -1.78 -1.71 -1.61 0.35 | 0.25 0.21 0.26 0.67 |
X4 (104 t) | 8.74 | 1.46 | 5.25 | 2.46 | -1.57 | -0.07 |
X5 (104 kW) | 7090.88 | 1172.6 | 3406.64 | 2060.29 | -1.41 | 0.43 |
X6 (104 people) | 38699 | 17072 | 29147.45 | 7271.9 | -1.5 | -0.36 |
X7 (Yuan) | 50873 | 2387 | 20292.74 | 14843.42 | -1.22 | 0.48 |
X8 (108 Yuan) | 3635.3 | 163.5 | 1453.02 | 1204.11 | -1.43 | 0.54 |
3.2. Benchmark Regression
Table 3 shows the BRM statistic results of the dependent variable against the eight independent variables.
Table 3: Benchmark Regression Results
Variable | Coefficient | Std. Error | t-Statistic | Prob. | |||
C | 1461.379 | 954.0653 | 1.531739 | 0.1398 | |||
X1 | 0.447264 | 0.026539 | 16.85295 | 0.0000 | |||
X2 | 0.154368 | 0.092703 | 1.665184 | 0.1101 | |||
X3 | -0.041530 | 0.011871 | -3.498526 | 0.0020 | |||
X4 | 8.733856 | 21.34236 | 0.409226 | 0.6863 | |||
X5 | 0.040497 | 0.138057 | 0.293335 | 0.7720 | |||
X6 | -0.046236 | 0.023003 | -2.010010 | 0.0568 | |||
X7 | -0.000307 | 0.013045 | -0.023497 | 0.9815 | |||
X8 | 0.163525 | 0.159753 | 1.023617 | 0.3171 | |||
R-squared | 0.998761 | Mean dependent var | 4144.909 | ||||
Adjusted R-squared | 0.998310 | S.D. dependent var | 2100.520 | ||||
S.E. of regression | 86.34429 | Akaike info criterion | 11.99226 | ||||
Sum squared resid | 164017.4 | Schwarz criterion | 12.40858 | ||||
Log likelihood | -176.8801 | Hannan-Quinn criter. | 12.12797 | ||||
F-statistic | 2216.559 | Durbin-Watson stat | 1.693974 | ||||
Prob(F-statistic) | 0.000000 | — | — | ||||
From the economic point of view, the regression coefficients suggest a positive correlation between Grain Yield in Heilongjiang and several factors, including Grain Sown Area, Effective Irrigated Area, Pesticide Usage, Total Power of Agricultural Machinery, and Value Added in Primary Industry. Alternatively, Grain Yield exhibits a negative correlation with Disaster-Affected Areas, Employment in Primary Industry, and Per Capita Regional GDP. Normally, the labor input can facilitate the management of crop cultivation and maintain large-scale agricultural production to increase the total Grain Yield. Thus, Employment in the Primary Industry should be positively correlated with the Grain Yield. Usually, a greater Per Capita Regional GDP implies advanced and proficient financial resources for agriculture research and development (R&D) of the area, leading to a surge in the Grain Yield. Hence, there should be a positive relationship between Per Capita Regional GDP and Grain Yield. However, the findings from the BRM challenge these assumptions, revealing the possible econometric issues within the model that need additional studies and validations.
From the statistical point of view, while the overall significance of the model is sufficient, the significance of the regression coefficients for individual independent variables is relatively weak. Only the regression coefficients for the independent variables X1 and X3 are significant, as shown by their corresponding p-values from the T-statistics, both of which are less than 0.05. Therefore, the next step is using a Stepwise Regression method to determine the important variables.
3.3. Multiple Linear Stepwise Regression
Following the approach outlined in Section 2.3, R2 is used as the criteria to prioritize the significance of independent variables. The sequence of X1, X6, X2, X8, X5, X7, X4, and X3 is arranged from the most influential to the least, with X1 being the most influential because its regression equation has the highest R² value of 0.97778. Therefore, the regression equation of X1 was selected as the primary regression equation. Eventually, additional independent variables were added individually, with both R² and the significance of the regression coefficients, to determine which inadequate significance variables should be removed. The last selected independent variables are X1, X2, X3, X6, and X8. A MLR analysis is given on these five variables, with the results shown in Table 4.
Table 4: Multiple Linear Regression Results
Variable | Coefficient | Std. Error | t-Statistic | Prob. | |||
C | 1738.022 | 679.7798 | 2.556742 | 0.0170 | |||
X1 | 0.448474 | 0.018570 | 24.15010 | 0.0000 | |||
X2 | 0.193294 | 0.050166 | 3.853043 | 0.0007 | |||
X3 | -0.040795 | 0.010352 | -3.940909 | 0.0006 | |||
X6 | -0.053319 | 0.016587 | -3.214574 | 0.0036 | |||
X8 | 0.136277 | 0.094774 | 1.437914 | 0.1629 | |||
R-squared | 0.998746 | Mean dependent var | 4144.909 | ||||
Adjusted R-squared | 0.998495 | S.D. dependent var | 2100.520 | ||||
S.E. of regression | 81.49859 | Akaike info criterion | 11.81103 | ||||
Sum squared resid | 166050.5 | Schwarz criterion | 12.08858 | ||||
Log likelihood | -177.0710 | Hannan-Quinn criter. | 11.90151 | ||||
F-statistic | 3980.702 | Durbin-Watson stat | 1.629910 | ||||
Prob(F-statistic) | 0.000000 | — | — | ||||
The MLR model is expressed as follows: Y = 1738.02164 + 0.44847*X1 + 0.19329*X2 – 0.0408*X3 – 0.05332*X6 + 0.13628*X8
Grain Yield was positively correlated with Grain Sown Area, Effective Irrigated Area, and Value Added in Primary Industry, but negatively correlated with Disaster-Affected Area and Employment in Primary Industry. The regression coefficients show the estimated influence of each independent variable on the Grain Yield when all other variables remain the same. For example, for one unit increase in the Grain Sown Area, the Grain Yield will be increased by 44.847 million tons if all other variables remain constant. The intercept of the regression equation was 1738.02164, indicating the value was not affected by the independent variables.
The F-test is used to appraise the overall significance of the regression model. If the p-value of the F-statistic is below the predetermined significance level of 0.05, the Null Hypothesis may be rejected, meaning there are significant differences among the samples. In this model, the overall linear relationship between the dependent variable and independent variables was significant due to the p-value being significantly less than 0.05. The T-test is used to assess the significance of individual independent variables. Most of the regression coefficients of independent variables were significant, as calculated by the p-value of the T-statistic. The p-value for independent variables X1, X2, and X3 were significantly less than 0.05, implying that Grain Sown Area, Effective Irrigated Area, Disaster-Affected Area, and Employment in Primary Industry have a substantial impact on Grain Yield. R2 is used as the primary indicator to examine the accuracy and dependability of the model. It quantifies the amount of variability in the dependent variable by the regression model. A higher R2 means a stronger correlation between the model and the data. With the R2 value of 0.9987, the model indicates that 99.78% of the variance of Grain Yield can be explained by independent variables.
3.4. Model Validation
In the following section, a comprehensive validation is conducted for the model in Section 3.3. The intention is to seek the satisfaction of the model’s assumptions, thereby improving the model’s accuracy and dependability.
3.4.1. Residual Normality Analysis
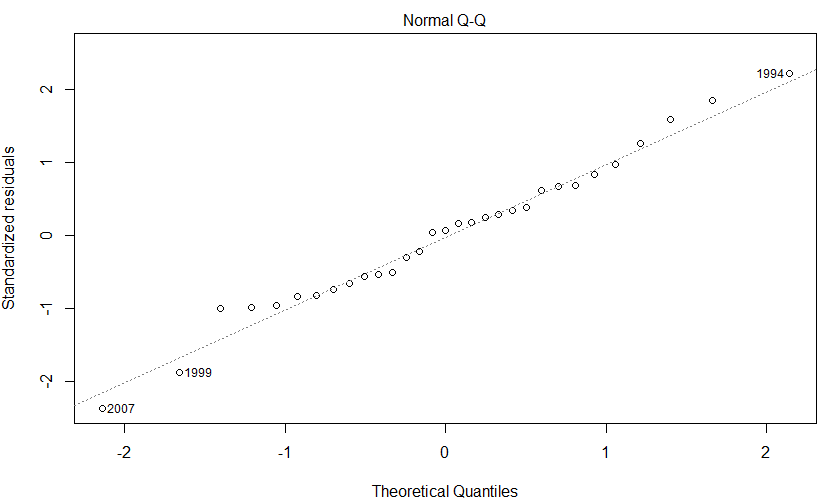
Figure 2: Normal quantile-quantile (Q-Q) plot (Photo credit: Original)
Many statistical inference methods, such as the T-test and F-test, rely on the assumption of normality. A significant deviation of the errors from a normal distribution may lead to issues such as biases and overfitting within the model. Figure 2 presents the Q-Q plot for the MLR model. The error points were very near to the diagonal line, which means that the random errors were normally distributed, particularly in the central region. The error points at the tails of the two ends, corresponding to 1994, 1999, and 2007 respectively, were deviated from the overall normal trend.
3.4.2. Homoscedasticity Analysis
Table 5: Homoscedasticity Analysis
Heteroskedasticity Test: White | |||
F-statistic | 0.784114 | Prob. F(20,10) | 0.6926 |
Obs*R-squared | 18.92942 | Prob. Chi-Square(20) | 0.5264 |
It is crucial to determine whether the variance of the random errors stays constant. Suppose there was no Homoscedasticity in this model that makes the estimated regression coefficients, not the Best Linear Unbiased Estimator (BLUE), meaning that the validity of the T-test and F-test were seriously compromised. The White Test was employed using Eviews to identify the presence of Heteroscedasticity in the model. The Null Hypothesis of the White Test was Homoscedasticity. From Table 5, it can be observed that the p-value is 0.5264 greater than 0.05, indicating the Null Hypothesis cannot be rejected and there was no evidence of Heteroscedasticity in random errors.
3.4.3. Autocorrelation Analysis
Table 6: Autocorrelation Analysis
Autocorrelation Test: Durbin-Watson | |||
lag | Autocorrelation | D-W statistic | p-value |
1 | 0.1697448 | 1.62991 | 0.074 |
If the random errors were Autocorrelation, it may lead to an overestimation of the T-value, causing the Ordinary Least Squares (OLS) estimator to be ineffective. The Durbin-Watson Test was employed using R to assess autocorrelation, with the results presented in Table 6. The Null Hypothesis of the Durbin-Watson Test was no Autocorrelation, meaning there was no correlation among random errors. The p-value of the Durbin-Watson Test is 0.074 greater than 0.05, demonstrating the Null Hypothesis cannot be rejected and there was no evidence of Autocorrelation in random errors.
3.4.4. Multicollinearity Analysis
Table 7: Multicollinearity Analysis
Variable | VIF |
X1 | 10.858619 |
X2 | 41.386022 |
X3 | 1.380655 |
X6 | 65.711391 |
X8 | 58.919033 |
Multicollinearity happens when two or more independent variables have a strong linear relationship. It is achieved by calculating the Variance Inflation Factor (VIF) for each independent variable. When VIF value exceeds 10, it may be considered indicative of Multicollinearity leading to a regression coefficient instability. Thus, Multicollinearity must be addressed to improve model performance. The VIF value shown in Table 7 indicates a significant enhancement in Multicollinearity compared to the BRM.
4. Discussion
4.1. Reason Analysis
These results indicate that Heilongjiang's Grain Sown Area, Effective Irrigated Area, Disaster-Affected Area, Employment in Primary Industry, and Value Added in Primary Industry have a significant impact on Heilongjiang's Grain Yield from 1991 to 2022.
As an irreplaceable resource, land resources are the most important factor in food production which is consistent with the above hypothesis. When all other factors remain constant, the yield will increase as the Grain Sown Area and Effective Irrigated Area increase. It shows that Grain Yield depends on environmental conditions.
Similarly, Disaster-Affected Areas such as climate anomalies, floods, and droughts have greater significance when compared to other seemingly important predictors. It causes the risk of grain yield reduction resulting in an inverse correlation between the Disaster-Affected Area and Grain Yield. This illustrates that protecting the environment and preventing the land resources from being Natural disasters are also important.
However, the negative coefficient associated with Employment in Primary Industry contradicts the common perception that "the more the labor, the higher the Grain Yield." This is consistent with the “Law of Diminishing Marginal Returns” theory as labor continues to move away from the peak, it leads to a decrease in Grain Yield when other conditions remain constant [12]. Moreover, past research confirmed the educational level of Employment in Primary Industry is also an important factor for the quality and yield of agricultural production due to their inadequate knowledge of cultivation and operational skills for modern equipment. Therefore, Employment in Primary Industry may have a negative correlation with the yield [13]. In this instance, the Songhua River Plain and the Sanjiang Plain are the primary grain-producing regions of Heilongjiang province. Excessive labor input of these huge plains could cause inefficient production. It becomes crucial to enhance agricultural mechanization and automation.
Although the significance of the coefficient for the Value Added in Primary Industry is low after variable selection, it’s still been retained which suggests a positive correlation between Value Added in Primary Industry and Grain Yield. The Value Added in Primary Industry could serve as an indicator of agricultural economic growth. An increase in the Grain Yield of the Primary Industry signifies a strong demand for agricultural products that positively influences the Grain Yield.
4.2. Recommendations
From the results of the empirical analysis and the challenges faced by agricultural production in the Heilongjiang region, the following recommendations are proposed to boost the Grain Yield.
4.2.1. Stabilize Grain Sown Area and Increase Effective Irrigated Area
The government should motivate farmers to cultivate large-scale rice fields, increase investments in water conservation, and ensure adequate irrigation resources to facilitate soil fertility. Furthermore, efforts should be made to improve the crop rotation and fallow land system. In recent years, the Chinese government has implemented policies and regulations aimed at promoting the use of land fallow in regions that experienced land degradation or ecological fragility. A land fallow trial program was initiated in 2016 [14]. Heilongjiang has formed a rotation model with corn and soybeans as the main crop, and potatoes as well as other grains as the secondary crops, which has gained acceptance by most farmers. By implementing the crop rotation and fallow land system, integrating of comprehensive management with planting and soil treatment could improve the ecological environment and ensure that resources are fully utilized, thus securing long-term sustainable grain production [15].
4.2.2. Strengthen Disaster Monitoring and Reduce Affected Areas
The government can strengthen the monitoring and early warning system to establish disaster resilience prevention. Additionally, it provides farmers with post-disaster relief measures in assisting agricultural reconstruction.
4.2.3. Reduce Ineffective Labor Inputs and Promote Agricultural Innovation
The government can minimize inefficient labor inputs while guaranteeing farmers steady work, supporting agricultural automation developments to further improve Grain Yield and production efficiency.
4.2.4. Invest in the Primary Sector and Promote Collaboration across Industries
The government should continue its funding in agriculture and associated fields, such as management techniques, infrastructures, and technology R&D. Supporting the growth of the digital sector and industry-to-industry cooperation will increase market demand and create a desirable market environment. This approach is beneficial to the stability of the GSC and the enhancement of the Grain Yield.
4.3. Limitations
Stepwise Regression has led to the retention of five independent variables and there is a high residual, suggesting that unobserved random variables may be the determining factor in Grain Yield. It is not feasible to conduct a comprehensive study for all elements due to the underlying limitations of both the model and the data. Therefore, further data collection is required to determine how supplementary factors affect the Grain Yield. Aside from the above-mentioned policy recommendations, the enrichment of Grain Yield and agricultural sustainability in Heilongjiang can be achieved by reinforcing agricultural product quality and safety, the growth of eco-friendly farming, as well as the market framework. By adopting these strategies, the Grain Yield of Heilongjiang is anticipated to grow ahead towards a better efficiency and sustainable future in national food security and economic advancement.
5. Conclusion
This study discovered the key factors of Grain Sown Area, Effective Irrigated Area, Disaster-Affected Area, Employment in Primary Industry, and Value Added in Primary Industry may influence Grain Yield. An increase in the Grain Sown Area, Effective Irrigated Area, and Value Added in Primary Industry may have a positive effect on Grain Yield, whereas an increase in the Disaster-Affected Area and Employment in Primary Industry may lead to a decrease in Grain Yield. These findings provide empirical analysis and recommendations for the crop production inputs as well as the GSC production stability in the Heilongjiang region. Although Stepwise Regression did not solve the Multicollinearity problem, the regression coefficient for each independent variable was more significant, and the Multicollinearity was substantially refined compared to the BRM. Therefore, the Stepwise Regression for variable selection was proven to be effective. The comprehensiveness of this study is constrained by the limitations of the model and the data. The influential factors were primarily based on production conditions and market demand. To further explore the possibilities of facilitating grain production stability and the interactions with the GSC, among other segments, future research should aim to establish models that are more closely aligned with the data while investigating additional factors affecting Grain Yield. This would contribute to the development of a more efficient, secure, and flexible GSC system to satisfy the growing demand.
References
[1]. Tiep, T.L., Hung, X.K., Abhishek, B. et al. (2022) Building Up More Sustainable Food Supply Chains: Implications for Sustainable Development. Journal of Cleaner Production, 378.
[2]. Bai, Y.H., Huang, M.M. (2022) Food Supply Chain Security Issues and Countermeasures under the Dual Circulation Pattern. Rural Economy and Science-Technology, 34, 48-51.
[3]. Alam, B.F.M., Tushar, R.S., Ahmed, T. et al. (2024) Analysis of the Enablers to Deal with the Ripple Effect in Food Grain Supply Chains under Disruption: Implications for Food Security and Sustainability. International Journal of Production Economics, 270, 109179.
[4]. Zhao, B. (2024) Decision and Coordination of Food Supply Chain Loss Reduction Considering Quantity and Quality Loss under Government Subsidies. Henan Agricultural University.
[5]. Zhang, T., Li, S.M., Fu, K.F., Wang, J.F. (2024) Empirical Analysis and Control Strategies of Grain Supply Chain Risk Assessment in Guangdong Province. Guangdong Agricultural Sciences, 1-11.
[6]. Li, Y.M., Yang, H. (2012) Comprehensive Analysis of Factors Influencing Grain Production in Heilongjiang Agricultural Reclamation Area. A Study on Productivity, 8, 47-48+53.
[7]. Wu, L. (2023) Ensemble Learning for Grain Yield Forecasting and Influencing Factors Analysising in Chongqing. Chongqing Technology and Business University.
[8]. Chen, L.T., Chen, X.H., Pan, W. et al. (2023) Assessing Rural Production Space Quality and Influencing Factors in Typical Grain-Producing Areas of Northeastern China. Sustainability, 15.
[9]. Wang, Z.P., Zhang, E., Chen, G.J. (2023) Spatiotemporal Variation and Influencing Factors of Grain Yield in Major Grain-Producing Counties: A Comparative Study of Two Provinces from China. Land, 12, 1810.
[10]. Li, D.X. (2024) A Study on the Practical Path of Heilongjiang Province as a "Ballast Stone" for National Food Security. Journal of the Party School of Harbin Committee of CPC, 1,18-22.
[11]. Le, X.B., Wang, X.Y., Li, H.B. et al. (2023) Capacity Prediction of VRLA Batteries Based on Stepwise Regression Analysis. Journal of Physics: Conference Series, 2659, 1.
[12]. Dhakal, P.C. (2018) Multiple Regression Model Fitted for Rice Production Forecasting in Nepal: A Case of Time Series Data. Nepalese Journal of Statistics, 2, 89-98.
[13]. Wang, Y. (2023) A Study on the Export Competitiveness of Agricultural Products in Henan Province Based on Factor Analysis. Huaibei Normal University.
[14]. Wu, Q., Xie, H.L. (2017) A Review and Implication of Land Fallow System Research. Journal of Resources and Ecology, 8, 223-231.
[15]. Yang, W.J., Gong, Q.W. (2018) Main Methods, Problems and Countermeasures of Farmland Fallow Pilot Programs in China. Research of Agricultural Modernization, 39, 9-18.
Cite this article
Li,Z. (2024). Analysis on Influencing Factors of Grain Yield under the Grain Supply Chain in Heilongjiang. Advances in Economics, Management and Political Sciences,143,125-135.
Data availability
The datasets used and/or analyzed during the current study will be available from the authors upon reasonable request.
Disclaimer/Publisher's Note
The statements, opinions and data contained in all publications are solely those of the individual author(s) and contributor(s) and not of EWA Publishing and/or the editor(s). EWA Publishing and/or the editor(s) disclaim responsibility for any injury to people or property resulting from any ideas, methods, instructions or products referred to in the content.
About volume
Volume title: Proceedings of ICFTBA 2024 Workshop: Finance's Role in the Just Transition
© 2024 by the author(s). Licensee EWA Publishing, Oxford, UK. This article is an open access article distributed under the terms and
conditions of the Creative Commons Attribution (CC BY) license. Authors who
publish this series agree to the following terms:
1. Authors retain copyright and grant the series right of first publication with the work simultaneously licensed under a Creative Commons
Attribution License that allows others to share the work with an acknowledgment of the work's authorship and initial publication in this
series.
2. Authors are able to enter into separate, additional contractual arrangements for the non-exclusive distribution of the series's published
version of the work (e.g., post it to an institutional repository or publish it in a book), with an acknowledgment of its initial
publication in this series.
3. Authors are permitted and encouraged to post their work online (e.g., in institutional repositories or on their website) prior to and
during the submission process, as it can lead to productive exchanges, as well as earlier and greater citation of published work (See
Open access policy for details).
References
[1]. Tiep, T.L., Hung, X.K., Abhishek, B. et al. (2022) Building Up More Sustainable Food Supply Chains: Implications for Sustainable Development. Journal of Cleaner Production, 378.
[2]. Bai, Y.H., Huang, M.M. (2022) Food Supply Chain Security Issues and Countermeasures under the Dual Circulation Pattern. Rural Economy and Science-Technology, 34, 48-51.
[3]. Alam, B.F.M., Tushar, R.S., Ahmed, T. et al. (2024) Analysis of the Enablers to Deal with the Ripple Effect in Food Grain Supply Chains under Disruption: Implications for Food Security and Sustainability. International Journal of Production Economics, 270, 109179.
[4]. Zhao, B. (2024) Decision and Coordination of Food Supply Chain Loss Reduction Considering Quantity and Quality Loss under Government Subsidies. Henan Agricultural University.
[5]. Zhang, T., Li, S.M., Fu, K.F., Wang, J.F. (2024) Empirical Analysis and Control Strategies of Grain Supply Chain Risk Assessment in Guangdong Province. Guangdong Agricultural Sciences, 1-11.
[6]. Li, Y.M., Yang, H. (2012) Comprehensive Analysis of Factors Influencing Grain Production in Heilongjiang Agricultural Reclamation Area. A Study on Productivity, 8, 47-48+53.
[7]. Wu, L. (2023) Ensemble Learning for Grain Yield Forecasting and Influencing Factors Analysising in Chongqing. Chongqing Technology and Business University.
[8]. Chen, L.T., Chen, X.H., Pan, W. et al. (2023) Assessing Rural Production Space Quality and Influencing Factors in Typical Grain-Producing Areas of Northeastern China. Sustainability, 15.
[9]. Wang, Z.P., Zhang, E., Chen, G.J. (2023) Spatiotemporal Variation and Influencing Factors of Grain Yield in Major Grain-Producing Counties: A Comparative Study of Two Provinces from China. Land, 12, 1810.
[10]. Li, D.X. (2024) A Study on the Practical Path of Heilongjiang Province as a "Ballast Stone" for National Food Security. Journal of the Party School of Harbin Committee of CPC, 1,18-22.
[11]. Le, X.B., Wang, X.Y., Li, H.B. et al. (2023) Capacity Prediction of VRLA Batteries Based on Stepwise Regression Analysis. Journal of Physics: Conference Series, 2659, 1.
[12]. Dhakal, P.C. (2018) Multiple Regression Model Fitted for Rice Production Forecasting in Nepal: A Case of Time Series Data. Nepalese Journal of Statistics, 2, 89-98.
[13]. Wang, Y. (2023) A Study on the Export Competitiveness of Agricultural Products in Henan Province Based on Factor Analysis. Huaibei Normal University.
[14]. Wu, Q., Xie, H.L. (2017) A Review and Implication of Land Fallow System Research. Journal of Resources and Ecology, 8, 223-231.
[15]. Yang, W.J., Gong, Q.W. (2018) Main Methods, Problems and Countermeasures of Farmland Fallow Pilot Programs in China. Research of Agricultural Modernization, 39, 9-18.