


1.Introduction
In this fast-paced digital age, the emergence of large language models like ChatGPT, productivity of people has been increasing rapidly. As the backbone of nearly everything connected to artificial intelligence, the telecommunication sector has became a highly competitive sector that embodies huge amounts of opportunities. In the United States, four major players dominate the market: Verizon, AT&T, T-Mobile, and U.S. Cellular. Each of these companies presents distinct investment prospects, driven by their unique strategies and market positioning. This essay will recommend one of the four company to invest in to provide guidance for potential investors.
This essay aims to provide an analysis on different metrics of the four companies, focusing on their price to book ratio, EPS and EPS growth rates, monthly and quarterly revenue, and profitability trends. As technological advancements reshape the telecommunications sector, making an informed investment decision requires a deep understanding of each company's strengths and weaknesses.
2.Overview
2.1.US Telecommunication Sector
In the U.S., the industry is characterized by high competition, rapid technological advancements (especially with the rollout of 5G), and significant capital investment. As of 2024, the U.S. telecom sector is dominated by three major players: Verizon, AT&T, and T-Mobile, which controls over 85% percent of market share. Another regional network service provider, US Cellular, controls about 2% of market share and is the fourth largest company in the sector.
It clearly appears that these companies are competitors. Firstly, they all operate in the telecommunication sector and provide services such as telephone access, internet access for electronic devices, and broadband services for a wide variety of customers. In addition, these four companies are all large-scale telecommunication providers across the U.S., operating their business in multiple states or regions.
2.2.Verizon
Verizon is one of the largest telecom companies in the U.S., known for its extensive wireless network and leadership in 5G deployment. With a strong market share of around 31-32% [1]. It focuses on mobile services, broadband internet, and innovative technologies like cloud computing and edge services. Its competitive advantage is its high-speed, high-coverage 5G network that has great quality.
2.3.AT&T
AT&T is a diversified telecom and media corporation with a market share of around 29-30% in wireless services [1]. In addition to its mobile business, AT&T has a strong presence in fiber optics and broadband internet services, making significant investments in expanding its infrastructure. In recent years, the company undergone several restructuring efforts, focusing on its core telecommunications services.
2.4.T-Mobile
T-Mobile has rapidly expanded its market presence, holding about 26-28% of the U.S. wireless market [1]. After its merger with Sprint, T-Mobile has positioned itself as a leader in 5G coverage, emphasizing its largest 5G network in the country. Its aggressive marketing and customer-centric approach have allowed it to compete directly with Verizon and AT&T.
2.5.US Cellular
While much smaller than the other three, U.S. Cellular serves specialized markets, particularly rural and underserved areas, with about 1-2% of the market share [1]. The company’s focus on these regions allows it to capture a loyal customer base, although its growth potential is limited compared to its larger competitors.
3.Method
This essay will assess the investment viability of Verizon, AT&T, T-Mobile, and U.S. Cellular by analyzing a range of financial metrics. Based on all these metrics, this essay will recommend one company that stands out to be the best investment choice.
3.1.TTM and NTM P/E ratios
The P/E ratio has a crucial role in the investment community. This ratio reflects the market’s expectation of future growth and firm risk [2]. This ratio can be used to estimate cost of equity capital and to earn excess stock returns from the glamour/value anomaly phenomenon [3, 4].
The P/E ratio is determined by dividing the earnings per share of a company by its current market share price. Higher P/E ratios may indicate investors expected higher profitability of the company. The P/E ratio include the trailing twelve-months (TTM) and next twelve-months (NTM) price-to-earnings (P/E) ratios.
3.2.TTM and NTM EPS and EPS growth rates
Earnings per share (EPS) is a measure used by financial analysts in their assessment of company performance and is commonly viewed as an important indicator of share value [5]. It represents the profit or loss attributable to each of a company’s ordinary shares, and hence is a measure constructed from the perspective of ordinary shareholders [5].
EPS of a financial period is measured by the net income of a company divided by its numbers of shares outstanding. Trailing-twelve months (TTM) and next-twelve-months (NTM) earnings per share (EPS) and EPS growth rates will be analyzed to measure profitability and growth potential of each four companies.
3.3.Gross margin and growth rates
The gross margin of a company is calculated by dividing its gross profit by its total revenue. It is the percentage of revenue that exceeds the cost of goods sold (COGS) [6]. A higher gross margin indicates potentially greater profitability of a company.
This essay will evaluate gross margin, and yearly and quarterly gross margin growth rates of the four companies to understand sales performance and operational efficiency.
3.4.Gross Profit/ Asset ratio
The gross profit/ asset ratio is a measure of a company’s ability to generate gross profit relative to its total assets [6]. It indicates how efficient a company is utilizing its assets to generate profit.
Additionally, the gross profit-to-assets (GP/A) ratio will be considered to provide insight on how effectively each company converts its assets into profit.
4.Analysis
These four candidate companies will be assessed according to the ratios mentioned in Section 3. The data for the analysis were collected from the financial statement or annual report of these four companies [7, 8, 9, 10].
4.1.TTM and NTM P/E ratio
The trailing twelve-month (TTM) and next twelve-month (NTM) price-to-earnings (P/E) ratios for the four companies are presented in Table 1.
Table 1: TTM and NTM P/R ratio
|
T-Mobile |
AT&T |
US Cellular |
Verizon |
|
|
TTM P/E ratio |
25.47 |
8.51 |
65.48 |
9 |
|
NTM P/E ratio |
19.04 |
8.71 |
83.89 |
8.81 |
These data reveal some insights on company valuations. AT&T and Verizon have relatively low P/E ratios, signaling that they might be undervalued compared to their earnings. On the other hand, T-Mobile and US Cellular have relatively high P/E ratios, showing that investors expect higher growth or that these stocks may be overvalued relative to earnings. Among the four companies, T-Mobile's P/E ratio aligns closest to the average, demonstrating it as a balanced option in terms of valuation. Moreover, compared to their current P/E ratios, both T-Mobile and AT&T are experiencing decreasing expected P/E ratios, which showed potential of future earnings growth without price growth, while Verizon and US Cellular have increasing future P/E ratios, which pose risks of being overvalued. Particularly, US Cellular may be a less favorable investment option due to its exceptionally high P/E ratio and its upward trend.
4.2.TTM and NTM EPS ratio
The TTM and NTM EPS are show in Table 2.
Table 2: TTM and NTM EPS
|
T-Mobile |
AT&T |
US Cellular |
Verizon |
|
|
TTM EPS |
7.75 |
2.28 |
0.82 |
4.53 |
|
NTM EPS |
10.37 |
2.23 |
0.64 |
4.63 |
The profitability of these four companies is very different. US Cellular and AT&T have low EPS and declining trend, signaling that they may struggle to sustain their current level of profit or keep its stock price growing. This suggests that both companies may face challenges in maintaining investor confidence and future expansion. In contrast, Verizon and T-Mobile experience higher EPS and increasing overall trend, indicating stronger profitability and ongoing growth. These companies are more favorable options for investors due to their solid financial performance and market expansion.
4.3.EPS and Revenue growth rate
The expected EPS and revenue growth rates are presented in Table 3.
Table 3: EPS and revenue growth rate
|
T-Mobile |
AT&T |
US Cellular |
Verizon |
|
|
EPS Growth Rate |
33.81% |
-2.19% |
-21.95% |
2.21% |
|
Revenue Growth Rate |
5.16% |
1.20% |
-3.30% |
1.71% |
The expected EPS and revenue growth rates vary significantly for the four companies. US Cellular are experiencing both negative EPS and revenue growth rates, while AT&T shows negative EPS growth rate. These negative figures marks potential risks for investors, as they signal declining profitability or operational challenges. T-Mobile and Verizon are both experiencing positive EPS and revenue growth rates, as T-Mobile outperforms Verizon in both metrics. Up to now, T-Mobile have the best growth rates in the four companies. T-Mobile’s strong growth rates position it as the leader among the four companies; however, this exceptional growth may be driven by special circumstances, such as the Sprint merger, and may not be sustainable in future years. Additionally, the substantial wedge between T-Mobile’s revenue and EPS growth rates needs caution, as it may indicate challenges in converting revenue growth into corresponding earnings growth.
Due to negative EPS growth rates, the PEG ratio for AT&T and US Cellular is not available. For the other two companies, T-Mobile has a PEG ratio of 0.753, while Verizon has a PEG ratio of 4.077. Compared to 4.077, a lower PEG ratio of 0.753 indicates larger growth potentials. In the meantime, however, investors should recognize that T-Mobile have such a favorable PEG ratio due to its exceptionally high EPS growth rate, which may not be consistent in the following years.
4.4.Gross Profit/ Assets ratio and Net Profit Margin
The Gros Profit/ Assets ratio and the Net Profit Margin are show in Table 4.
Table 4. GP/A and net profit margin
|
T-Mobile |
AT&T |
US Cellular |
Verizon |
|
|
GP/A |
7.28% |
5.76% |
9.93% |
6.02% |
|
Net Profit Margin |
4.25% |
3.83% |
4.14% |
3.18% |
All four companies have relatively low GP/A ratios and Net Profit Margins, indicating limited ability to efficiently generate profit from their assets. Among the group, however, U.S. Cellular and T-Mobile stand out with higher GP/A ratios and net profit margins, suggesting that they are more effective at converting assets into profit compared to their competitors. It is also important to note that overall efficiency across all four companies remains low, reflecting challenges in maximizing asset utilization within the entire telecommunications sector.
4.5.Gross Margin Trends
The Gross Margin trends are presented in Figure 1. The four companies have quite distinct gross margin trends over recent years. Verizon maintained the highest gross margin from 2020 to 2022, but has since experienced a downward trend, resulting in it being overtaken by both T-Mobile and AT&T. AT&T and T-Mobile both have a large increase in gross profit in 2023, but large fluctuations over time have marked AT&T’s performance. In contrast, T-Mobile’s growth appears more stable, reflecting consistent operational efficiency. Meanwhile, US Cellular have a relatively steady gross margin trend, but it remains at comparatively low levels, limiting its competitive positioning in terms of profitability. From Figure 1, it is evident that all four companies experienced a decline in gross margin in 2022, suggesting adverse events in the telecommunication market affected them collectively. AT&T was hit the hardest, it saw a significant decrease in gross margin, and it even reported negative gross profit. If similar events arise again in the future, AT&T may face serious financial challenges. Verizon and US Cellular both saw a decrease approximately 2% in their gross margin, their behavior is steadier. Verizon was not able to adjust effectively, and its gross margin continued to decline in 2023. US Cellular’s gross margin increased in 2023 but failed to reach its 2021 level. Both companies have not fully recovered from the negative impact. In contrast, the gross margin of T-Mobile only decreased by only about 0.5% in 2022, and it increased substantially in 2023. This indicates that T-Mobile have stronger resilience and capability to handle adverse market situations and adjust effectively than its competitors.
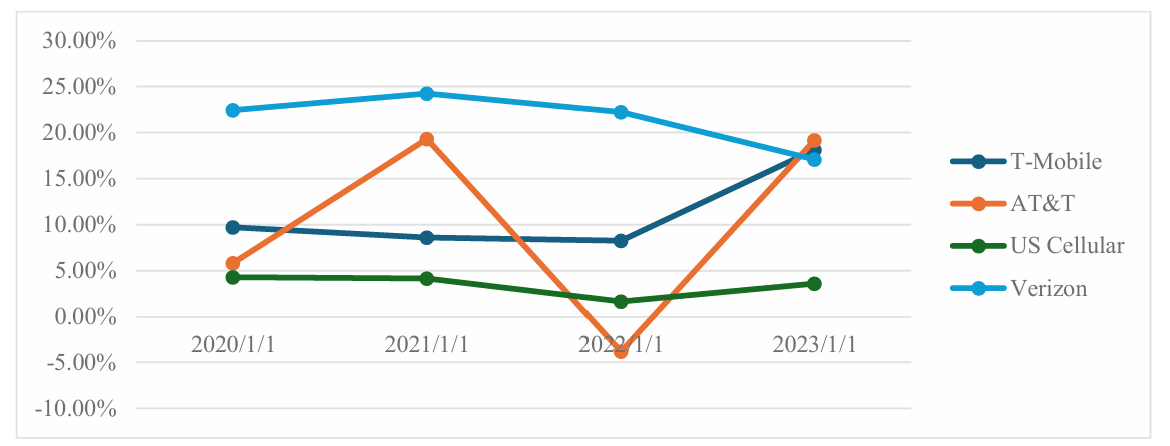
Figure 1: Gross margin
(Picture credit: Original)
4.6.Discussion
Firstly, by looking at future P/E ratios, US Cellular should be excluded due to its exceptionally high P/E ratio. Such a high level of valuation is challenging for the company to maintain over the long term. Next, AT&T presents significant investment risks because of its negative EPS growth rate, low GP/A ratio, and fluctuating gross margin. These factors indicate that AT&T is a highly risky stock with uncertainty and volatility, making it a less favorable investment choice.
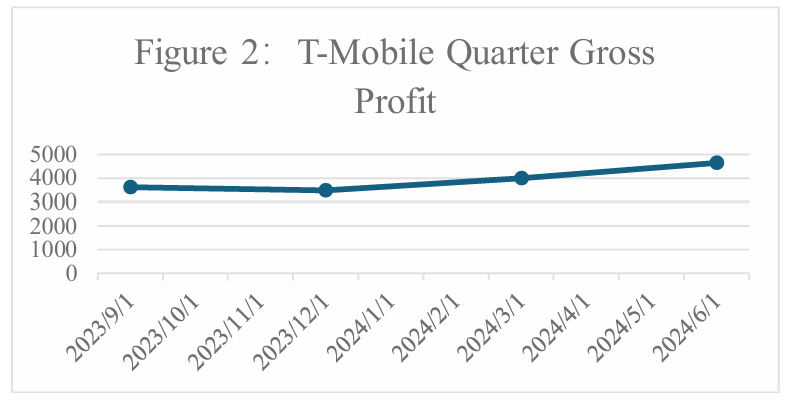
Figure 2: T-Mobile Quarter Gross Profit
In the comparison between T-Mobile and Verizon, T-Mobile shows a significantly higher return in investment. Assuming the growth rates remain the same with this year, T-Mobile provide over 300% return of investment, while Verizon only reach 11.58%. However, to make a more realistic assessment, some adjustment should be made to the statistics of T-Mobile. As T-Mobile have a huge gap between its expected EPS and revenue growth rate, its EPS growth rate should be adjusted to align with its revenue growth rate of 5%, instead of initially projected 33.8%. Additionally, according to Wall Street data analysts, its future P/E ratio would likely decrease from 25 to around 20. After these adjustments simulates a relatively realistic condition for T-Mobile, the expected return of T-Mobile still stands at 35.09% stock return, which remains considerably higher than Verizon’s 11.58%.
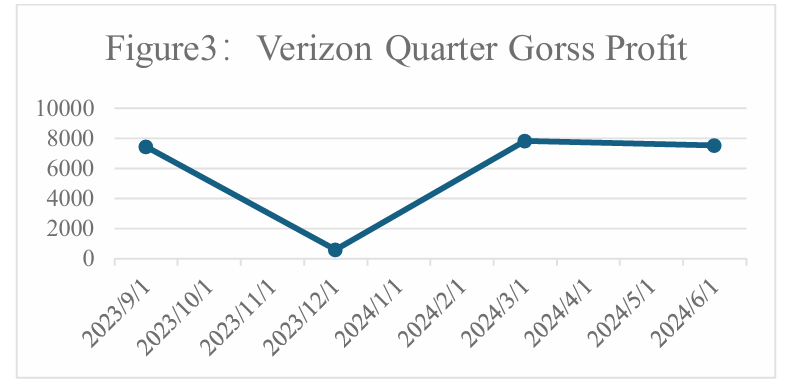
Figure 3: Verizon Quarter Gross Profit
Furthermore, both companies’ latest quarterly gross margin trends provides investors with some insights, as shown in figure 2 and figure 3. Verizon continues to experience fluctuations in gross profit, struggling to recover from past negative impacts. On the other hand, T-Mobile had already showed improvements on its quarterly gross profit, demonstrating an increasing trend. This trend further supports T-Mobile's stronger investment potential compared to Verizon.
4.7.Investment Choice
The four companies are characterized into two groups by the financial metrics. AT&T and US Cellular present significant investment risks due to their unfavorable P/E ratios, negative EPS growth rates, and gross margin trends. Specifically, AT&T's fluctuating gross margins and low GP/A ratio suggests uncertainties surrounding its future performance. US Cellular’s exceptionally high P/E ratio further limits its appeal, indicating a potential overvaluation and future risks.
In contrast, Verizon and T-Mobile display stronger financial stability. Verizon's gross margin fluctuations and increasing future P/E ratio suggest potential current overvaluation and recovery challenges. On the other hand, T-Mobile appears as a more attractive investment option. Despite its relatively high initial P/E ratio and the significant gap between its EPS and revenue growth rates, adjustments for a more realistic scenario still demonstrate a considerable rate of return compared to Verizon.
Overall, T-Mobile's superior growth potential, stable gross margin improvements, and favorable return projections position it as the most promising investment among the four companies. While it is worth noting that T-Mobile has exceptionally high EPS growth rate that may not continue, and the telecommunication sector may subject to another adverse market situation, its strong financial performance and capability to overcome difficulties offered a compelling case for investors looking for growth and stability in the telecommunication sector.
5.Conclusion
The U.S. telecommunications sector is a highly competitive sector with high uncertainty, driven by rapid technological developments and major events, such as the emergence of 5G technology. This essay tries to recommend an investment choice based on various financial metrics such as P/E ratio, EPS and EPS growth rates, gross margin and gross margin trends, GP/A ratio and net profit margin. The four major players—Verizon, AT&T, T-Mobile, and U.S. Cellular—have different company positionings. It is worth noting that Verizon, AT&T, and T-Mobile control over 85% of market shares, each of them with similar amounts, while US Cellular is significantly smaller, holding only 1-2% of market shares.
AT&T combines telecom services with broadband and entertainment offerings, appealing to consumers seeking bundled services. However, despite its strong market share and diversified services, AT&T struggles with fluctuating gross margins, a declining EPS growth rate, and low GP/A ratio, signaling heightened risks for investors. Its inability to recover from past adverse market conditions makes it a less favorable option.
U.S. Cellular targets niche rural markets, maintaining a loyal customer base despite having limited growth compared to national competitors. With its small market share and negative growth metrics, US Cellular faces potential overvaluation and long-term risks due its exceptionally high P/E ratio, low growth rates and limited potential of rural markets.
Verizon focuses on its superior 5G network quality and reliability, serving premium customers with top-tier mobile and broadband services and showing signs of stagnation with its increasing P/E ratios and decreasing gross margins over time. However, its recovery from the 2022 downturn has been slow, and its fluctuating profitability indicates potential challenges in maintaining long-term financial stability. Though Verizon offers some potential future growth, its underperformance in financial metrics in recent years relative to T-Mobile diminishes its attractiveness as an investment.
T-Mobile positions itself as a fast-growing, customer-centric provider, excelling in 5G coverage with aggressive pricing and marketing strategies after its Sprint merger. With its robust EPS and revenue growth rates, improving gross margin trends, and stable performance, T-Mobile demonstrates a strong ability to navigate market challenges. Although its exceptionally high EPS growth rate may not be sustainable long-term, adjusted projections still indicate a considerable return on investment. T-Mobile's leadership in 5G coverage, combined with its resilient financial metrics, positions it as the top contender in the sector for investors seeking both growth and stability.
References
[1]. U.S. Telecom Services Market Size, Share & Trends Analysis Report by Service Type (Mobile Data Services, Machine-to-Machine Services), by Transmission (Wireline, Wireless), by End-Use, and Segment Forecasts, 2024 - 2030. Retrieved from https://www.grandviewresearch.com/industry-analysis/us-telecom-services-market-report.
[2]. Wu, W. (2013). The forward E/P ratio and earnings growth. (Working Paper). University of Massachusetts Boston. Retrieved from http://papers.ssrn.com/sol3/papers.cfm?abstract_id=1014177.
[3]. Yee, K. (2004). Forward versus trailing earnings in equity valuation. Review of Accounting Studies, 9(2-3), 301-329.
[4]. Basu, S. (1977). Investment performance of common stocks in relation to their price-earnings ratios: A test of the efficient market hypothesis. The Journal of Finance, 32(3), 663-682.
[5]. Casson, P. and McKenzie, G. (2007). A Comparison of Measures of Earnings Per Share. The European Journal of Finance, 13(3), 283–298. https://doi.org/10.1080/13518470601024865.
[6]. Berk, J. and DeMarzo, P. (2017). Corporate Finance (4th ed.). Pearson.
[7]. Verizon Inc. (2024). Annual Report 2023. Retrieved from https://www.sec.gov/ix?doc=/Archives/edgar/data/732712/000073271224000052/vz-20240630.htm.
[8]. United States Cellular Corporation (2024). Annual Report 2023. Retrieved from https://www.sec.gov/ix?doc=/Archives/edgar/data/821130/000082113024000053/usm-20240630.htm.
[9]. T-Mobile US, Inc. (2024). Annual Report 2023. Retrieved from https://www.sec.gov/ix?doc=/Archives/edgar/data/1283699/000128369924000111/tmus-20240630.htm.
[10]. AT&T Inc. (2024). Annual Report 2023. Retrieved from https://www.sec.gov/ix?doc=/Archives/edgar/data/732717/000073271724000009/t-20231231.htm.
Cite this article
He,X. (2025). Overview of Major Players in Telecommunication: Investment Analysis. Advances in Economics, Management and Political Sciences,145,88-95.
Data availability
The datasets used and/or analyzed during the current study will be available from the authors upon reasonable request.
Disclaimer/Publisher's Note
The statements, opinions and data contained in all publications are solely those of the individual author(s) and contributor(s) and not of EWA Publishing and/or the editor(s). EWA Publishing and/or the editor(s) disclaim responsibility for any injury to people or property resulting from any ideas, methods, instructions or products referred to in the content.
About volume
Volume title: Proceedings of ICFTBA 2024 Workshop: Human Capital Management in a Post-Covid World: Emerging Trends and Workplace Strategies
© 2024 by the author(s). Licensee EWA Publishing, Oxford, UK. This article is an open access article distributed under the terms and
conditions of the Creative Commons Attribution (CC BY) license. Authors who
publish this series agree to the following terms:
1. Authors retain copyright and grant the series right of first publication with the work simultaneously licensed under a Creative Commons
Attribution License that allows others to share the work with an acknowledgment of the work's authorship and initial publication in this
series.
2. Authors are able to enter into separate, additional contractual arrangements for the non-exclusive distribution of the series's published
version of the work (e.g., post it to an institutional repository or publish it in a book), with an acknowledgment of its initial
publication in this series.
3. Authors are permitted and encouraged to post their work online (e.g., in institutional repositories or on their website) prior to and
during the submission process, as it can lead to productive exchanges, as well as earlier and greater citation of published work (See
Open access policy for details).
References
[1]. U.S. Telecom Services Market Size, Share & Trends Analysis Report by Service Type (Mobile Data Services, Machine-to-Machine Services), by Transmission (Wireline, Wireless), by End-Use, and Segment Forecasts, 2024 - 2030. Retrieved from https://www.grandviewresearch.com/industry-analysis/us-telecom-services-market-report.
[2]. Wu, W. (2013). The forward E/P ratio and earnings growth. (Working Paper). University of Massachusetts Boston. Retrieved from http://papers.ssrn.com/sol3/papers.cfm?abstract_id=1014177.
[3]. Yee, K. (2004). Forward versus trailing earnings in equity valuation. Review of Accounting Studies, 9(2-3), 301-329.
[4]. Basu, S. (1977). Investment performance of common stocks in relation to their price-earnings ratios: A test of the efficient market hypothesis. The Journal of Finance, 32(3), 663-682.
[5]. Casson, P. and McKenzie, G. (2007). A Comparison of Measures of Earnings Per Share. The European Journal of Finance, 13(3), 283–298. https://doi.org/10.1080/13518470601024865.
[6]. Berk, J. and DeMarzo, P. (2017). Corporate Finance (4th ed.). Pearson.
[7]. Verizon Inc. (2024). Annual Report 2023. Retrieved from https://www.sec.gov/ix?doc=/Archives/edgar/data/732712/000073271224000052/vz-20240630.htm.
[8]. United States Cellular Corporation (2024). Annual Report 2023. Retrieved from https://www.sec.gov/ix?doc=/Archives/edgar/data/821130/000082113024000053/usm-20240630.htm.
[9]. T-Mobile US, Inc. (2024). Annual Report 2023. Retrieved from https://www.sec.gov/ix?doc=/Archives/edgar/data/1283699/000128369924000111/tmus-20240630.htm.
[10]. AT&T Inc. (2024). Annual Report 2023. Retrieved from https://www.sec.gov/ix?doc=/Archives/edgar/data/732717/000073271724000009/t-20231231.htm.