


1. Introduction
The pharmaceutical industry has always been an important player in the global healthcare market. And it is notably that the industry also contributed a lot to the financial markets in the past decades, as Joan stated that there has been an increasing financialisation of the pharmaceutical industry from the beginning of the 1980s, which has completely changed the way how pharmaceutical companies operates and develop, especially in terms of shareholders’ value and the pricing battle for different drugs [1]. Over the past decade, the industry has experienced considerable growth from 510.7087 to 1,100.85, based on the Pharmaceutical Index (DRG) Historical Data [2]. Various factors have driven this considerable growth, including, but not limited to, the consistent progress in medical research, the advancement in artificial intelligence that aided in pharmaceutical research and production, the increasing population of elders, the appearance of new and complex diseases, most notably, Coronaviruses (COVID-19) that caused the global pandemic, but on the other hand, boosted the growth of the global healthcare industry. As a result, the pharmaceutical sector of the stock market has shown countless investment opportunities and has become an attractive area for profit-seeking investors who have high expectations and are ready to make a move in this sector to get potential returns. However, countless opportunities also mean numerous traps; it is indeed difficult to identify the most profitable companies efficiently and successfully within the pharmaceutical industry. Although various financial ratios can provide information about a firm’s profitability, detailed studies comparing these metrics across major pharmaceutical companies are scant. Thus, this paper aims to fill the gap by calculating and analyzing the financial performance of four major pharmaceutical companies in the United States: Pfizer Inc., Johnson & Johnson, Bristol-Myers Squibb, and Merck & Co., Inc. Detailed analysis of profitability ratios will be conducted, including Gross Profit Margin (GPM), Net Profit Margin (NPM), Gross Profit to Asset Ratio (GP/A), and Return on Equity (ROE). By the end of the analysis, this paper aims to offer valuable insights to potential investors and demonstrate the importance of fundamental analysis in decision-making.
2. Company Overview
2.1. Introduction to Selected Companies
This paper focuses on four leading companies within the pharmaceutical industry sector, namely, Pfizer Inc. (PFE), Johnson & Johnson (JNJ), Bristol-Myers Squibb (BMY), and Merck & Co., Inc. (MRK).
2.1.1. Pfizer Inc. (PFE)
Pfizer is a global biopharmaceutical company, and it is well-known for its comprehensive product portfolio across vaccines, oncology, and cardiovascular health [3]. During the global COVID-19 pandemic, the company gained international recognition and a reputation for developing its mRNA vaccine COMIRNATY with the German biotechnology company BioNTech. Because of its effectiveness against COVID-19, the demand for the COMIRNATY vaccine maintained solid growth and generated significant revenues for Pfizer during the pandemic. Based on the Pfizer 2022 annual report, COMIRNATY accounted for 38% of Pfizer’s total revenue in 2022. Besides the success of the COVID-19 vaccine, Pfizer’s cardiovascular product Eliquis, a blood thinner that is used to treat and prevent certain types of blood clots, provided the company with revenue of $6,480 million in 2022, displayed an important financial impact on Pfizer’s earning alongside the COVID-19 vaccine and related medication nirmatrelvir and ritonavir tablets[4]. With the recent acquisition of Seagen Inc. in December 2023, Pfizer undoubtedly became a strong competitor in the oncology market for targeted cancer treatment [4].
2.1.2. Johnson & Johnson (JNJ)
Johnson & Johnson is a healthcare firm with a long history. It was initially founded in 1886 in New Jersey, and the company was only selling sterile surgical dressing pads. Later on, it expanded into a medical conglomerate that went public in 1944 on the New York Stock Exchange[5]. With its excellent company culture and effective management, the company gradually expanded into a conglomerate that operates in pharmaceuticals, medical technology (MedTech), and consumer health product segments. By 2022, Johnson & Johnson achieved a total sale of $94.9 billion, with its pharmaceutical segment accounting for 55.4% of the total sales, the MedTech segment accounting for 28.9%, and the Consumer Health segment accounting for 15.7% [6]. Further, within the Pharmaceutical Therapeutic Area, Johnson & Johnson displayed a diverse product line encompassing immunology, Infectious Diseases, Neuroscience, oncology, Pulmonary Hypertension, and Cardiovascular. This diversity of business models and product lines allowed the company to remain competitive in the healthcare market [6].
2.1.3. Bristol-Myers Squibb (BMY)
Bristol-Myers Squibb is a biopharmaceutical company that focuses on Hematology and Oncology, alongside immunology and cardiovascular product lines. By 2022, Bristol-Myers Squibb reached a total net sales of $46.2 Billion, mainly from selling the blood thinner Eliquis and two anti-cancer medications, Opdivo and Pomalyst/Imnovid [7]. Notably, these two anti-cancer medications have emerged as standard treatments for various types of cancer. In the hope of advancing its position in the oncology market, Bristol-Myers Squibb acquired Celgene Corporation for $74 Billion [7]. This strategic acquisition not only bolstered Bristol-Myers Squibb’s oncology product line but also expanded its portfolio of cancer treatment, making Bristol-Myers Squibb a leading biopharmaceutical company in the global market.
2.1.4. Merck & Co., Inc (MRK)
Merck & Co., Inc. is a global healthcare company known for its various vaccines and medications in both pharmaceutical and animal health segments [8]. The company’s primary cancer medication, Keytruda, used in cancer immunotherapy that treats head and neck cancer, has been a significant revenue generator, rewarded with a sale of $20.937 billion in 2022, 35.3% of its total sales. Merck’s other key product is Gardasil, which treats and prevents human papillomavirus-related diseases. It also generated sales of $6.897 billion, 13.26% of its total sales [9]. Merck also has a strong presence in the diabetes market, with products like Januvia and Janumet widely used to manage type 2 diabetes. Additionally, Merk is a research-intensive company with $13.5 Billion in Research & Development expenses in 2022 [9]. This strategic focus on innovation and research helps Merk maintain its competitive position in the pharmaceutical industry.
3. Method
3.1. Analytical Framework
This study utilizes quantitative analysis to examine and compare the financial performance of four selected pharmaceutical companies. The main objective is to evaluate these companies' profitability and operational efficiency by collecting and calculating their key financial ratios. The study uses profitability ratios as the primary research method for several reasons: while other financial ratios can provide various information about the company, industry, and markets, it is the profitability ratios that can provide precise insights into a company's financial performance and health. Furthermore, as profitability ratios also have a significant positive effect on the stock returns, the higher ratios bring more profit to the company, which in turn also benefits the shareholders [10]. After all, the most important concern for investors is the potential returns they can expect from the investment.
3.2. Profitability Ratios
The profitability ratios selected for this study include:
3.2.1. Gross Profit Margin (GPM)
\( Gross Profit Margin=\frac{Net Sales-COGS}{Net Sales} \)
It is the profit the company makes after deducting its business cost and it is displayed as a percentage that shows the proportion of gross profit to revenue [11]. Although gross profit margin varies widely by industry, a relatively high percentage indicates a healthy business performance and an efficient operation [11].
3.2.2. Net Profit Margin (NPM)
\( Net Profit Margin=\frac{Net Income}{Revenue}*100 \)
Similar to the gross profit margin, NPM is the profit after the company deducts all the selling, general, and administrative costs, interests, and taxes [12].Since it represents how much profit the company makes related to its revenue, having a high net profit margin is typically a good indication of healthy financial management of a company, specifically, the company either generates significant profits from its total sales or it has efficiently managed its operating costs and overhead cost accordingly [12].
3.2.3. Gross Profit to Asset (GP/A)
\( Gross Profit to Asset=\frac{Gross Profit}{Total Assets} \)
It is a ratio that measures the efficiency of a company in terms of using its assets to generate gross profits. It is calculated by dividing the gross profit by the company’s total assets and measured on a trailing twelve months (TTM) basis. Based on Robert’s finding, GP/A is efficient in predicting a company’s average return and generally a higher GP/A ratio indicates a higher efficiency; conversely, a lower GP/A ratio indicates a lower efficiency [13].
3.2.4. Return on Equity (ROE)
\( Return on Equity=\frac{Net Income}{Shareholders \prime Equity} \)
It is another ratio for measuring a company’s financial performance in terms of its return on equity investments or net assets [14]. It is calculated by dividing the company’s net income by its shareholder’s equity [14]. Typically, a higher ROE indicates better financial performance. However, a high ROE can also be an indicator of risk in buying that financial performance, as explained in Penman, Stephen H. and Reggiani, Francesco’s finding [15].
3.3. Data Collection
All the financial data from this study are sourced from recent annual reports (Form 10-K) on the U.S. Securities and Exchange Commission (SEC) website and each company’s investor relations pages. In order to get a thorough understanding of each company’s profitability trend over time, this study gathers data from the past four fiscal years.
3.4. Limitations
Although these profitability ratios provide a useful assessment of a company’s financial performance, these ratios cannot account for some external factors, including, but not limited to, the overall market conditions, governmental regulations, changes in technological development within the industry, as these factors can greatly influence company’s profitability. Further, since these ratios are calculated based on historical financial data, they cannot predict the full potential returns or risks of these companies in the future term. Consequently, the findings of this study should not be used as the sole rationale for making any investment decisions.
4. Ratio Analysis
4.1. Pfizer Inc. (PFE)
Table 1: Financial data of PFE
Period Ending: | 12/31/2020 | 12/31/2021 | 12/31/2022 | 12/31/2023 |
Total Revenue | $41,651,000 | $81,288,000 | $100,330,000 | $58,496,000 |
Cost of Revenue | $8,484,000 | $30,821,000 | $34,344,000 | $24,954,000 |
Gross Profit | $33,167,000 | $50,467,000 | $65,986,000 | $33,542,000 |
Net Income | $9,195,000 | $22,025,000 | $31,407,000 | $2,157,000 |
Total Assets | $154,229,000 | $181,476,000 | $197,205,000 | $226,501,000 |
Total Equity | $63,238,000 | $77,201,000 | $95,661,000 | $89,014,000 |
(Data source: Nasdaq.com)
Table 2: Financial Ratios of PFE
GP/A | 21.5% | 27.8% | 33.5% | 14.8% |
ROE | 14.54% | 28.53% | 32.83% | 2.42% |
Gross Profit Margin | 79.6% | 62.1% | 65.8% | 57.3% |
Net Profit Margin | 22.1% | 27.1% | 31.3% | 3.7% |
(Data source: Original)
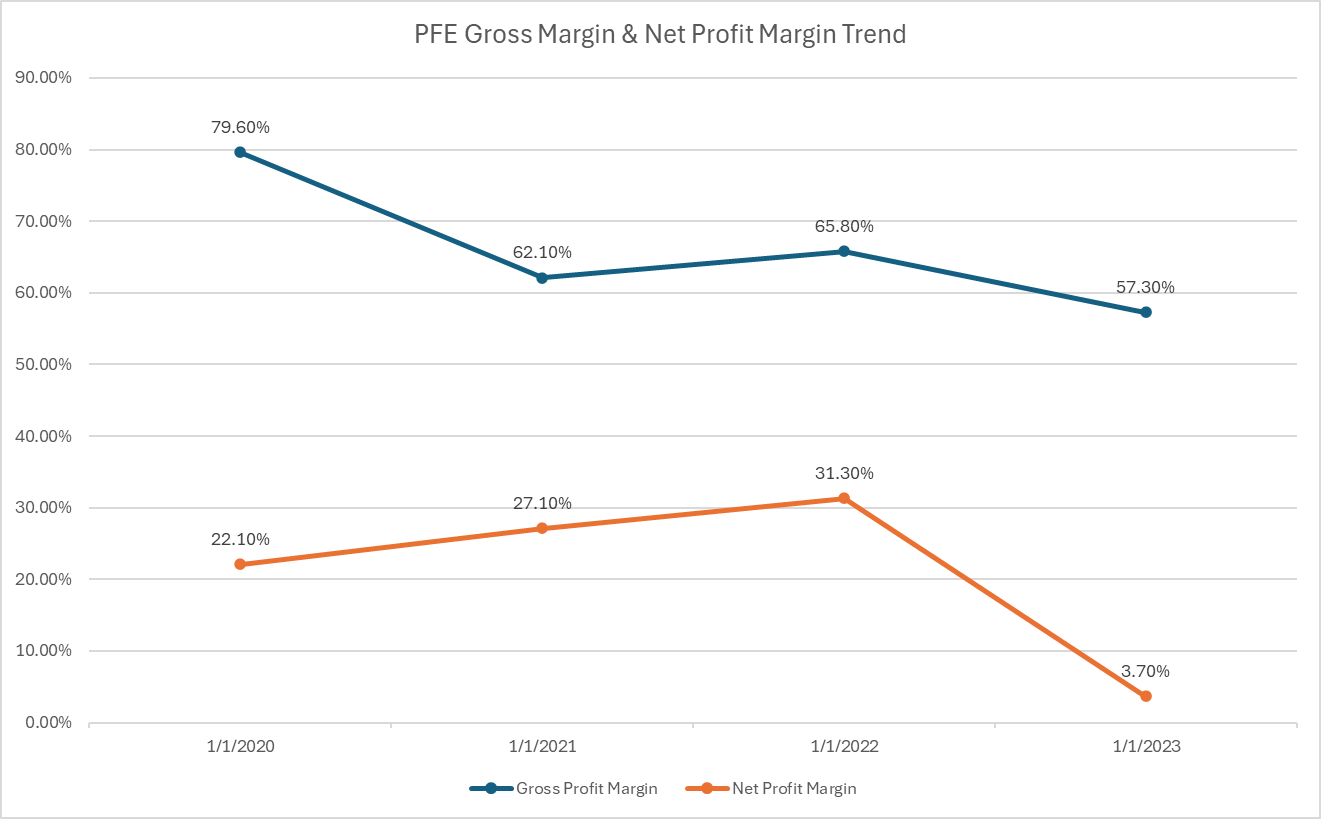
Figure 1: PFE Gross Margin & Net Profit Margin Trend.
(Data source: Original)
Despite its continuous growth in total assets, Pfizer Inc.'s gross profit growth faced a significant setback in 2023. In the preceding three fiscal years, Pfizer maintained a roughly 6% gross profit growth. However, the growth did not continue, with a gross profit of $33,542,000 in 2023(See Table 1), Pfizer.Inc only achieved a GP/A of only 14.8%, a 6.7% drop from its 2020 fiscal year, indicating its low efficiency in using its total assets to generate gross profits (See Table 2). Continue to the Return on Equity ratio, similar to its GP/A, Pfizer’s 2023 result does not look great on paper for investors, as the ROE declined to only 2.42%, a significant 30.41% drop compared to the previous fiscal year. It is evident that Pfizer.Inc. is not operating as efficiently as before in converting its equity into profits. Further, when comparing Pfizer’s Gross Profit Margin and Net profit Margin trend, it is clear that Pfizer’s net profit also suffered a massive decline in the 2023 fiscal year, as the net income dropped to $2,157,000 from the previous year’s $31,407,000, representing a 27.6% decline in term of percentage. Surprisingly, the gross profit margin only experienced an 8.5% drop, resulting in a low steepness in the trend (See Figure 1).
Thus far, the results of Pfizer's profitability ratios have not been promising; possible explanations can be drawn from its annual reports and overall industry condition: the significant growth in Pfizer's profitability ratios (namely, GP/A, ROE, GPM, NPM) from 2020 to the end of 2022 is driven by the increasing demand of COVID-19 vaccines and its related products. As the first pharmaceutical company to release COVID-19 vaccines, Pfizer's total revenues skyrocketed during 2021 and 2022, with its COVID-19 vaccine COMIRNATY and medicine PAXLOVID® (nirmatrelvir tablets and ritonavir tablets) contributing to total revenues by 45.25% and 57%, respectively [4]. However, as more people either got vaccinated or developed antibodies, the sale of COVID-19 products considerably declined in 2023, contributing to its total revenues by only 21% [16]. Further, Pfizer completed the acquisition of Seagen to enhance its competition in the oncology department; however, the acquisition cost approximately $43 billion, and only $120 million in revenue was generated by Seagen's product so far [4]. Thus, it is difficult to determine how long it will take for Pfizer to cover the total acquisition cost from its revenue. Additionally, there is the possibility that Seagen might cause revenue loss in the future, making it even harder to decide whether the acquisition was the right move for Pfizer.
4.2. Johnson & Johnson (JNJ):
Table 3: Financial data of JNJ
Period Ending: | 1/3/2021 | 1/3/2022 | 1/1/2023 | 12/31/2023 |
Total Revenue | $82,584,000 | $78,740,000 | $79,990,000 | $85,159,000 |
Cost of Revenue | $28,427,000 | $23,402,000 | $24,596,000 | $26,553,000 |
Gross Profit | $54,157,000 | $55,338,000 | $55,394,000 | $58,606,000 |
Net Income | $14,714,000 | $20,878,000 | $17,941,000 | $35,153,000 |
Total Assets | $174,894,000 | $182,018,000 | $187,378,000 | $167,558,000 |
Total Equity | $63,278,000 | $74,023,000 | $76,804,000 | $68,774,000 |
(Data source: Nasdaq.com)
Table 4: Financial Ratios of JNJ
GP/A | 31.0% | 30.4% | 29.6% | 35.0% |
ROE | 23.25% | 28.20% | 23.36% | 51.11% |
Gross Profit Margin | 65.6% | 70.3% | 69.3% | 68.8% |
Net Profit Margin | 17.8% | 26.5% | 22.4% | 41.3% |
(Data source: Original)
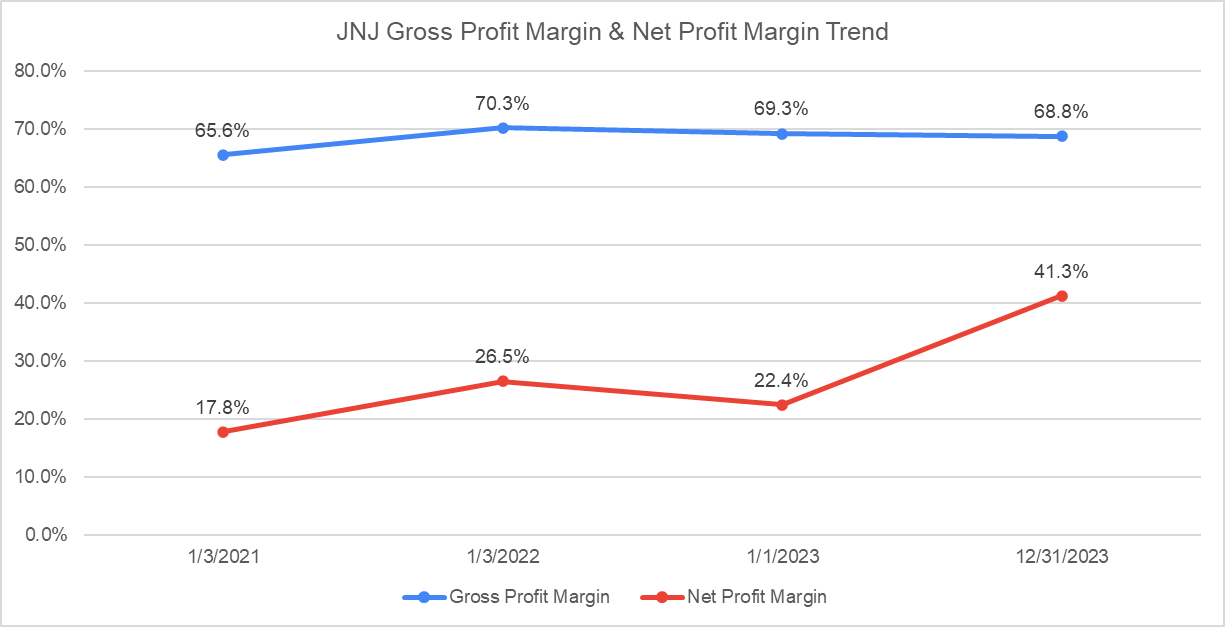
Figure 2: JNJ Gross Margin & Net Profit Margin Trend.
(Data source: Original)
Johnson & Johnson, on the other hand, displayed a slow but steady growth in its total revenues and gross profit, resulting in a stable GP/A and Gross Profit Margin ratio throughout the last four fiscal years. While JNJ had slightly lower assets utilization efficiency in 2023 with a 29.6% GP/A ratio, it is evident that the firm determined the flaws within the operations and successfully addressed them, thus increasing the GP/A ratio dramatically to 35% in the following year, a 5.4% gain. JNJ achieved this progress despite its total assets decreased to $167,558,000, indicating that the firm significantly improved its operational efficiency (See Table 3, 4). Moreover, JNJ’s Return on Equity and Net Profit Margin also displayed remarkable gains over the last two fiscal years, with ROE increased to 51.11% from 23.36% and NPM increased to 41.3% from 22.4%, respectively (See Figure 2), although GPM experienced a slight decline in the same year. Based on the NPM trend, it is evident that JNJ effectively controlled its operational costs, utilized its pricing power, and converted total revenue into actual profit. Although JNJ released an upcoming lower-earning guidance, attributing the cost associated with the acquisition of Shockwave Medical for $13.1 billion and Proteologix, Inc. for $850 million, its capability to maintain stable profitability growth and control operational cost makes JNJ still an advisable investment choice in the pharmaceutical industry [17].
4.3. Bristol-Myers Squibb (BMY):
Table 5: Financial data of BMY
Period Ending: | 12/31/2020 | 12/31/2021 | 12/31/2022 | 12/31/2023 |
Total Revenue | $42,518,000 | $46,385,000 | $46,159,000 | $45,006,000 |
Cost of Revenue | $11,773,000 | $9,940,000 | $10,137,000 | $10,693,000 |
Gross Profit | $30,745,000 | $36,445,000 | $36,022,000 | $34,313,000 |
Net Income | ($9,015,000) | $6,994,000 | $6,327,000 | $8,025,000 |
Total Assets | $118,481,000 | $109,314,000 | $96,820,000 | $95,159,000 |
Total Equity | $37,822,000 | $35,946,000 | $31,061,000 | $29,430,000 |
(Data source: Nasdaq.com)
Table 6: Financial Ratios of BMY
GP/A | 25.9% | 33.3% | 37.2% | 36.1% |
ROE | -23.84% | 19.46% | 20.37% | 27.27% |
Gross Profit Margin | 72.3% | 78.6% | 78.0% | 76.2% |
Net Profit Margin | -21.2% | 15.1% | 13.7% | 17.8% |
(Data source: Original)
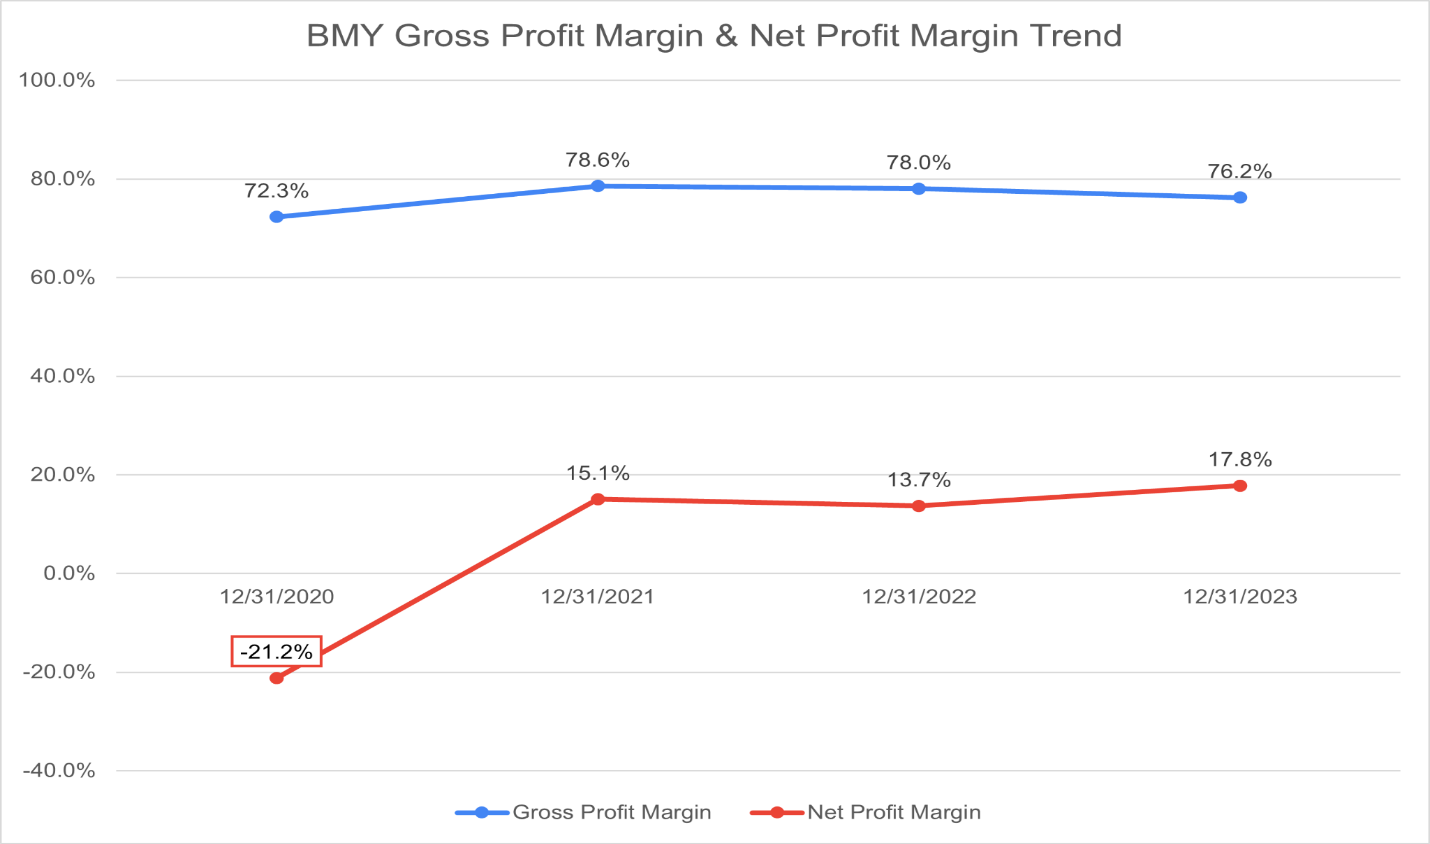
Figure 3: BMY Gross Margin & Net Profit Margin Trend.
(Data source: Original)
Bristol-Myers Squibb’s overall profitability performance is seemingly stable, in which its GP/A ratio fluctuates in the range between 25.9% to 37.2%, and its Gross Profit Margin maintained an average of 76.28% in the last four fiscal years (see Table 6), indicating that the firm has operated efficiently and was able to generate profits from its total assets. While the firm’s net profit margin and ROE in the last three fiscal years also displayed a positive and profitable trend, its ROE and NPM in the fiscal year of 2020 are surprisingly both negative (See Figure 3), along with a net income loss of $9,015,000 (see Table 5). Based on the firm’s annual financial report, the negative income is associated with several acquisitions, including the acquisition of Celgene for $35.7 billion [7]. This acquisition was aimed to further bolster Bristol-Myers Squibb’s competitiveness and innovation in the area of cancer, inflammatory, immunologic, and cardiovascular medicines. Moreover, the acquisition of MyoKardia for $13.1 billion was aimed at producing targeted therapies for cardiovascular diseases [7]. Specifically, this acquisition allows the company to further develop MyoKardia’s leading cardiovascular medicine, Mavacamten, to potentially dominate the cardiovascular area and generate profitable returns in the long term [7]. Additionally, Bristol-Myers Squibb acquired another privately held protein engineering company, Forbius, in the hope of designing and developing biotherapeutics for the treatment of cancer and fibrotic diseases, with an acquisition cost of $185 million upfront payment and $815 million for contingent development payments [7]. Thus, if all these acquisitions can provide Bristol-Myers Squibb with competitive medicines in the future, it is highly possible for the firm to achieve higher revenues and profits in the long term. Nevertheless, the firm current profitability and revenue growth are relatively low in the industry, making it a less profitable choice for investment.
4.4. Merck & Co., Inc. (MRK)
Table 7: Financial data of MRK
Period Ending: | 12/31/2020 | 12/31/2021 | 12/31/2022 | 12/31/2023 |
Total Revenue | $41,518,000 | $48,704,000 | $59,283,000 | $60,115,000 |
Cost of Revenue | $13,618,000 | $13,626,000 | $17,411,000 | $16,126,000 |
Gross Profit | $27,900,000 | $35,078,000 | $41,872,000 | $43,989,000 |
Net Income | $7,067,000 | $13,049,000 | $14,519,000 | $365,000 |
Total Assets | $91,588,000 | $105,694,000 | $109,160,000 | $106,675,000 |
Total Equity | $25,317,000 | $38,184,000 | $45,991,000 | $37,581,000 |
(Data source: Nasdaq.com)
Table 8: Financial Ratios of MRK
GP/A | 30.5% | 33.2% | 38.4% | 41.2% |
ROE | 27.91% | 34.17% | 31.57% | 0.97% |
Gross Profit Margin | 67.2% | 72.0% | 70.6% | 73.2% |
Net Profit Margin | 17.0% | 26.8% | 24.5% | 0.6% |
(Data source: Original)
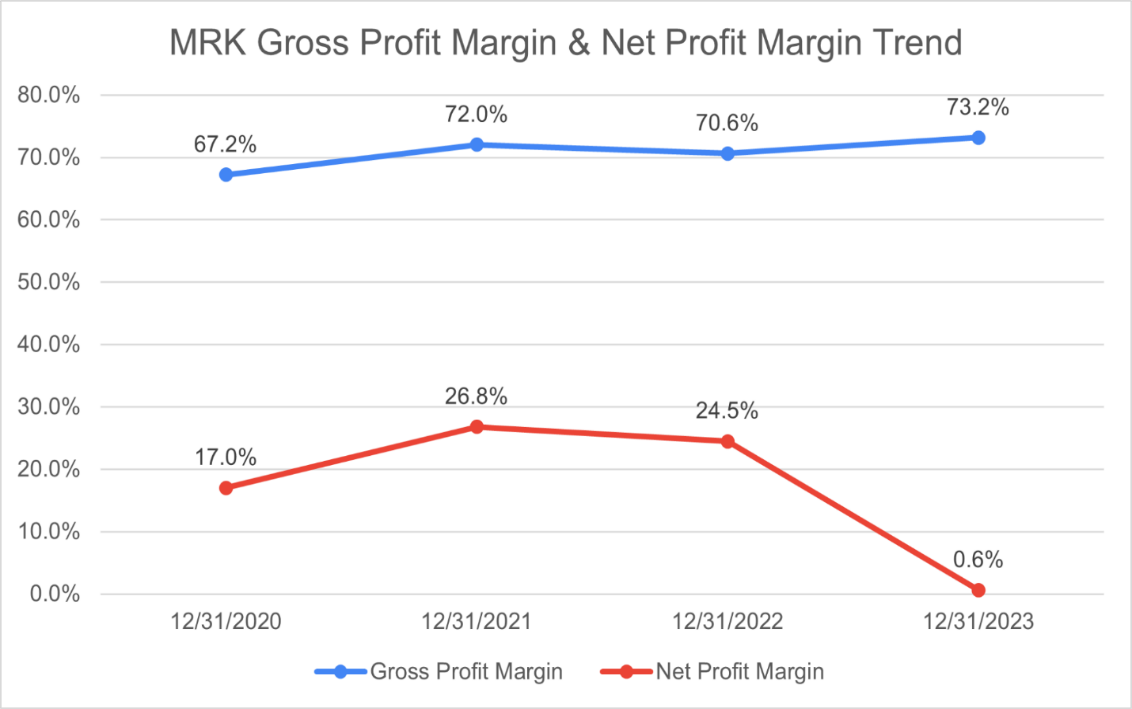
Figure 4: MRK Gross Margin & Net Profit Margin Trend.
(Data source: Original)
Merck & Co., Inc. displayed relatively consistent growth in the past three fiscal years, with its total revenues increasing from $41,518,000 to $60,115,000 and gross profit increasing from $27,900,000 to $43,989,000 (See Table 7). Further, the firm’s GP/A ratio has been relatively stable, with an average of 35.8% over the last four fiscal years, indicating its strong capability of generating gross profit from its total assets, and the gross profit margin has also been consistent with an average of 70.8% (See Table 8). Despite the excellent financial performance of these two profitability ratios, the firm’s net profit margin did not follow the growth trend. Instead, it has displayed a rather volatile trajectory and has dropped to only 0.6% by the end of 2023. Additionally, because of the extremely low net income of $365,000, the firm’s ROE has dropped to merely 0.97%, indicating a possible obstacle to reaching advisable profitability (See Figure 4). Based on the firm’s annual report, these two declines are mainly attributed to the firm’s increased Research and development (R&D) expenses. The firm initially devoted $13.5 billion to R&D expenses in 2022 [9]. However, as the firm seeks more business development and opportunities in 2023, the R&D expenses have risen to $30.5 billion, costing almost 51% of its total revenues [9]. Further, within the R&D expenses, the acquisition of Prometheus Biosciences on June 13 cost approximately $10.8 billion, which accounted for approximately 35.41% of total R&D expenses [9]. Thus, although Merck has shown strong profitability in the GP/A and GPM ratios, its sharp decline in NPM and ROE in 2023 implies a potential drawback on its future profitability. Unless the massive R&D expenses, including its acquisitions and collaborations, pay off in the long term, Merck is perhaps not the best investment choice within the pharmaceutical industry.
5. Risk Analysis
5.1. Ongoing Litigation Risks
The ongoing litigation related to its talc-based products could pose a significant financial risk for Johnson & Johnson. The first lawsuit against JNJ's Talcum-based products appeared in 2009, and since then, JNJ has made many efforts and steps to address the lawsuits. As of May 1, 2024, JNJ has announced its plan to resolve 99.75% of all pending talc lawsuits against the firm and its affiliates in the United States [18]. The total cost to settle the claimants is approximately $6.475 billion, to be paid over 25 years [18]. These legal challenges and the associated expenses could substantially impact JNJ's earnings and negatively influence investor sentiment, potentially affecting stock price stability and shareholder value.
5.2. Patent Expiration Risks
JNJ’s pharmaceutical part operates in a highly competitive product market, and it has to compete with all companies within the pharmaceutical sector, regardless of their operational size. One key factor for JNJ’s competitiveness is its patents of several medicines, as it protects the products from generic competition [6]. However, as patents expire, the company faces the risk of significant revenue loss as generic and similar alternatives enter the market; even more, the newly entered products potentially carry the latest technological innovations, have better performance, and possibly have better pricing and availability [6].
6. Conclusion
The pharmaceutical industry has evolved over several decades, benefiting from technological advancements and increasing global healthcare demands. While many investment opportunities emerged within the sector, it is challenging to get well-informed about every aspect of the companies before making an investment decision. Profitability ratios provide a relatively efficient way to quickly assess a firm's financial performance and eliminate the poor ones from the list. This paper provided a detailed analysis of the financial performance of four leading pharmaceutical companies in the United States through the lens of profitability ratios. The primary goal of this paper was to evaluate each company’s operational efficiency and financial performance over the past four years. The results reveal that while the other three firms had volatile financial performance, Johnson & Johnson (JNJ) stands out as the firm with the most stable and consistent financial performance and growth. Despite operating in a very competitive market, JNJ showed strong operational efficiency, and the company not only maintained a stable gross profit margin but also considerably improved its return on equity and net profit margin in the latest fiscal year, underlining its strategic success. Thus, JNJ displayed a feasible investment option in the pharmaceutical industry. However, investment always comes with potential risks. Specifically, the risks associated with litigation of Talc-based products can affect JNJ’s future earnings since the company is likely to have to increase its legal expenses. Further, with the expirations of its several patents, JNJ is going to face more competitive products from its rivals. Therefore, although JNJ is the most viable investment choice based on the financial analysis, investors should still make their final investment decisions with caution. Finally, the paper not only provides investors with a clear view of each companies’ financial health, but it also unveils the importance of strategic impact on companies’ profitability in the competitive healthcare market.
References
[1]. Busfield, J. (2020). Documenting the financialisation of the pharmaceutical industry. Social Science & Medicine, 258, 113096. https://doi.org/10.1016/j.socscimed.2020.113096
[2]. Mackintosh, P. (n.d.). Pharmaceutical index (DRG) Historical Data. Nasdaq. Retrieved September 23, 2024, from https://www.nasdaq.com/market-activity/index/drg/historical
[3]. Lombardino, J. G. (2000). A brief history of Pfizer Central Research. Bull. Hist. Chem, 25(10).
[4]. Pfizer. (2023, February 23). Form 10-K: Annual report for the fiscal year ended December 31, 2022. Retrieved from SEC EDGAR website http://www.sec.gov/edgar.shtml
[5]. Karim, S., & Mitchell, W. (2004). Innovating through acquisition and internal development: A quarter-century of boundary evolution at Johnson & Johnson. Long Range Planning, 37(6), 525-547. https://doi.org/10.1016/j.lrp.2004.09.008
[6]. Johnson & Johnson. (2023, February 16). Form 10-K: Annual report for the fiscal year ended January 1, 2023. Retrieved from SEC EDGAR website http://www.sec.gov/edgar.shtml
[7]. Bristol-Myers Squibb. (2023, February 14). Form 10-K: Annual report for the fiscal year ended December 31, 2022. Retrieved from SEC EDGAR website http://www.sec.gov/edgar.shtml
[8]. Steele, P. (1994). Company Profile Merck & Co Inc: Analysis of patenting 1991–1994. Expert Opinion on Therapeutic Patents, 4(10), 1161–1172. https://doi.org/10.1517/13543776.4.10.1161
[9]. Merck & Co., Inc. (n.d.). (2023, February 24). Form 10-K: Annual report for the fiscal year ended December 31, 2022. Retrieved from SEC EDGAR website http://www.sec.gov/edgar.shtml
[10]. Nadyayani, D. A. D., & Suarjaya, A. A. G. (2021). The effect of profitability on stock return. American Journal of Humanities and Social Sciences Research (AJHSSR), 5(1), 695-703. Retrieved from https://www.ajhssr.com.
[11]. Shi, F., Huang, B., Wu, C., & Jin, L. (2021). How is gross profit margin overestimated in China? Journal of Mathematics, 2021, Article 3924062. https://doi.org/10.1155/2021/3924062
[12]. Kusmayadi, D., Rahman, R., & Abdullah, Y. (2018). Analysis of the effect of net profit margin, price to book value, and debt to equity ratio on stock return. International Journal of Recent Scientific Research, 9(7), 28091-28095.
[13]. Novy-Marx, R. (2013). The other side of value: The gross profitability premium. Journal of Financial Economics, 108(1), 1-28. https://doi.org/10.1016/j.jfineco.2013.01.003.
[14]. Damodaran, A. (2007). Return on capital (ROC), return on invested capital (ROIC), and return on equity (ROE): Measurement and implications. Social Science Research Network. https://doi.org/10.2139/ssrn.1105499
[15]. Penman, S. H., & Reggiani, F. (2018). Fundamentals of value vs. growth investing and an explanation for the value trap. Financial Analysts Journal, 74(4), 103-119. https://doi.org/10.2139/ssrn.2494412
[16]. Pfizer. (2024, February 22). Form 10-K: Annual report for the fiscal year ended December 31, 2023. Retrieved from SEC EDGAR website http://www.sec.gov/edgar.shtml
[17]. Johnson & Johnson. (2024, February 16). Form 10-K: Annual report for the fiscal year ended December 31, 2023. Retrieved from SEC EDGAR website http://www.sec.gov/edgar.shtml
[18]. Johnson & Johnson. (2024, May 1). Form 10-Q: Quarterly report for the quarterly period ended March 31, 2024. Retrieved from SEC EDGAR website http://www.sec.gov/edgar.shtml
Cite this article
Wei,D. (2025). Pharmaceutical Industry Investment and Profitability: A Review . Advances in Economics, Management and Political Sciences,146,15-25.
Data availability
The datasets used and/or analyzed during the current study will be available from the authors upon reasonable request.
Disclaimer/Publisher's Note
The statements, opinions and data contained in all publications are solely those of the individual author(s) and contributor(s) and not of EWA Publishing and/or the editor(s). EWA Publishing and/or the editor(s) disclaim responsibility for any injury to people or property resulting from any ideas, methods, instructions or products referred to in the content.
About volume
Volume title: Proceedings of ICFTBA 2024 Workshop: Human Capital Management in a Post-Covid World: Emerging Trends and Workplace Strategies
© 2024 by the author(s). Licensee EWA Publishing, Oxford, UK. This article is an open access article distributed under the terms and
conditions of the Creative Commons Attribution (CC BY) license. Authors who
publish this series agree to the following terms:
1. Authors retain copyright and grant the series right of first publication with the work simultaneously licensed under a Creative Commons
Attribution License that allows others to share the work with an acknowledgment of the work's authorship and initial publication in this
series.
2. Authors are able to enter into separate, additional contractual arrangements for the non-exclusive distribution of the series's published
version of the work (e.g., post it to an institutional repository or publish it in a book), with an acknowledgment of its initial
publication in this series.
3. Authors are permitted and encouraged to post their work online (e.g., in institutional repositories or on their website) prior to and
during the submission process, as it can lead to productive exchanges, as well as earlier and greater citation of published work (See
Open access policy for details).
References
[1]. Busfield, J. (2020). Documenting the financialisation of the pharmaceutical industry. Social Science & Medicine, 258, 113096. https://doi.org/10.1016/j.socscimed.2020.113096
[2]. Mackintosh, P. (n.d.). Pharmaceutical index (DRG) Historical Data. Nasdaq. Retrieved September 23, 2024, from https://www.nasdaq.com/market-activity/index/drg/historical
[3]. Lombardino, J. G. (2000). A brief history of Pfizer Central Research. Bull. Hist. Chem, 25(10).
[4]. Pfizer. (2023, February 23). Form 10-K: Annual report for the fiscal year ended December 31, 2022. Retrieved from SEC EDGAR website http://www.sec.gov/edgar.shtml
[5]. Karim, S., & Mitchell, W. (2004). Innovating through acquisition and internal development: A quarter-century of boundary evolution at Johnson & Johnson. Long Range Planning, 37(6), 525-547. https://doi.org/10.1016/j.lrp.2004.09.008
[6]. Johnson & Johnson. (2023, February 16). Form 10-K: Annual report for the fiscal year ended January 1, 2023. Retrieved from SEC EDGAR website http://www.sec.gov/edgar.shtml
[7]. Bristol-Myers Squibb. (2023, February 14). Form 10-K: Annual report for the fiscal year ended December 31, 2022. Retrieved from SEC EDGAR website http://www.sec.gov/edgar.shtml
[8]. Steele, P. (1994). Company Profile Merck & Co Inc: Analysis of patenting 1991–1994. Expert Opinion on Therapeutic Patents, 4(10), 1161–1172. https://doi.org/10.1517/13543776.4.10.1161
[9]. Merck & Co., Inc. (n.d.). (2023, February 24). Form 10-K: Annual report for the fiscal year ended December 31, 2022. Retrieved from SEC EDGAR website http://www.sec.gov/edgar.shtml
[10]. Nadyayani, D. A. D., & Suarjaya, A. A. G. (2021). The effect of profitability on stock return. American Journal of Humanities and Social Sciences Research (AJHSSR), 5(1), 695-703. Retrieved from https://www.ajhssr.com.
[11]. Shi, F., Huang, B., Wu, C., & Jin, L. (2021). How is gross profit margin overestimated in China? Journal of Mathematics, 2021, Article 3924062. https://doi.org/10.1155/2021/3924062
[12]. Kusmayadi, D., Rahman, R., & Abdullah, Y. (2018). Analysis of the effect of net profit margin, price to book value, and debt to equity ratio on stock return. International Journal of Recent Scientific Research, 9(7), 28091-28095.
[13]. Novy-Marx, R. (2013). The other side of value: The gross profitability premium. Journal of Financial Economics, 108(1), 1-28. https://doi.org/10.1016/j.jfineco.2013.01.003.
[14]. Damodaran, A. (2007). Return on capital (ROC), return on invested capital (ROIC), and return on equity (ROE): Measurement and implications. Social Science Research Network. https://doi.org/10.2139/ssrn.1105499
[15]. Penman, S. H., & Reggiani, F. (2018). Fundamentals of value vs. growth investing and an explanation for the value trap. Financial Analysts Journal, 74(4), 103-119. https://doi.org/10.2139/ssrn.2494412
[16]. Pfizer. (2024, February 22). Form 10-K: Annual report for the fiscal year ended December 31, 2023. Retrieved from SEC EDGAR website http://www.sec.gov/edgar.shtml
[17]. Johnson & Johnson. (2024, February 16). Form 10-K: Annual report for the fiscal year ended December 31, 2023. Retrieved from SEC EDGAR website http://www.sec.gov/edgar.shtml
[18]. Johnson & Johnson. (2024, May 1). Form 10-Q: Quarterly report for the quarterly period ended March 31, 2024. Retrieved from SEC EDGAR website http://www.sec.gov/edgar.shtml