


1.Introduction
The healthcare market offers a compelling landscape for value investors, particularly in selecting stocks with future solid performance. Healthcare is a multifaceted and diverse public good characterised by continuous interactions among individuals and organisations. The industry mainly includes different types of patients, professional groups, clinical institutions, treatment methods, healthcare delivery systems, regulatory bodies, non-governmental organisations, and emerging digital intermediary companies [1]. Healthcare is a more stable sector compared to others due to the consistent and growing demand for healthcare services. An ageing population and advancements in medical technology drive this demand. Additionally, many healthcare companies benefit from government support and regulatory policies. These factors make the healthcare market appealing to investors, offering stability and growth potential.
This paper examines four representative companies—Humana, UnitedHealth Group, Elevance Health, and Centene Corporation—holding substantial industry positions. Table 1 presents five largest health insurance companies in the United States as of 2023, and the sum of market share exceeds 40% [2]. The analysis focuses on profitability, stability, and growth potential by examining key financial ratios. These include each selected company’s EPS growth rate, P/E ratio, PEG ratio, and GP/A ratio.
Table 1: Market share of 5 health insurance companies.
|
company |
Market share |
|
UnitedHealth Group |
15% |
|
Elevence Health |
10% |
|
Kaiser Permanente |
9% |
|
Centene |
9% |
|
Humana |
7% |
2.Candidate Company Overview
2.1.Humana
Humana is a prominent U.S. health insurer that focuses on managing Medicare Advantage plans while also providing a variety of employer-based plans. The company strives to improve the quality of life for individuals with Medicare, Medicaid, families, military personnel, and communities as a whole.
Humana operates mainly through two segments: the Insurance segment and CenterWell. The Insurance segment includes the businesses from the former Retail and Group and Specialty segments, as well as the Pharmacy Benefit Manager (PBM) business, which was previously part of the Healthcare Services segment. CenterWell, on the other hand, provides healthcare services, including pharmacy solutions, primary care, and home healthcare services [3].
Humana showed a low revenue which is $106,374,000 and market cap which is 42,208,006,280 last year compared to the other three companies.
Last year, Humana reported relatively lower revenue at $106,374,000 and a market capitalization of 42,208,006,280 compared to the other three companies.
2.2.UnitedHealth Group
UnitedHealth Group, a healthcare and well-being company, offers various insurance plans. Through its Optum franchises, it has built a healthcare services giant covering medical and pharmaceutical benefits, outpatient care, and analytics for affiliated and third-party customers [4].
UnitedHealth Group leads with the highest market capitalization of $535.03 billion and last year's revenue of $371.62 billion among the four companies analyzed. Its operations are divided into several segments, including Optum Health, Optum Insight, Optum Rx, and UnitedHealthcare, which encompasses UnitedHealthcare Employer & Individual, UnitedHealthcare Medicare & Retirement, and UnitedHealthcare Community & State [4].
2.3.Elevance Health
Elevance Health serves approximately 47 million medical members, making it one of the largest health insurers in the United States by medical membership. The company provides coverage plans for employers, individuals, and government-sponsored programs [5]. In addition, it offers services such as commercial Insurance, Medicaid and Medicare.
Elevance Health's segments include Whole Health, Exceptional Experiences, Care Provider Enablement, and its Digital Platform [5]. The company's market capitalization and last year's revenue are detailed in Table 2.
Table 2: Elevence Health’s market cap, revenue and segments.
|
Market cap |
126,076,349,694 |
|
Last year revenue |
$171,340,000 |
2.4.Centene Corporation
Centene Corporation is a managed-care organisation that specialises in government-sponsored healthcare plans. It delivers quality Healthcare to nearly 1 in 15 individuals nationwide, focusing on improving health and healthcare services for low-income and complex populations. Its segments are Medicaid, Medicare, Commercial and Other [6]. Some fundamental details including market cap and last year’s revenue are shown in Table 3.
Table 3: Centene Corporation’s market cap, revenue and segments.
|
Market cap |
$40,688,420,500 |
|
Last year revenue |
$153,999,000 |
2.5.Why companies are key competitors
These companies are key competitors with overlapping services like Medicare and hold a considerable market share in the healthcare industry, and each aims to offer competitive pricing to attract and retain consumers.
3.Method
This paper examines the performance of the four companies in the healthcare market mentioned above through ratio analysis. Value investors prefer cheap and profitable stocks.
Besides share price, the company’s future performance is analysed using EPS growth rate, PEG ratio, and P/E ratios (NTM and TTM). In addition, profitability ratios, especially the Gross Profit to Asset (GP/A) ratio - recognised as the best predictor of returns - are also considered. A detailed introduction of these methods is presented below.
3.1.Earnings per share (EPS)
EPS is part of the profitability ratio, which indicates a firm’s financial performance by calculating profit by the number of shares minus tax expense. If EPS is high, investors will like it. [7]. The formula of EPS is presented in Equation (1).
\( earning per share (EPS)=\frac{earning after tax}{number of shares outstanding} \ \ \ (1) \)
3.2.Price/Earnings-to-Growth (PEG) ratio
The PEG ratio is a useful indicator for evaluating stock market valuations, and it can measure the performance of companies.
According to Peter Lynch (1989), a company is considered fairly valued when its PEG ratio is 1. Moreover, there is a “PEG effect,” where stocks with lower PEG ratios tend to generate better future returns [8]. The formula for PEG ratio is in Equation (2).
\( PEG ratio=\frac{\frac{P}{E}ratio}{EPS growth rate}\ \ \ (2) \)
3.3.P/E ratio (Price-to-Earnings)
The P/E ratio is a key financial ratio used to assess stock values, as many investors believe it signals a security’s future investment performance. Stocks with low P/E ratios are often regarded as undervalued, suggesting they may offer higher returns in the future [9]. The formula for Pis in Equation (3).
\( \frac{P}{E}=\frac{stock price}{earnings per share}\ \ \ (3) \)
3.4.Gross Profit to Asset ratio
The Gross Profits to Assets ratio helps assess how efficiently a company utilises its assets to produce gross profits. A higher ratio indicates better asset efficiency in generating profitability [10].
\( gross profit to asset ratio=\frac{gross profit}{Total assets}\ \ \ (4) \)
3.5.Gross profit margin (GPM)
Gross profit margin is a profitability ratio that indicates the return on gross profit relative to net sales. So, A high gross profit margin (GPM) will be attractive to investors, as it suggests lower relative costs for selling goods and a higher gross profit value. [11]. The formula for gross profit margin is in Equation (5).
\( gross profit Margin=\frac{Net sales-COGS}{Net sales}×100\%\ \ \ (5) \)
3.6.Summary: Good ratios in investing for stocks
Stocks with low P/E and PEG ratios are often favoured, as they are regarded as potentially undervalued, suggesting the possibility of higher expected returns.
The EPS growth rate and GP/A ratio are positively and closely related to a company’s probability. Furthermore, the trend in gross profit margin is analysed, and stocks with stable or increasing trends will be chosen since it is often a sign of strong management and effective cost control.
The most suitable investment option for value investors is identified upon comparing these ratios and stock prices.
4.Analysis
Using the methods/ratios introduced in Section 3, this part will analyse the financial performance of these four healthcare companies’ stock by calculating and comparing their ratios, such as gross margin, P/E ratio, PEG ratio and EPS gross rate.
4.1.Humana Analysis
Humana’s stock, symbolised as “HUM”, presents several concerns for value investors based on a detailed analysis. Firstly, Figure 1 and 2 show the gross profit margin has exhibited a decreasing trend both annually and quarterly. This decline suggests that the company may struggle to control factors like quantity, selling prices, and the cost of raw materials. Also, the data presented in Table 4 illustrates Humana has the lowest Gross Profit to Asset (GP/A) ratio and a negative EPS growth rate, which points to low profitability and inefficient asset utilisation. In other words, the company is not efficiently generating gross profits relative to its assets, which is a critical concern for value investors who prioritise efficiency and profitability. Such problems can undermine a company’s profitability, making it less attractive to value investors.
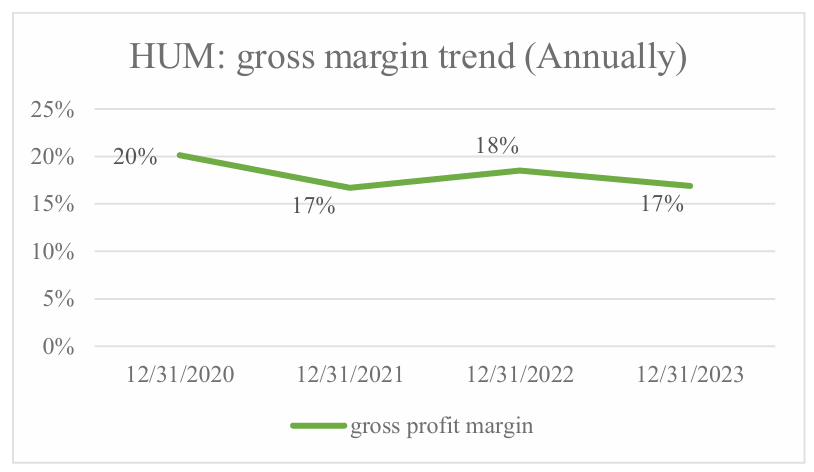
Figure 1: HUM’s annual gross margin trend.
(Picture credit: Original)
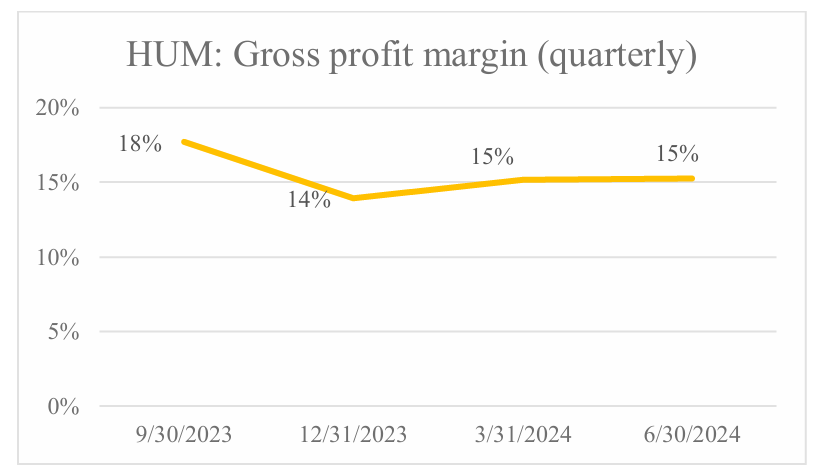
Figure 2: HUM’s quarterly gross margin trend.
(Picture credit: Original)
Table 4: ratios of 4 companies.
|
HUM |
UNH |
ELV |
CNC |
|
|
Share price |
$350.83 |
$558.76 |
$532.07 |
$76.00 |
|
EPS growth rate |
-14% |
14% |
15% |
11% |
|
Revenue growth rate |
9% |
9% |
5% |
8% |
|
TTM P/E |
17.63 |
21.84 |
15.39 |
12.36 |
|
NTM P/E |
20.58 |
19.11 |
13.41 |
11.14 |
|
PEG |
N/A |
1.53 |
1.04 |
1.13 |
|
GP/A (last fiscal year) |
38% |
47% |
43% |
41% |
Moreover, as indicated in Table 1, Humana holds the lowest market share in the healthcare industry, indicating it may have less influence and competitive power than its peers. This market share could limit its growth potential and weaken its position against more dominant competitors. Also, Humana’s competitors may have a more extensive membership base or more significant financial resources than its health plans in the markets.
Finally, Humana’s relatively high P/E ratio suggests a risk of overvaluation. A high P/E ratio often indicates that a stock may be overpriced relative to its earnings, presenting a risk that its price could decline if the market adjusts its valuation expectations.
For these reasons, Humana’s stock (HUM) appears unsuitable for value investors and is therefore rejected from consideration.
4.2.United Health Group And Elevence Health
In comparing UnitedHealth Group (UNH) with Elevence Health (ELV), the following ratio Table 5 reveals no significant difference in share price and EPS growth rate. However, a detailed analysis of their financial ratios, particularly the P/E ratios (including NTM and TTM P/E ratios), highlights Elevence Health’s stronger performance. Elevence Health exhibits notably lower P/E and PEG ratios than UnitedHealth Group. This suggests that the stock ELV is undervalued, with higher potential returns. The PEG ratio of Elevence Health is 1.04, which is very close to the ideal value of 1, indicating a balance between value and growth. This balance is crucial for making informed investment decisions. In addition, since December 31, 2021, Elevance Health has shown an increasing trend in both gross profit margin and GP/A ratio according to the data in Figure 3 and 4, reflecting effective management of operations and maintenance control over its costs and pricing. These improvements contribute to a company’s stability and appeal to value investors.
Table 5: comparing UNH with ELV.
|
UNH |
ELV |
|
|
Share price |
$558.76 |
$532.07 |
|
EPS growth rate |
14% |
15% |
|
Revenue growth rate |
9% |
5% |
|
TTM P/E |
21.84 |
15.39 |
|
NTM P/E |
19.11 |
13.41 |
|
PEG |
1.53 |
1.04 |
|
GP/A (last fiscal year) |
47% |
43% |
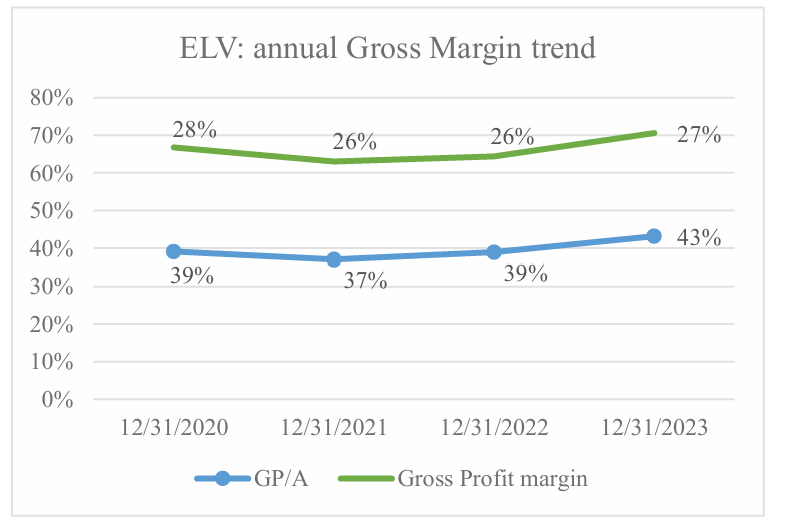
Figure 3: ELV annual gross margin trend.
(Picture credit: Original)
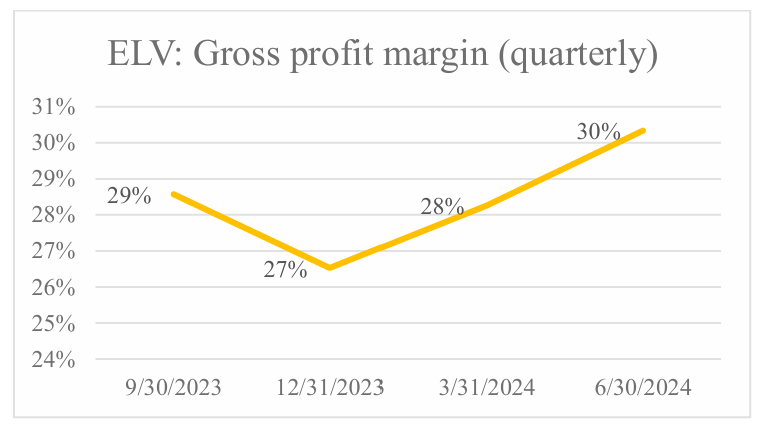
Figure 4: ELV quarterly gross margin trend.
(Picture credit: Original)
Although UnitedHealth Group has the highest GP/A ratio among the four companies, The details in Figure 5 and 6 reveal a concerning trend in gross profit margin annually and quarterly. It typically represents the negative development within a company or company facing challenges to maintain profitability. Therefore, UnitedHealth Group is less favourable in this analysis due to these adverse developments, which could impact its long-term performance.
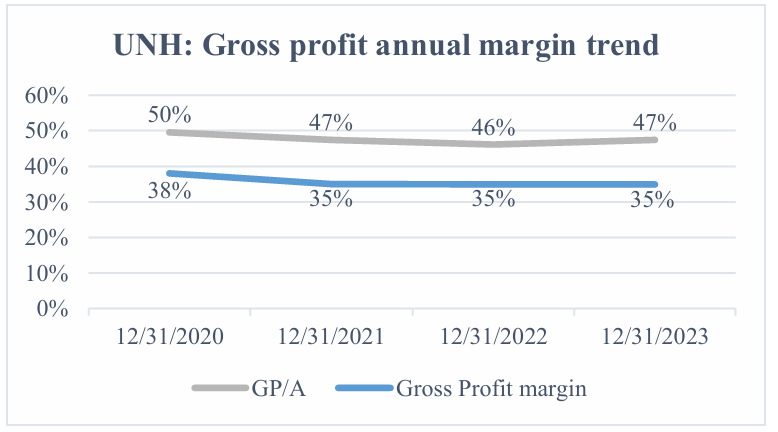
Figure 5: UNH annual gross margin trend.
(Picture credit: Original)
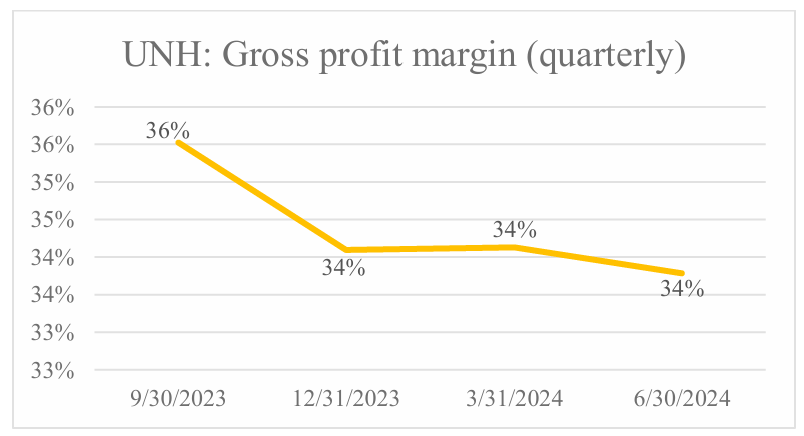
Figure 6: UNH quarterly gross margin trend.
(Picture credit: Original)
4.3.Centene Corporation and Elevence Health
Finally, in comparing Elevence Health (ELV) with the leaving Centene Corporation (CNC), it is essential to recognise that Elevence Health holds certain advantages, such as a higher Gross Profit to Asset (GP/A) ratio, a stronger EPS growth rate and a lower PEG ratio compared to Centene Corporation as indicated in Table 6. However, these factors are not significantly superior when weighted against the notable advantages of Centene Corporation.
Centene Corporation has the lowest P/E ratio among the four companies, indicating its undervaluation and the potential for higher returns. The most important reason for choosing CNC is that Centene’s stock price is markedly lower at $76 compared to Elevence Health’s $532, making it more attractive for value investors. This lower entry cost allows investors to buy shares at a more affordable price and experience a lower risk. Furthermore, both companies have a stable trend in gross profit margin according to the data in Figure 7, 8, 9, 10, signalling consistent profitability.
Table 6: comparing ELV with CNC.
|
ELV |
CNC |
|
|
Share price |
$532.07 |
$76.00 |
|
EPS growth rate |
15% |
11% |
|
Revenue growth rate |
5% |
8% |
|
TTM P/E |
15.39 |
12.36 |
|
NTM P/E |
13.41 |
11.14 |
|
PEG |
1.04 |
1.13 |
|
GP/A (last fiscal year) |
43% |
41% |
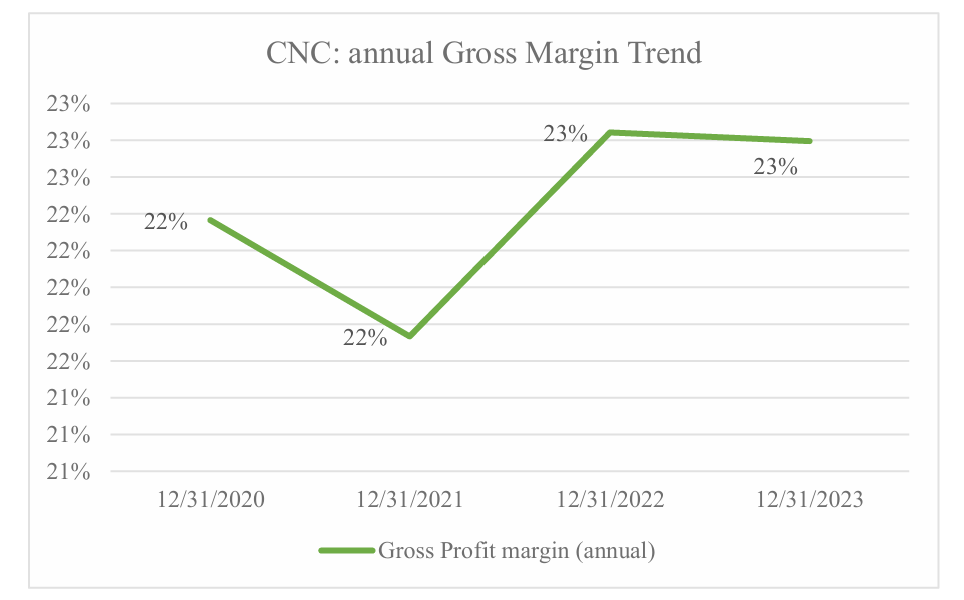
Figure 7: CNC annual gross margin trend.
(Picture credit: Original)
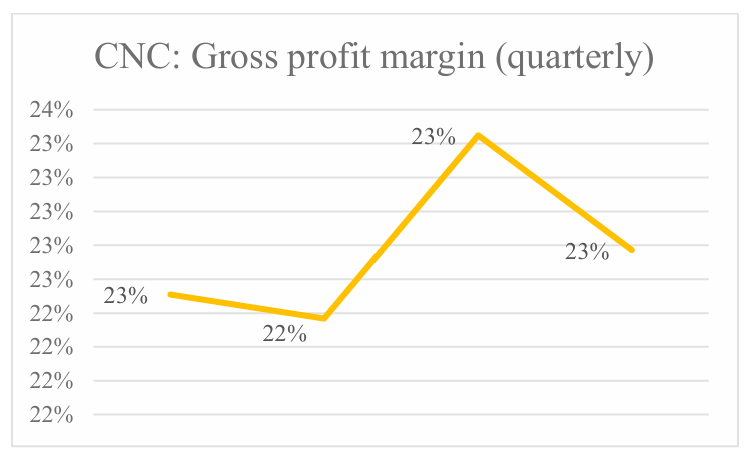
Figure 8: CNC quarterly gross margin trend.
(Picture credit: Original)
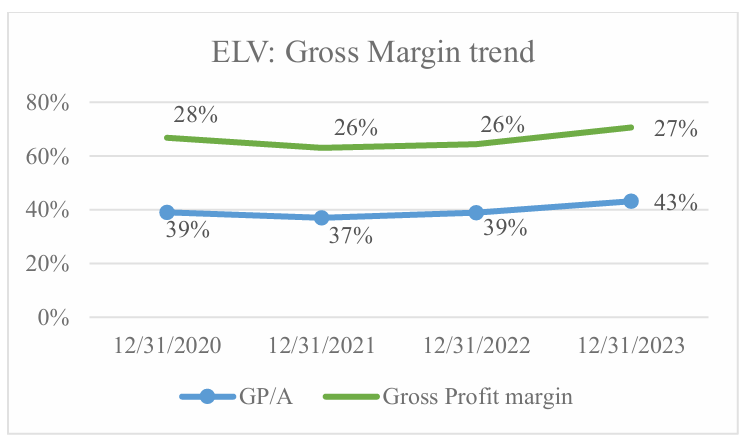
Figure 9: ELV annual gross margin trend.
(Picture credit: Original)
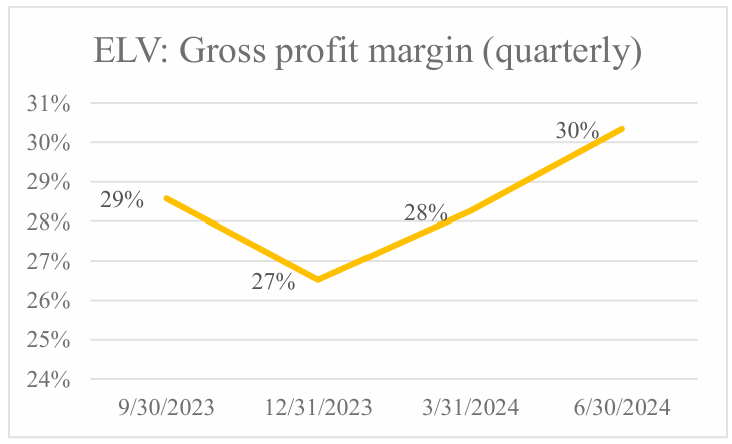
Figure 10: ELV quarterly gross margin trend.
(Picture credit: Original)
Given these factors, Centene Corporation (CNC) will be the final recommended stock, offering a compelling ability for stability, profitability, and cheap stock prices for value investors.
4.4.Summarise the analysis
Determining the final recommended stock by comparing four companies can be challenging. As a result, the first step involved rejecting Humana (HUM) due to its overvaluation and low profitability. Following this, a comparison between UnitedHealth Group (UNH) and Elevance Health (ELV) revealed a preference for ELV, as UNH finds it difficult to maintain profitability. Finally, a comparison between ELV and Centene Corporation (CNC) led to the recommendation of CNC, which stands out due to its stability, profitability, and lower stock price.
4.5.Risk analysis
The ratio analysis is a critical tool for assessing whether the stock is a worthy investment since its advantages need to outweigh the potential risks. Although the final recommendation stock is CNC, it is important to acknowledge the risks that value investors need to consider.
Firstly, Centene's Medicare programs face challenges in maintaining or improving their star ratings. If these ratings do not improve, it could adversely affect the company's current Medicare business and its ability to expand operations, negatively impacting the operations results and financial performance. For example, two Medicare Advantage contracts have received notice of termination for the plan year 2025, and other Medicare Advantage contracts have received Star scores of below 3.0 stars for two consecutive years, which could lead to their termination in the plan year 2026 if their scores do not improve. As a result, the attractiveness of the company’s Medicare Advantage plans may be reduced, directly harming its financial results.
Next, changing eligibility criteria for government-funded healthcare programs could adversely affect Centene Corporation’s operations, financial condition, and cash flows if the company cannot adapt effectively since most company revenues are derived from government-funded healthcare programs such as Medicaid. Changes in these programs could alter the number of individuals enrolled, potentially increasing administrative and Healthcare costs. For example, the declaration of the end of the public health emergency (PHE) and the expiration of eligibility determination waivers are expected to considerably reduce membership in Centene’s Medicaid programs. The anticipated loss of this membership is unlikely to be fully offset through higher enrollment in Health Insurance Marketplace products. Then, states may reduce benefits to maintain or increase eligibility levels, which could adversely affect the company’s financial condition.
Finally, the company has substantial indebtedness, limiting its future performance. The firm’s substantial indebtedness, totalling $17.8 billion as of December 31, 2023, could limit flexibility and negatively affect the financial condition. Further increases or refinancing could impose more restrictions and higher borrowing costs [6].
5.Conclusion
In conclusion, this paper has conducted a thorough comparison of four major stocks in the healthcare industry—Humana (HUM), Elevance Health (ELV), UnitedHealth Group (UNH), and Centene Corporation (CNC)—using ratio analysis to identify the most attractive stock for value investors. After analysing various financial factors, including P/E ratio, PEG ratio, gross profit margin trends, and profitability ratios, Centene Corporation (CNC) emerged as the final recommendation.
Centene’s stock stands out due to its potential undervaluation, cheap stock price and stable management, making it an appealing choice for value investors since the company may have higher returns. Despite facing certain risks, such as challenges in maintaining or improving quality star ratings, high reliance on government-sponsored healthcare programs, and high debt, Centene’s potential for stability and efficient management makes it a compelling investment opportunity. While investors should be mindful of the associated risks, the stock’s advantages position Centene as a worthwhile addition to a value-focused portfolio.
References
[1]. Hermes, S., Riasanow, T., Clemons, E. K., Böhm, M., & Krcmar, H. (2020). The digital transformation of the healthcare industry: exploring the rise of emerging platform ecosystems and their influence on the role of patients. Business Research, 13(3), 1033-1069.
[2]. Vankar, P. (2024, August 6). Top Health Insurance Companies U.S. 2023. Statista. https://www.statista.com/statistics/761446/leading-us-health-insurers-in-the-us-covered-lives/
[3]. Hum-20231231. (n.d.). https://app.quotemedia.com/data/downloadFiling?webmasterId=90423&ref=318077037&type=HTML&symbol=HUM&cdn=27503bbd19d7973f9e58f7ebd94b4c0b&companyName=Humana%2BInc.&formType=10-K&formDescription=Annual%2Breport%2Bpursuant%2Bto%2BSection%2B13%2Bor%2B15%28d%29&dateFiled=2024-02-15 2
[4]. UNH-20231231. (n.d.). https://app.quotemedia.com/data/downloadFiling?webmasterId=90423&ref=318115523&type=HTML&symbol=UNH&cdn=096ef8da519cd83750a59cbf84d8c810&companyName=UnitedHealth%2BGroup%2BIncorporated%2B%28DE%29&formType=10-K&formDescription=Annual%2Breport%2Bpursuant%2Bto%2BSection%2B13%2Bor%2B15%28d%29&dateFiled=2024-02-28
[5]. ELV-20231231. (n.d.). https://app.quotemedia.com/data/downloadFiling?webmasterId=90423&ref=318089106&type=HTML&symbol=ELV&cdn=8427f006877eaf6811da17f2552289be&companyName=Elevance%2BHealth%2BInc.&formType=10-K&formDescription=Annual%2Breport%2Bpursuant%2Bto%2BSection%2B13%2Bor%2B15%28d%29&dateFiled=2024-02-21
[6]. CNC-20231231. (n.d.). https://app.quotemedia.com/data/downloadFiling?webmasterId=90423&ref=318084359&type=HTML&symbol=CNC&cdn=780a95abe43da50efe459df23e158299&companyName=Centene%2BCorporation&formType=10-K&formDescription=Annual%2Breport%2Bpursuant%2Bto%2BSection%2B13%2Bor%2B15%28d%29&dateFiled=2024-02-20#i5a398d1ffc714cf6b3eada4b90cee57f_22
[7]. Bustani, B., Kurniaty, K., & Widyanti, R. (2021). The effect of earning per share, price to book value, dividend payout ratio, and net profit margin on the stock price in Indonesia stock exchange. Jurnal Maksipreneur: Manajemen, Koperasi, dan Entrepreneurship, 11(1), 1-18.
[8]. Cai, C., & Smith, G. (2022). PEG Ratio: The Home Run?.
[9]. Shen, P. (2000). The P/E ratio and stock market performance. Economic review-Federal reserve bank of Kansas city, 85(4), 23-36.
[10]. Zhang, Y. Research on the Impact of Corona Virus in the Perspective of Value Investing—Using ViacomCBS Inc as an Example.
[11]. Nariswari, T. N., & Nugraha, N. M. (2020). Profit growth: impact of net profit margin, gross profit margin and total assests turnover. International Journal of Finance & Banking Studies (2147-4486), 9(4), 87-96.
Cite this article
Zhang,G. (2025). Identifying the Best Investment in Four Stocks. Advances in Economics, Management and Political Sciences,146,219-229.
Data availability
The datasets used and/or analyzed during the current study will be available from the authors upon reasonable request.
Disclaimer/Publisher's Note
The statements, opinions and data contained in all publications are solely those of the individual author(s) and contributor(s) and not of EWA Publishing and/or the editor(s). EWA Publishing and/or the editor(s) disclaim responsibility for any injury to people or property resulting from any ideas, methods, instructions or products referred to in the content.
About volume
Volume title: Proceedings of ICFTBA 2024 Workshop: Human Capital Management in a Post-Covid World: Emerging Trends and Workplace Strategies
© 2024 by the author(s). Licensee EWA Publishing, Oxford, UK. This article is an open access article distributed under the terms and
conditions of the Creative Commons Attribution (CC BY) license. Authors who
publish this series agree to the following terms:
1. Authors retain copyright and grant the series right of first publication with the work simultaneously licensed under a Creative Commons
Attribution License that allows others to share the work with an acknowledgment of the work's authorship and initial publication in this
series.
2. Authors are able to enter into separate, additional contractual arrangements for the non-exclusive distribution of the series's published
version of the work (e.g., post it to an institutional repository or publish it in a book), with an acknowledgment of its initial
publication in this series.
3. Authors are permitted and encouraged to post their work online (e.g., in institutional repositories or on their website) prior to and
during the submission process, as it can lead to productive exchanges, as well as earlier and greater citation of published work (See
Open access policy for details).
References
[1]. Hermes, S., Riasanow, T., Clemons, E. K., Böhm, M., & Krcmar, H. (2020). The digital transformation of the healthcare industry: exploring the rise of emerging platform ecosystems and their influence on the role of patients. Business Research, 13(3), 1033-1069.
[2]. Vankar, P. (2024, August 6). Top Health Insurance Companies U.S. 2023. Statista. https://www.statista.com/statistics/761446/leading-us-health-insurers-in-the-us-covered-lives/
[3]. Hum-20231231. (n.d.). https://app.quotemedia.com/data/downloadFiling?webmasterId=90423&ref=318077037&type=HTML&symbol=HUM&cdn=27503bbd19d7973f9e58f7ebd94b4c0b&companyName=Humana%2BInc.&formType=10-K&formDescription=Annual%2Breport%2Bpursuant%2Bto%2BSection%2B13%2Bor%2B15%28d%29&dateFiled=2024-02-15 2
[4]. UNH-20231231. (n.d.). https://app.quotemedia.com/data/downloadFiling?webmasterId=90423&ref=318115523&type=HTML&symbol=UNH&cdn=096ef8da519cd83750a59cbf84d8c810&companyName=UnitedHealth%2BGroup%2BIncorporated%2B%28DE%29&formType=10-K&formDescription=Annual%2Breport%2Bpursuant%2Bto%2BSection%2B13%2Bor%2B15%28d%29&dateFiled=2024-02-28
[5]. ELV-20231231. (n.d.). https://app.quotemedia.com/data/downloadFiling?webmasterId=90423&ref=318089106&type=HTML&symbol=ELV&cdn=8427f006877eaf6811da17f2552289be&companyName=Elevance%2BHealth%2BInc.&formType=10-K&formDescription=Annual%2Breport%2Bpursuant%2Bto%2BSection%2B13%2Bor%2B15%28d%29&dateFiled=2024-02-21
[6]. CNC-20231231. (n.d.). https://app.quotemedia.com/data/downloadFiling?webmasterId=90423&ref=318084359&type=HTML&symbol=CNC&cdn=780a95abe43da50efe459df23e158299&companyName=Centene%2BCorporation&formType=10-K&formDescription=Annual%2Breport%2Bpursuant%2Bto%2BSection%2B13%2Bor%2B15%28d%29&dateFiled=2024-02-20#i5a398d1ffc714cf6b3eada4b90cee57f_22
[7]. Bustani, B., Kurniaty, K., & Widyanti, R. (2021). The effect of earning per share, price to book value, dividend payout ratio, and net profit margin on the stock price in Indonesia stock exchange. Jurnal Maksipreneur: Manajemen, Koperasi, dan Entrepreneurship, 11(1), 1-18.
[8]. Cai, C., & Smith, G. (2022). PEG Ratio: The Home Run?.
[9]. Shen, P. (2000). The P/E ratio and stock market performance. Economic review-Federal reserve bank of Kansas city, 85(4), 23-36.
[10]. Zhang, Y. Research on the Impact of Corona Virus in the Perspective of Value Investing—Using ViacomCBS Inc as an Example.
[11]. Nariswari, T. N., & Nugraha, N. M. (2020). Profit growth: impact of net profit margin, gross profit margin and total assests turnover. International Journal of Finance & Banking Studies (2147-4486), 9(4), 87-96.