


1. Introduction
The rise of digital currencies, notably cryptocurrencies, has significantly influenced global financial markets. Since Bitcoin's creation in 2009, the market has grown exponentially, with its market capitalization surpassing $2 trillion by mid-2021 before experiencing substantial volatility [1]. Cryptocurrencies are distinct from traditional assets due to their decentralized nature, lack of intrinsic value, and high price volatility. During the COVID-19 pandemic, Bitcoin's correlation with global stock indices, including China's Shanghai Composite Index, notably increased, highlighting potential spillover risks from digital currencies to traditional markets [2][3].
This study aims to fill this gap by providing a comprehensive analysis of the spillover effects of the digital currency market on key sectors of China's financial markets, including equities, commodities, bonds, and foreign exchange. By utilizing advanced econometric models such as the VAR-DCC-GARCH framework, this research will quantify the dynamic correlations and risk transmissions between these markets, offering new insights into the role of digital currencies in China's financial system.
The results of this study will have important implications for financial stability and risk management, particularly in emerging markets like China, where the integration of digital currencies could have far-reaching consequences. Understanding these interactions is crucial for policymakers and market participants as they navigate the challenges and opportunities the digital currency market presents.
2. Literature Review
2.1. Overview of Digital Currency Market
The digital currency market, led by Bitcoin, has rapidly grown into a multi-trillion-dollar asset class, characterized by extreme volatility and speculative trading. This growth has positioned digital currencies as both an alternative investment and a source of financial instability, particularly in emerging markets [1]. Unlike traditional financial assets, digital currencies operate on decentralized blockchain technology, which enhances transparency but also introduces significant price fluctuations driven by market sentiment and regulatory shifts [4][5].
2.2. Spillover Effects in Financial Markets
Spillover effects from digital currencies to traditional markets have become increasingly prominent, especially during periods of economic stress. The VAR and DCC-GARCH models are widely used to quantify these effects, offering insights into the dynamic correlations between digital currencies and other financial assets. For example, Corbet et al. observed that Bitcoin's correlations with traditional markets, such as equities and commodities, intensified during the COVID-19 pandemic, highlighting its potential as a risk transmitter [2]. In the Chinese context, however, the systemic impact of digital currencies remains underexplored, necessitating further investigation using robust econometric models like VAR-DCC-GARCH [3][6].
3. Data and Methodology
3.1. Data Collection and Description
This study utilizes daily logarithmic returns data from five key financial indicators: the Shanghai-Shenzhen 300 Index, the Nanhua Commodity Index, the China Bond New Comprehensive Index, the Renminbi exchange rate, and the S&P Cryptocurrency Broad Digital Market Index. These indices represent a comprehensive cross-section of China's financial markets, encompassing equity, commodity, bond, and foreign exchange sectors, alongside the global digital currency market. The data spans from February 28, 2017, to June 18, 2023, covering a period characterized by significant volatility in both digital and traditional financial markets. The daily frequency of the data enables a detailed examination of the short-term interactions and spillover effects between these markets.
This study obtained the data of the CSI 300 Index and RMB exchange rate from Investing.com and fetched the Nanhua Commodity Index and ChinaBond New Composite Index from the official websites of Nanhua Futures and ChinaBond, respectively. The S&P Cryptocurrency Broad Digital Market Index, launched by S&P Global in 2021, was selected for its comprehensive coverage of the digital currency market, offering a more representative measure than single cryptocurrency indices.
Table 1: Descriptive Statistics of Logarithmic Return Series
Sequence | Δcryp to currency Index | ΔChinaBond New Comprehensive Wealth Index | ΔSouth China Commodity Index | ΔCSI 300 Index | ΔUS Dollar to Chinese Yuan |
Mean | 0.193 | 0.017 | 0.033 | 0.009 | 0.002 |
SD | 4.902 | 0.064 | 1.024 | 1.210 | 0.287 |
Max | 19.074 | 0.677 | 5.281 | 5.777 | 1.577 |
Median | 0.238 | 0.018 | 0.061 | 0.018 | 0.001 |
Min | -27.607 | -0.414 | -5.651 | -8.209 | -1.621 |
Q(10) | 21.671** | 288.812*** | 18.266* | 13.956 | 18.903** |
Q^2(10) | 55.812*** | 8.631 | 179.192*** | 111.436*** | 225.222*** |
Skewness | -0.460 | 1.090 | -0.318 | -0.385 | -0.120 |
Kurtosis | 3.629 | 18.498 | 2.183 | 3.488 | 3.401 |
JB statistic | 894.163*** | 22132.489*** | 329.797*** | 814.057*** | 741.681*** |
Observations | 1531 | 1531 | 1531 | 1531 | 1531 |
Note: The time interval is from February 28, 2017 to June 18, 2023; the yield series are all logarithmic yield × 100; Q(10) and Q^2(10) are the statistics of the Ljung-Box test (Q test) of the logarithmic yield series and the logarithmic yield square series respectively; the JB statistic is the statistic of the Jarque-Bera (JB) test; *, **, *** represent that the corresponding p-values of the statistics are less than 0.1, 0.05 and 0.01 respectively.
From the data it can be known that the average daily return of the S&P Cryptocurrency Index is significantly higher than other indices, at 0.193%, with a standard deviation of 4.902%, reflecting its higher volatility. In contrast, the ChinaBond New Composite Index has the lowest volatility, with a standard deviation of 0.064%. The skewness and kurtosis values indicate that the return distribution is not normally distributed, so it is necessary to use a model that takes these characteristics into account, such as the GARCH framework.
3.2. Methodology
3.2.1. Granger Causality Test
The Granger causality test is employed to assess the mean spillover effects between the digital currency market and the traditional financial markets in China. This test evaluates whether past values of one time series can predict future values of another, indicating a causal relationship in the mean level of returns between the markets.
The Granger causality model used in this study is expressed as follows:
\( ∆{y_{t}}= \sum _{i=1}^{p}{a_{i}}∆{y_{t-i}}+ \sum _{i=1}^{p}{β_{i}}∆{x_{t-i}}+{μ_{y}} \) (1)
Where Δ \( {y_{t}} \) and Δ \( {x_{t}} \) represent the returns of the traditional markets and the digital currency market, respectively. The null hypothesis that \( {β_{1}}{= β_{2}}={β_{3}}=…= {β_{p}}=0 \) implies that the digital currency market does not Granger-cause the traditional market returns.
3.2.2. VAR-DCC-GARCH Model
To capture the dynamic correlations and volatility spillovers between the digital currency market and China's financial markets, the study employs a VAR(1)-DCC-GARCH(1,1) model. This approach allows for the modeling of time-varying correlations and conditional volatilities across multiple markets.
The VAR(1) model is first estimated as follows:
\( {Y_{t}}=C+{A_{1}}{Y_{t-1}}+{ϵ_{t}} \) (2)
Where \( {Y_{t}} \) represents the vector of returns for the five markets, \( C \) is a constant vector, \( {A_{1}} \) is the coefficient matrix for lagged returns, and \( {ϵ_{t}} \) is the error term. Subsequently, the DCC-GARCH model is applied to the residuals \( {ϵ_{t}} \) from the VAR model, capturing the time-varying correlations:
\( σ_{it}^{2}={ω_{i}}+{α_{i}}ϵ_{it-1}^{2}+{β_{i}}σ_{it-1}^{2} \) (3)
\( {R_{t}}={diag({Q_{t}})^{-1/2}}{{Q_{t}}diag({Q_{t}})^{-1/2}} \) (4)
Where \( σ_{it}^{2} \) is the conditional variance, and \( {R_{t}} \) is the dynamic conditional correlation matrix. To determine the appropriate lag length for the VAR model, information criteria like the Akaike Information Criterion (AIC) and Bayesian Information Criterion (BIC) were used. These criteria suggest the optimal number of lags to include in the model, balancing model complexity with goodness of fit. In this study, a first-order VAR model (VAR(1)) was found to be the most suitable. The subsequent application of the DCC-GARCH(1,1) model enabled the examination of how correlations between the digital currency market and traditional Chinese markets evolve over time. The results, particularly during periods of market stress, highlight significant fluctuations in these correlations, suggesting increased interdependence during turbulent periods.
4. Empirical Results
4.1. Granger Causality Test Results
Table 2: Results of Granger causality test
Dependent Variable | Independent Variable | Period 2 | Period 5 | Period 10 | Period 20 |
Digital Currency Index | ChinaBond New Comprehensive Wealth Index | 0.029 | 1.299 | 1.245 | 1.042 |
Digital Currency Index | Nanhua Commodity Index | 0.450 | 1.854* | 1.105 | 0.839 |
Digital Currency Index | CSI 300 Index | 0.186 | 1.121 | 0.897 | 1.018 |
Digital Currency Index | US Dollar to Chinese Yuan | 0.207 | 0.731 | 0.586 | 0.703 |
ChinaBond New Comprehensive Wealth Index | Digital Currency Index | 2.252 | 1.025 | 0.680 | 1.348 |
ChinaBond New Comprehensive Wealth Index | Nanhua Commodity Index | 0.029 | 0.015 | 0.403 | 0.451 |
ChinaBond New Comprehensive Wealth Index | CSI 300 Index | 0.522 | 3.504*** | 2.381*** | 1.520* |
ChinaBond New Comprehensive Wealth Index | US Dollar to Chinese Yuan | 0.370 | 0.253 | 0.162 | 0.487 |
Nanhua Commodity Index | Digital Currency Index | 7.799*** | 4.515*** | 2.981*** | 1.887** |
Nanhua Commodity Index | ChinaBond New Comprehensive Wealth Index | 0.063 | 1.381 | 1.341 | 1.274 |
Nanhua Commodity Index | CSI 300 Index | 0.517 | 0.836 | 0.667 | 0.877 |
Nanhua Commodity Index | US Dollar to Chinese Yuan | 6.100*** | 2.722** | 1.930** | 1.615** |
CSI 300 Index | Digital Currency Index | 4.733*** | 3.507*** | 2.877*** | 1.764** |
CSI 300 Index | ChinaBond New Comprehensive Wealth Index | 0.658 | 0.534 | 0.741 | 1.010 |
CSI 300 Index | Nanhua Commodity Index | 3.311** | 2.605** | 1.624* | 1.377 |
CSI 300 Index | US Dollar to Chinese Yuan | 8.875*** | 4.221*** | 4.163*** | 2.868*** |
US Dollar to Chinese Yuan | Digital Currency Index | 1.086 | 1.935* | 1.108 | 0.641 |
US Dollar to Chinese Yuan | ChinaBond New Comprehensive Wealth Index | 0.748 | 0.626 | 0.618 | 0.796 |
US Dollar to Chinese Yuan | Nanhua Commodity Index | 0.178 | 0.124 | 0.668 | 0.601 |
US Dollar to Chinese Yuan | CSI 300 Index | 3.597** | 1.950* | 1.694* | 1.591** |
Note: The numbers in the table are the F statistics of the coefficient joint test of 0; *, ** and *** represent that the p-values corresponding to the statistics are less than 0.1, 0.05 and 0.01 respectively.
Table 2 presents the Granger causality test results for the five markets across lags of 2, 5, 10, and 20 periods. The findings show that China’s traditional markets do not Granger-cause the digital currency market, indicating no significant predictive or mean spillover effect from the Chinese market to the digital currency market. Conversely, the digital currency index significantly Granger-causes the South China Commodity Index and the Shanghai-Shenzhen 300 Index across all tested lags, suggesting a robust mean spillover effect on China’s commodity and stock markets. Additionally, there are notable mean spillover effects in the paths from the stock market to the bond market, foreign exchange to commodity and stock markets, and between the commodity and stock markets. Overall, the digital currency market demonstrates a leading influence on China's traditional markets, confirming its mean spillover effect.
4.2. VAR-DCC-GARCH Model Results
The VAR-DCC-GARCH model was applied to explore the dynamic relationships and volatility spillovers between the digital currency market and traditional Chinese financial markets. The model's results highlight several key observations:
4.2.1. Dynamic Correlations
The dynamic correlations between the digital currency market and traditional Chinese markets, as shown in Figure 1., estimated by the DCC-GARCH model, exhibit significant time-varying behavior. Throughout the analyzed period, the correlation coefficients indicate a strengthening relationship between the digital currency market and the Shanghai-Shenzhen 300 Index, particularly during periods of heightened market volatility, such as the COVID-19 pandemic. These periods are marked by an increased positive correlation, suggesting that during financial turmoil, the co-movement between digital and traditional markets intensifies, potentially exacerbating systemic risks. Interestingly, the correlation between the digital currency market and the Renminbi exchange rate shows a negative trend, particularly during crisis periods, reflecting the different dynamics governing these two markets.
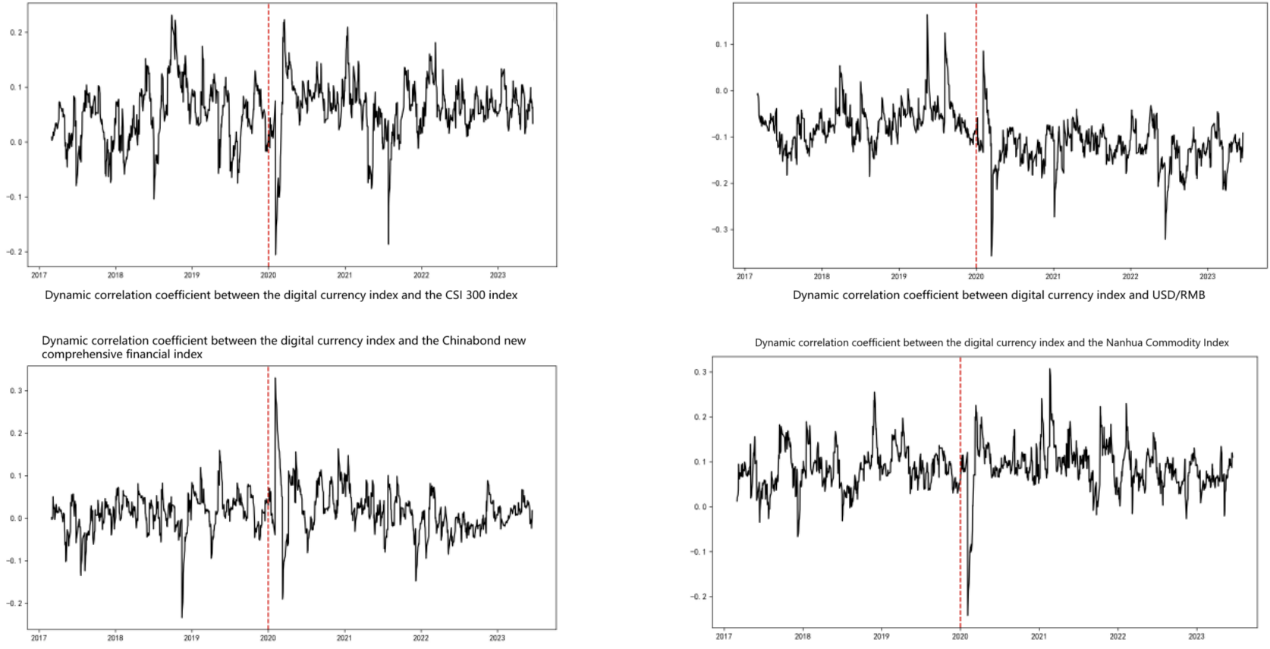
Figure 1: Dynamic correlation coefficient between the digital currency market and the other four traditional markets in China
4.2.2. Conditional Value-at-Risk (CoVaR)
The Conditional Value-at-Risk (CoVaR) analysis provides further insights into the risk spillover from the digital currency market to China's financial markets. The CoVaR approach measures the risk of a financial system given that a particular market is under distress, making it an effective tool for assessing systemic risk contributions.
The results demonstrate that the digital currency market poses substantial risk spillovers to the stock and commodity markets, particularly during volatile periods. For example, during the peak of the COVID-19 crisis, the CoVaR values indicate that a significant downturn in the digital currency market could lead to large potential losses in the Shanghai-Shenzhen 300 Index and the Nanhua Commodity Index. This suggests that during periods of high volatility, the digital currency market can amplify risks across other markets, highlighting the need for integrated risk management strategies that account for these interconnections.
In contrast, the CoVaR analysis shows a lower level of risk spillover to the bond market and the Renminbi exchange rate, reflecting these markets' relative stability against fluctuations in the digital currency market. These findings underscore the importance of monitoring digital currency markets as part of a broader financial stability framework, particularly in economies with significant exposure to global financial trends.
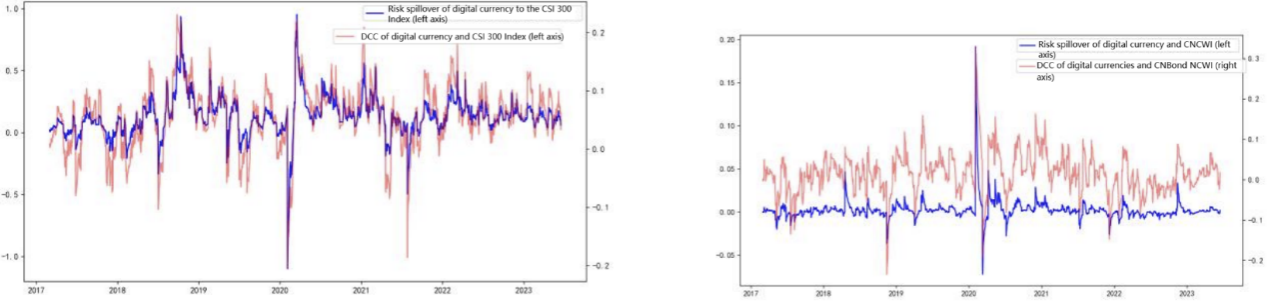
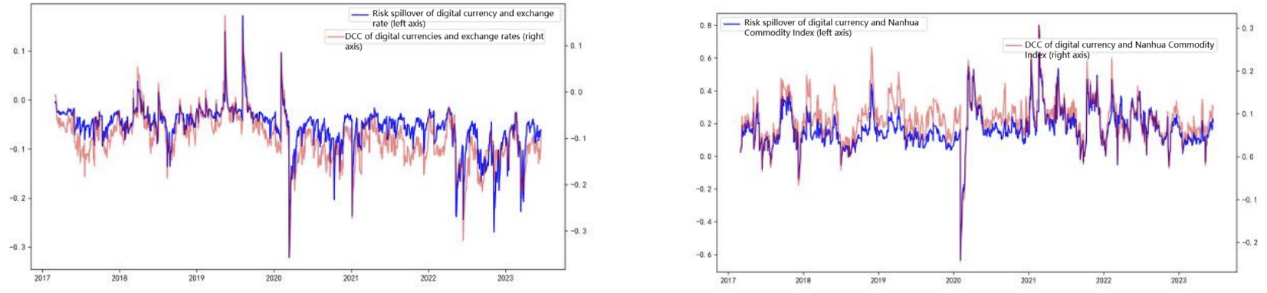
Figure 2: Risk spillover of the digital currency market to the four markets
Table 3: Standardized risk spillover of the cryptocurrency market to the four markets
Market | %ΔCoVaR |
ChinaBond New Comprehensive Wealth Index | -0.12% |
Nanhua Commodity Index | 55.23% |
CSI 300 Index | 20.20% |
US Dollar to Chinese Yuan | -4.29% |
5. Conclusion
This study investigates the spillover effects of the digital currency market on China's traditional financial markets, focusing on key indices such as the Shanghai-Shenzhen 300 Index, the Nanhua Commodity Index, the China Bond New Comprehensive Index, and the Renminbi exchange rate. By employing a VAR-DCC-GARCH model, the research captures the dynamic correlations and volatility spillovers between these markets, providing new insights into the systemic risks posed by digital currencies. The findings reveal significant Granger causality from the digital currency market to China’s stock and commodity markets, highlighting the sensitivity of these markets to fluctuations in digital assets. Additionally, the time-varying correlations observed during periods of economic stress, such as the COVID-19 pandemic, underscore the growing interconnectedness between digital currencies and traditional financial systems.
Despite these valuable insights, the study has several limitations that should be addressed in future research. Firstly, the dataset is limited to daily returns over a specific time period (February 28, 2017 – June 18, 2023), which may not fully capture longer-term trends and spillover effects. Expanding the dataset to include intraday data or extending the time horizon could provide a more comprehensive analysis. Secondly, while the VAR-DCC-GARCH model is effective in capturing dynamic correlations, it may not fully account for non-linearities or structural breaks that could influence the relationship between digital currencies and traditional markets. Future studies could explore alternative models, such as regime-switching models, to address these complexities.
References
[1]. CoinMarketCap. (2021). Cryptocurrency Market Capitalizations. Retrieved from https://coinmarketcap.com/
[2]. Corbet, S., Larkin, C., & Lucey, B. (2020). The contagion effects of the COVID-19 pandemic: Evidence from gold and cryptocurrencies. Finance Research Letters, 35, 101554. doi:10.1016/j.frl.2020.101554
[3]. Umar, M., Hung, N. T., & Chen, S. (2020). Are stock markets and cryptocurrencies connected? The Singapore Economic Review, 65(1), 213-237. doi:10.1142/S0217590820500116
[4]. Nakamoto, S. (2008). Bitcoin: A Peer-to-Peer Electronic Cash System. Retrieved from https://bitcoin.org/bitcoin.pdf
[5]. Böhme, R., Christin, N., Edelman, B., & Moore, T. (2015). Bitcoin: Economics, technology, and governance. Journal of Economic Perspectives, 29(2), 213-238. doi:10.1257/jep.29.2.213
[6]. Engle, R. F. (2002). Dynamic conditional correlation: A simple class of multivariate generalized autoregressive conditional heteroskedasticity models. Journal of Business & Economic Statistics, 20(3), 339-350. doi:10.1198/073500102288618487
Cite this article
Wang,Y. (2025). Study on the Spillover Effect of Cryptocurrency Market on Chinese Market -- Based on VAR-DCC-GARCH Model. Advances in Economics, Management and Political Sciences,149,54-61.
Data availability
The datasets used and/or analyzed during the current study will be available from the authors upon reasonable request.
Disclaimer/Publisher's Note
The statements, opinions and data contained in all publications are solely those of the individual author(s) and contributor(s) and not of EWA Publishing and/or the editor(s). EWA Publishing and/or the editor(s) disclaim responsibility for any injury to people or property resulting from any ideas, methods, instructions or products referred to in the content.
About volume
Volume title: Proceedings of the 3rd International Conference on Financial Technology and Business Analysis
© 2024 by the author(s). Licensee EWA Publishing, Oxford, UK. This article is an open access article distributed under the terms and
conditions of the Creative Commons Attribution (CC BY) license. Authors who
publish this series agree to the following terms:
1. Authors retain copyright and grant the series right of first publication with the work simultaneously licensed under a Creative Commons
Attribution License that allows others to share the work with an acknowledgment of the work's authorship and initial publication in this
series.
2. Authors are able to enter into separate, additional contractual arrangements for the non-exclusive distribution of the series's published
version of the work (e.g., post it to an institutional repository or publish it in a book), with an acknowledgment of its initial
publication in this series.
3. Authors are permitted and encouraged to post their work online (e.g., in institutional repositories or on their website) prior to and
during the submission process, as it can lead to productive exchanges, as well as earlier and greater citation of published work (See
Open access policy for details).
References
[1]. CoinMarketCap. (2021). Cryptocurrency Market Capitalizations. Retrieved from https://coinmarketcap.com/
[2]. Corbet, S., Larkin, C., & Lucey, B. (2020). The contagion effects of the COVID-19 pandemic: Evidence from gold and cryptocurrencies. Finance Research Letters, 35, 101554. doi:10.1016/j.frl.2020.101554
[3]. Umar, M., Hung, N. T., & Chen, S. (2020). Are stock markets and cryptocurrencies connected? The Singapore Economic Review, 65(1), 213-237. doi:10.1142/S0217590820500116
[4]. Nakamoto, S. (2008). Bitcoin: A Peer-to-Peer Electronic Cash System. Retrieved from https://bitcoin.org/bitcoin.pdf
[5]. Böhme, R., Christin, N., Edelman, B., & Moore, T. (2015). Bitcoin: Economics, technology, and governance. Journal of Economic Perspectives, 29(2), 213-238. doi:10.1257/jep.29.2.213
[6]. Engle, R. F. (2002). Dynamic conditional correlation: A simple class of multivariate generalized autoregressive conditional heteroskedasticity models. Journal of Business & Economic Statistics, 20(3), 339-350. doi:10.1198/073500102288618487