


1. Introduction
In the financial market, higher risks are always accompanied by more immense expected returns, which are supposed to influence both investors’ and entrepreneurs’ decisions. The inherent risk associated with equities is among the most prevalent financial uncertainties. Given that stocks are financial instruments issued by corporations and widely utilized by individual investors, their omnipresence across the globe underscores this assertion. Therefore, the Capital Asset Pricing Model (CAPM) was developed to assess investment risks alongside their anticipated returns. CAPM serves as a financial framework that delineates the expected returns for assets, especially equities, while also addressing the overarching risks associated with investment activities.[1]. Regardless of the macroscopic authority of CAPM in calculating returns based on risks in the general financial market, there is little evidence to show how CAPM can be applied to a specific firm, resulting in the significance of testing the practical meaning of CAPM when individuals are investing in a particular firm.
On that account, this essay aims to figure out the importance of applying CAPM to predict returns on stocks using Apple Inc. Regarding as Apple Inc. serves as a pertinent case study due to its status as a prominent and illustrative technology enterprise, enabling the extrapolation of findings to be applicable to other firms within the sector. To be more specific, all data and information, which is available from the Apple website, will be collected and then used to build a CAPM, and discuss how investors and entrepreneurs use the model to make further decisions. After analyzing, it is possible to provide a clear schema for people who are interested in investing in stocks but cannot afford the risks and firms care about overall risks and future profits. Investors will have a better understanding of when they should invest to maximize their expected returns and minimize risks. Companies will easily make decisions to stabilize stock prices in the future according to market fluctuations.
2. Apple Inc. and Why Apple Inc.
After understanding the mechanism of the CAPM model, it's essential to apply this theoretical framework to a real-world company, Apple Inc. here, to evaluate how it reflects the relationship between risk and return. In practice, Apple’s market position, stock performance, and risk exposure significantly influence the application of CAPM.
Apple Inc. is one of the largest and most influential companies in the world, dominating the technology sector through its innovative products, including the iPhone, iPad, Mac, Apple Watch, and a vast ecosystem of software and services. As a leader in the consumer electronics industry, Apple has cultivated a global brand renowned for its quality, innovation, and design elegance. [2]. With a market valuation exceeding $3.3 trillion as of 2024, Apple continues to be one of the most valuable enterprises on the planet.
Besides, Apple’s stock has performed overwhelmingly well over the past years, which has reflected Apple entrepreneurs’ strong business strategies and great investor confidence. Propelled by Apple's continuous business growth and successful product launches, the stock's share price has not only doubled but may have even exceeded this threshold from 2020 to 2024. [3]. Moreover, Apple’s stock is the key element of major indices, like the S&P 500, and often sets the tone for the broader market’s movements.
Despite the strong market performance, Apple Inc. confronts remarkable general market and industry-specific risks. As a multinational corporation, Apple faces a range of macroeconomic challenges, including variations in consumer demand, geopolitical conflicts, and fluctuations in currency exchange rates [4]. Moreover, the technology industry is characterized by significant volatility, driven by swift innovation cycles and relentless demands to create new products.
Given Apple’s tremendous market capitalization, general performance, and exposure to risks, the Capital Asset Pricing Model (CAPM) provides a pragmatic schema for assessing expected returns according to market and company risks. Considering Apple’s sensitivity to market fluctuations, CAPM allows investors to estimate the expected returns based on market risk premiums, which helps them determine if it is reasonable to put Apple stock in their portfolio. In addition, CAPM is valuable for Apple’s internal decision-makers since it helps evaluate whether new projects and innovations provide sufficient returns to justify risks, guiding resource allocation and strategic planning.
3. An overview of Capital Asset Pricing Model
To begin with, a basic understanding of each component in CAPM and its assumptions is a prerequisite before further analysis . Due to the possible value appreciation or depreciation of investment in the future, risks become the key to deciding whether the investment has a higher return, which is the essence of CAPM. The CAPM illustrates how risks will affect the expected returns of investments. The components of CAPM are the risk-free rate (Rfr), investment beta (βa), market return rate (Rm) and expected return (Ra). Thus, CAPM has the formula [5]:
\( \begin{array}{c} Expected Return = Interest rate on risk-free securities x \\ [investment beta x (market return – interest rate on risk-free securities)]\ \ \ (1) \end{array} \)
The formula has the symbolic representation:
\( Ra = Rrf + [βa x (Rm - Rrf)] \) (2)
Expected Return, or Ra, represents the return an investor anticipates receiving from holding a specific asset (assume it is a stock in this essay) over a certain period. This is not a guaranteed return, but rather an estimate based on past performance, market conditions, and risk factors.
Risk-free rate, or Rrf, is the theoretical return on an investment with zero risk. This is typically represented by the yield on government bonds, such as U.S. Treasury securities, because they are considered free from default risk.
Investment Beta, or βa, measures the sensitivity of an asset’s (stock) returns to the returns of the overall market. In other words, it quantifies the asset’s exposure to systematic (market) risk. A beta of 1 indicates that the asset’s price moves in line with the market. A beta greater than 1 means the asset is more volatile than the market (i.e., if the market goes up by 1%, the asset’s return might go up by more than 1%).
Market Risk Premium, or (Rm – Rrf), is the difference between the market return rate and the risk-free rate. It represents the additional return that investors require for investing in a risky market portfolio rather than a risk-free asset [6].
To be noticeable, the CAPM made several assumptions to get a relatively clear formula, which only consists of four variables. First, there should be a linear relationship between risks and returns for easier calculation. Second, all investors in the financial market should hold diversified portfolios. Ultimately, all investors exhibit risk aversion and formulate their decisions based on anticipated returns and the variances associated with portfolio outcomes. Although there are still many more assumptions made in CAPM, only these three will be considered in further analysis.
4. Build the CAPM model for Apple Inc.
Hence, after pointing out the relevance between Apple Inc. and the CAPM, it is time to apply the CAPM to quantify the relationship between Apple’s risk and expected return. By using Apple’s beta, the market premium and the risk-free rate, it is feasible to build a Capital Asset Pricing Model tailored to Apple’s financial data. This will allow us to evaluate how well Apple’s stock compensates investors for taking on market risk and how effectively CAPM reflects Apple’s unique risk profile in the broader market. Besides, all the data will be sourced from official websites, such as Yahoo Finance and CNBC, to ensure the precision of data, resulting in a more robust model. In the following part, the model will be developed and analyzed in detail. To apply the CAPM to Apple Inc., it is dispensable to first know about how the graph will look like and how each variable will be calculated or collected.
Figure 1: The asset’s characteristic line [7]
As shown in Figure1, CAPM should be a linear line, which is the consistent with first assumption mentioned previously. The horizontal axis, as well as the independent variable, should be the market return rate, Rm, and the vertical axis, or the dependent variable, is supposed to be the expected return, Ra. Consequently, other variables, risk-free rate and investment beta, will be deemed as constant when building the CAPM, signifying that these two data should be collected from the website or calculated before.
First, the risk-free rate, Rrf, is often represented by the yield on a 10-year Treasury bond, which can be sourced from government financial websites or financial data providers. According to the data online, the up-to-date 10-year Treasury Rate is at 3.66%, compared to 4.29% last year. Thus, the risk-free rate will be counted as 3.66% in this model [8].
Additionally, the investment beta, βa, measures the sensitivity of Apple’s stock returns to changes in the market returns. In essence, there are two ways, through calculation or using pre-existed data online, to get accurate beta. The analysis will adopt the second methodology, as determining beta would complicate the evaluation process and diminish the precision of the resultant beta value. The model will incorporate a 5-year monthly beta, currently quantified at 1.24 [9]. The number 1.24 represents that if the market goes up by 1%, the asset’s return might go up by more than 1.24%.
Ultimately, all essential information has been gathered so that it is now capable to build the Capital Asset Pricing Model on Apple Inc. Based on previous operation, T=the CAPM will have the formula:
\( Ra = 3.66 + 1.24 x (Rm - 3.66) \) (3)
Also, the formula can be simplified into a normal linear representation:
\( Ra = 1.24 x Rm – 0.8784 \) (4)
Then, it is possible to graph a regression line chart corresponding with the above formula:
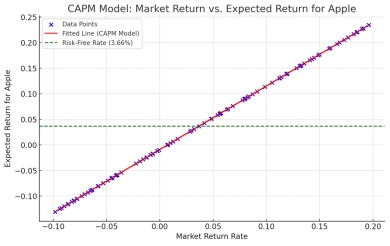
Figure 2: CAPM Model for Apple Inc.
From the Figure2, the red line represents the most fitted Capital Asset Pricing Model, and the green dashed line shows the risk-free rate of 3.66%. Meanwhile, the slope of the red line is the value of investment beta, 1.24.
5. Interpretation of Results for Investors and Entrepreneurs
5.1. Implications for Investors
The CAPM model provides crucial insights into how Apple’s stock may perform in relation to the overall market. Given Apple’s beta of 1.24, which suggests that the stock is more volatile than the market, its price is expected to respond more sharply to fluctuations in the market. Specifically, a 1% change in market returns would likely cause Apple’s stock price to move by 1.24% in the same direction.
Through CAPM’s calculation of the expected return, investors can evaluate whether Apple’s stock offers a sufficient return relative to the risk they are taking. Given the risk-free rate of 3.66%, CAPM estimates Apple’s return beyond this baseline, showing the premium that compensates for the additional market risk. This is especially advantageous for portfolio managers and investors aiming to calibrate risk and return when assessing whether Apple’s stock corresponds with their investment objectives.
By comparing CAPM-predicted returns with Apple’s historical performance, investors can determine whether the stock has historically delivered adequate returns given its risk. If Apple’s actual historical returns exceed the CAPM estimate, this implies that the stock has been delivering excess returns relative to its risk. However, if the returns have fallen short of expectations, investors may need to reconsider their approach to investing in Apple’s stock.
5.2. Predictions about Future Performance
CAPM can also provide a framework for predicting Apple’s future performance. By applying Apple’s beta and the overall market return rate, investors can project how Apple’s stock might behave in response to expected market changes. If the market is anticipated to rise, Apple’s stock may experience larger gains due to its elevated beta.
However, the use of historical data to forecast future performance has inherent limitations. One major limitation of CAPM is its reliance on simplified assumptions, such as the notion that markets are efficient and that investors are rational. These assumptions often fail to account for complex market dynamics and external factors, like regulatory changes or technological innovations, which can substantially influence stock performance[10]. Thus, while CAPM offers a useful benchmark, it should be complemented with other analytical methods to form a complete picture of Apple’s future potential.
5.3. Risk-Adjusted Return
Long-term investors should focus on risk-adjusted returns when considering Apple’s stock. This approach considers not just the total return but also the level of risk taken to achieve it. With Apple’s beta of 1.24, investors face a greater degree of market risk, which means the stock could be more volatile than the market overall. Consequently, returns must adequately remunerate for this increased risk.
For those with a long-term perspective, it is important to assess whether Apple’s returns, as predicted by the CAPM model, justify the additional risk. If Apple continuously exceeds the risk-free rate combined with the market risk premium, it demonstrates that the stock offers an advantageous risk-adjusted return. This is critical for investors who wish to uphold their equity holdings over an extended period, as it ensures they receive appropriate compensation for the risks associated with Apple's market volatility. [11].
5.4. Entrepreneurial Analysis
For entrepreneurs within Apple Inc., CAPM serves not only as a tool for assessing external investment in the company but also as a mechanism to gauge internal resource allocation and strategic decision-making. Since CAPM quantifies the relationship between risk and return, it can help Apple's leadership understand how market-wide risks might impact the company’s valuation and stock price. This is essential for strategizing initiatives, particularly when deploying into new markets or introducing cutting-edge products, as it enables decision-makers to foresee the possible effects of overarching economic trends on their corporate strategies.
Entrepreneurs within Apple can use insights from the CAPM model to align their strategic initiatives with investor expectations. For example, if Apple’s beta indicates sensitivity to market shifts, the leadership team might adopt risk mitigation strategies such as diversifying product lines or optimizing operational efficiencies to reduce market dependence. Additionally, understanding the expected return can guide decisions on capital investment and innovation, helping entrepreneurs at Apple manage both the opportunities and risks of technological advancements.
6. Conclusion
The Capital Asset Pricing Model (CAPM) offers significant insights for both investors and company decision-makers when evaluating the risks and potential returns tied to Apple Inc. By applying CAPM to Apple, this paper illustrates how the model calculates the correlation between the market risks and the expected returns on investing stocks. By utilizing fundamental elements like the risk-free rate, beta, and market risk premium, investors can assess if Apple’s equity offers sufficient compensation for the associated risks, thereby empowering them to make more informed choices regarding their investment strategies.
For Apple’s executives, CAPM provides a strategic framework for predicting how shifts in the market may impact the company’s stock price and valuation. This information can guide decisions on resource distribution and investments in new projects. Although the model has its limitations, particularly regarding assumptions and its reliance on past data, it remains an essential tool for evaluating returns adjusted for risk and shaping both corporate strategy and investment decisions.
In conclusion, the application of the Capital Asset Pricing Model (CAPM) to a corporation such as Apple enables investors to predict expected returns while mitigating market risk, and it provides business executives with enhanced insights into how external economic variables affect their company's financial path. While CAPM should be used alongside other analytical methods, it is still a reliable tool for enhancing both investment strategies and business decision-making.
References
[1]. Bodie, Z., Kane, A., & Marcus, A. J. (2021). Investments (12th ed.). McGraw-Hill Education.
[2]. McKinsey & Company Inc. (2020). Valuation: Measuring and managing the value of companies (7th ed.). Wiley.
[3]. AAPL stock price | Apple Inc.. stock quote (U.S.: NASDAQ) | marketwatch. (n.d.). https://www.marketwatch.com/investing/stock/aapl
[4]. Gallo, C. (2010). The innovation secrets of Steve Jobs: How to make creativity your competitive advantage. McGraw-Hill.
[5]. Cochrane, J. H. (2005). Asset pricing (Revised ed.). Princeton University Press.
[6]. Elton, E. J., Gruber, M. J., Brown, S. J., & Goetzmann, W. N. (2014). Modern portfolio theory and investment analysis (9th ed.). Wiley.
[7]. Harvey, C. R., & Gray, S. (n.d.). Global Financial Management - Asset Pricing Models. People.duke.edu. https://people.duke.edu/~charvey/classes/ba350_1997/capm/capm.htm
[8]. Zandi, M. (2024). Treasury bond yields in 2024: Market expectations and implications. Moody's Analytics. https://www.moodysanalytics.com
[9]. Yahoo! (2024, September 15). Apple Inc. (AAPL) stock price, news, Quote & History. Yahoo! Finance. https://finance.yahoo.com/quote/AAPL/
[10]. Fama, E. F., & French, K. R. (2004). The Capital Asset Pricing Model: Theory and Evidence. Journal of Economic Perspectives, 18(3), 25-46.
[11]. Perold, A. F. (2001). The Journal of Economic Perspectives. American Economic Association.
Cite this article
Fu,Z. (2025). CAPM Insights: Apple's Risk and Expected Returns. Advances in Economics, Management and Political Sciences,151,46-51.
Data availability
The datasets used and/or analyzed during the current study will be available from the authors upon reasonable request.
Disclaimer/Publisher's Note
The statements, opinions and data contained in all publications are solely those of the individual author(s) and contributor(s) and not of EWA Publishing and/or the editor(s). EWA Publishing and/or the editor(s) disclaim responsibility for any injury to people or property resulting from any ideas, methods, instructions or products referred to in the content.
About volume
Volume title: Proceedings of the 3rd International Conference on Financial Technology and Business Analysis
© 2024 by the author(s). Licensee EWA Publishing, Oxford, UK. This article is an open access article distributed under the terms and
conditions of the Creative Commons Attribution (CC BY) license. Authors who
publish this series agree to the following terms:
1. Authors retain copyright and grant the series right of first publication with the work simultaneously licensed under a Creative Commons
Attribution License that allows others to share the work with an acknowledgment of the work's authorship and initial publication in this
series.
2. Authors are able to enter into separate, additional contractual arrangements for the non-exclusive distribution of the series's published
version of the work (e.g., post it to an institutional repository or publish it in a book), with an acknowledgment of its initial
publication in this series.
3. Authors are permitted and encouraged to post their work online (e.g., in institutional repositories or on their website) prior to and
during the submission process, as it can lead to productive exchanges, as well as earlier and greater citation of published work (See
Open access policy for details).
References
[1]. Bodie, Z., Kane, A., & Marcus, A. J. (2021). Investments (12th ed.). McGraw-Hill Education.
[2]. McKinsey & Company Inc. (2020). Valuation: Measuring and managing the value of companies (7th ed.). Wiley.
[3]. AAPL stock price | Apple Inc.. stock quote (U.S.: NASDAQ) | marketwatch. (n.d.). https://www.marketwatch.com/investing/stock/aapl
[4]. Gallo, C. (2010). The innovation secrets of Steve Jobs: How to make creativity your competitive advantage. McGraw-Hill.
[5]. Cochrane, J. H. (2005). Asset pricing (Revised ed.). Princeton University Press.
[6]. Elton, E. J., Gruber, M. J., Brown, S. J., & Goetzmann, W. N. (2014). Modern portfolio theory and investment analysis (9th ed.). Wiley.
[7]. Harvey, C. R., & Gray, S. (n.d.). Global Financial Management - Asset Pricing Models. People.duke.edu. https://people.duke.edu/~charvey/classes/ba350_1997/capm/capm.htm
[8]. Zandi, M. (2024). Treasury bond yields in 2024: Market expectations and implications. Moody's Analytics. https://www.moodysanalytics.com
[9]. Yahoo! (2024, September 15). Apple Inc. (AAPL) stock price, news, Quote & History. Yahoo! Finance. https://finance.yahoo.com/quote/AAPL/
[10]. Fama, E. F., & French, K. R. (2004). The Capital Asset Pricing Model: Theory and Evidence. Journal of Economic Perspectives, 18(3), 25-46.
[11]. Perold, A. F. (2001). The Journal of Economic Perspectives. American Economic Association.