


1.Introduction
Since the beginning of the Internet era in the 20th century, the Internet played a more important role in various areas. It significantly increases people’s life qualities, providing information, entertainment, and services. At the same time, it also develops new platforms and tools for entrepreneurs to achieve their business ambitions. What is more, many sensitive investors earn wealth in the stock market of the Internet industry.
This research proposes an in-depth investment analysis of Amazon, highlighting its potential as a robust investment target. The structure of this analysis is multifaceted, beginning with a valuation perspective that employs the Free Cash Flow to the Firm (FCFF) and the Capital Asset Pricing Model (CAPM) to estimate Amazon's intrinsic value and expected returns. Following this, logistic and multilinear regression models are utilized to examine the relationship between Amazon's stock price and various economic indicators and company-specific factors. A thorough risk analysis is conducted to identify potential threats and challenges facing Amazon, accompanied by suggested hedging strategies to mitigate these risks. The final section synthesizes these insights into a cohesive investment strategy, proposing an optimal approach to capitalize on Amazon's growth potential while managing associated risks.
This comprehensive analysis aims to provide a well-rounded investment thesis, supporting the argument for Amazon as a compelling investment opportunity, comparing it with the risk of investing in other companies that supply e-commerce services to help with a better strategy for the investors.
2.Literature Review
The concept of free cash flow to the firm (FCFF) was first proposed by Alfred Rappaport. It can measure a company's profitability after all expenses and reinvestments, analyzing and comparing the company’s financial health. CAPM was first proposed by William Sharp et al., based on Portfolio Theory and Capital Market Theory. It can be used to calculate the expected return on the investment to check whether it is fairly valued. When it comes to the multiple linear regression model, Ge & Wu used this methodology in their study of the prediction of corn price fluctuation in China [1]. They set production consumption and import and export volume as independent variables and used maize price as the dependent variable to establish a multiple linear regression model. In the study of Darryll Hendricks, he tested and verified the performance of the value-at-risk model (VAR) with historical data, applying twelve value-at-risk approaches to 1,000 randomly chosen foreign exchange portfolios and using nine criteria to evaluate model performance [2].
A Comparative Analysis of Amazon, Microsoft, and Apple's Stock Investment Value by Yimeng Ma mainly focuses on the study of risk ratios and profitability on investing in Amazon and other companies that have e-commerce services. We believe that using FCFF, CAPM, multiple linear regression, and value-at-risk models could offer a more comprehensive assessment of the investment value of Amazon. We study make expanding research on strategic hedging to improve investment strategy.
3.Value Analysis of Amazon
3.1.Brief Introduction to Amazon
Amazon, a global leader in e-commerce and cloud computing, has expanded its business model beyond online retail to include diverse services such as Amazon Web Services (AWS), digital streaming, and artificial intelligence. Amazon has a market capitalization of $1.95 trillion and a total TTM revenue of $590 billion as of July 2024, where e-commerce takes up 65% of its total revenue, and Amazon Web Service (AWS) in cloud computing accounts for 16% of the total revenue. The data is from Yahoo Finance.
3.2.Analysis Based on the FCFF Model
From the perspective of valuation, Amazon is undervalued. Using the FCFF model, which accounts for cash flows after capital expenditures and working capital needs, is crucial for assessing the intrinsic value of companies with stable cash flows [3]. Amazon’s zero-dividend policy and stable cash flow make FCFF an efficient valuation tool. The FCFF model is conducted by the following equation:
\( CV=\sum _{i=1}^{n}\frac{{FCFF_{i}}}{{(1+WACC)^{i}}}+\frac{{FCFF_{n+1}}}{(WACC-g){(1+WACC)^{n}}} \)(1)
\( P=\frac{V-Total Liabilities}{Shares outstanding} \)(2)
The FCFF method estimates future cash flows to firms (\( {FCFF_{i}} \)) and discounts them to present value using the Weighted Average Cost of Capital (\( WACC \)). P stands for the intrinsic value of a company’s share price,\( i \)stands for the\( {n^{th}} \)year of prediction, and\( g \)is a constant growth rate after\( {FCFF_{n+1}} \)(The\( FCFF \)after the terminal predicting year).
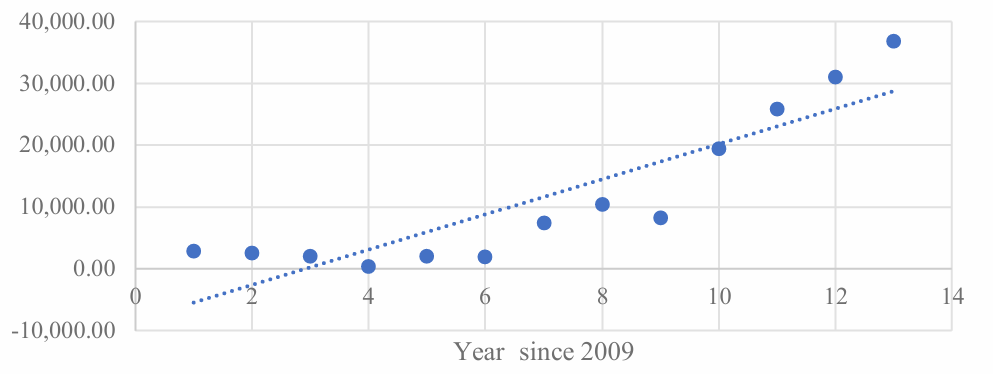
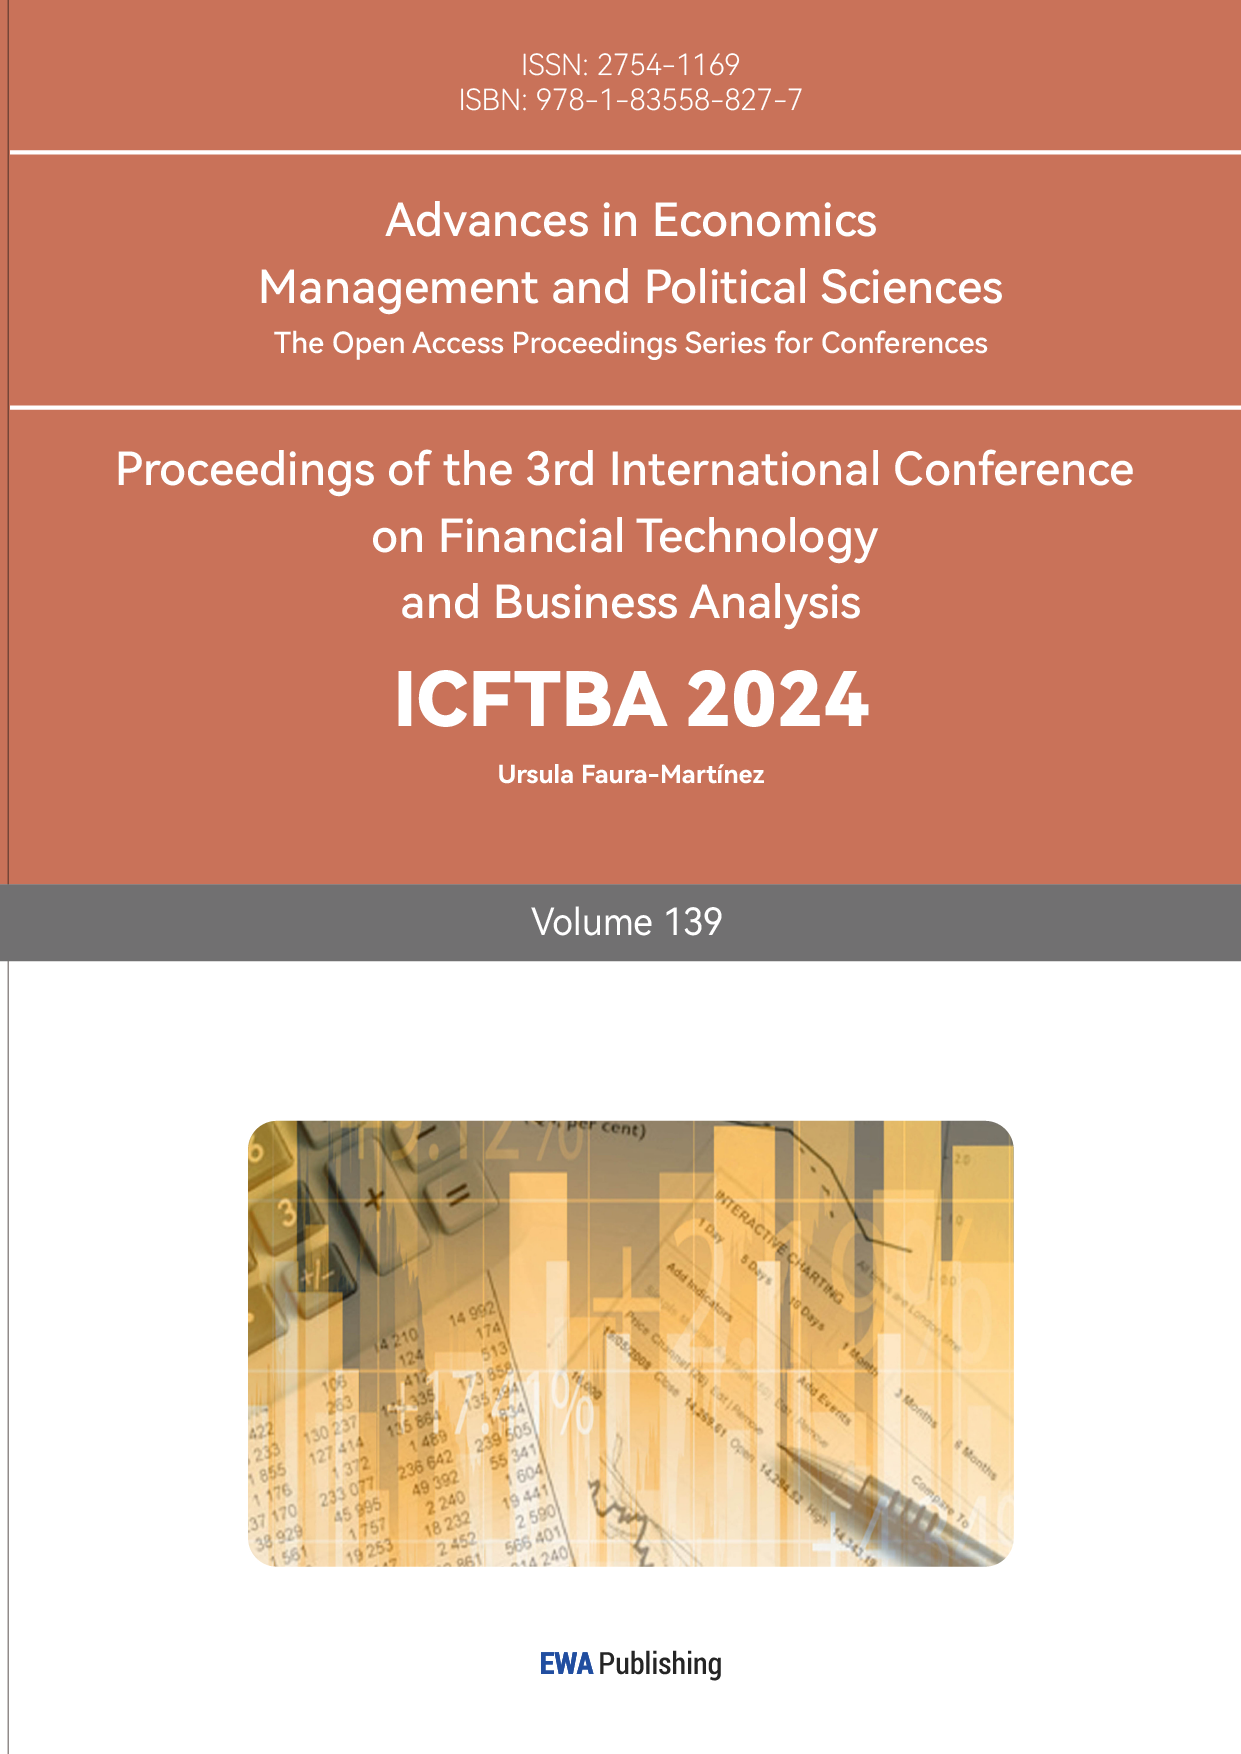
Figure 1: Linear Regression of FCCFF
\( \hat{{FCFF_{i}}}=2851.1t-8327.9\ \ \ (3) \)
It provided a reliable method to estimate the predicted FCFF values (\( \hat{{FCFF_{i}}}) \), having a\( {R^{2}} \)(coefficient of determination) of 0.7937. When discounting\( \hat{{FCFF_{i}}} \),\( WACC \)was assumed constant at 9.57% as for Amazon’s number on July 30, 2024 (Gurufocus).\( {FCFF_{i}} \), discounted\( {FCFF_{i}} \)and the annual growth rate\( g \)are summarized in table 1.
Table 1: FCFF Predicted Results
|
Year |
2024 |
2025 |
2026 |
2027 |
2028 |
2029 |
2030 |
2031 |
|
|
FCFF |
34438.6 |
37289.7 |
40140.8 |
42991.9 |
45843 |
48694.1 |
51545.2 |
54396.3 |
|
|
g |
/ |
0.0828 |
0.0765 |
0.0710 |
0.0663 |
0.0622 |
0.0586 |
0.0553 |
|
|
WACC |
0.0957 |
0.0957 |
0.0957 |
0.0957 |
0.0957 |
0.0957 |
0.0957 |
0.0957 |
|
|
Discounted FCFF |
31430.7 |
31060.3 |
30514.8 |
29827.7 |
29027.8 |
28140.1 |
27186.1 |
26184 |
|
Afterward, the model requires the calculation of the terminal value (the sum of all future discounted\( FCFF \)after 2030. In our assumption, the growth rate of\( g \)after the terminal year was calculated using the average value from 2024~2031 and\( g \)of 2025.
The above working steps lead to the result of\( V \)of $1136.391 billion and $2235.056 billion. Finally, the share price (\( P) \)is obtained using the formula with liabilities of $314.308 billion and total share outstanding of 10.670 billion based on Amazon’s 24 Q1 report, resulting in share prices estimated, ranging from $107 to $208, accounting for a possible 16% upside.
3.3.CAPM
In evaluating Amazon as a worthy investment based on relative valuation and a comparison of risks and returns using the Capital Asset Pricing Model (CAPM), a foundational concept in finance that describes the relationship between systematic risk\( {(β_{i}}) \)and expected return of individual stock (\( E(Ri) \)), helping investors assess the risk of individual securities within a diversified portfolio\( (E(Rm)) [4] \). By incorporating the risk-free rate\( {(R_{f}}) \), the expected market return, and the security's beta, CAPM can be applied to determine the appropriate required rate of return for an asset [5]. The standard form of a CAPM looks like this:
\( E(Ri)={R_{f}}+{β_{i}}(E(Rm)-{R_{f}}) \ \ \ (4) \)
In evaluating Amazon's expected returns using the Capital Asset Pricing Model (CAPM), a linear regression analysis was conducted between the market excess return (NASDAQ index, resource from the official website of NASDAQ) and Amazon's individual stock excess return over the last 252 trading days since 2023.7.27, yielding the beta coefficient. This method helps in estimating the stock's expected return based on its sensitivity to market movements, providing a measure of its systematic risk [4,6]. The regression results are shown in Table 2.
Table 2: CAPM Regression for\( {(β_{i}}) \)
|
Coefficients |
SD (σ) |
t Stat |
P-value |
Lower 95% |
Upper 95% |
Upper 95.0% |
|
|
Intercept X |
0.000658 |
0.000806 |
0.816861 |
0.414789 |
-0.000929 |
0.002245 |
-0.000929 |
|
Variable-β |
1.179742 |
0.078362 |
15.055077 |
7.352E-37 |
1.025406 |
1.334078 |
1.025406 |
The regression analysis for the NASDAQ index\( P(m) \)over the same period (starting from July 27, 2023) produced the following result illustrated in Figure 2.
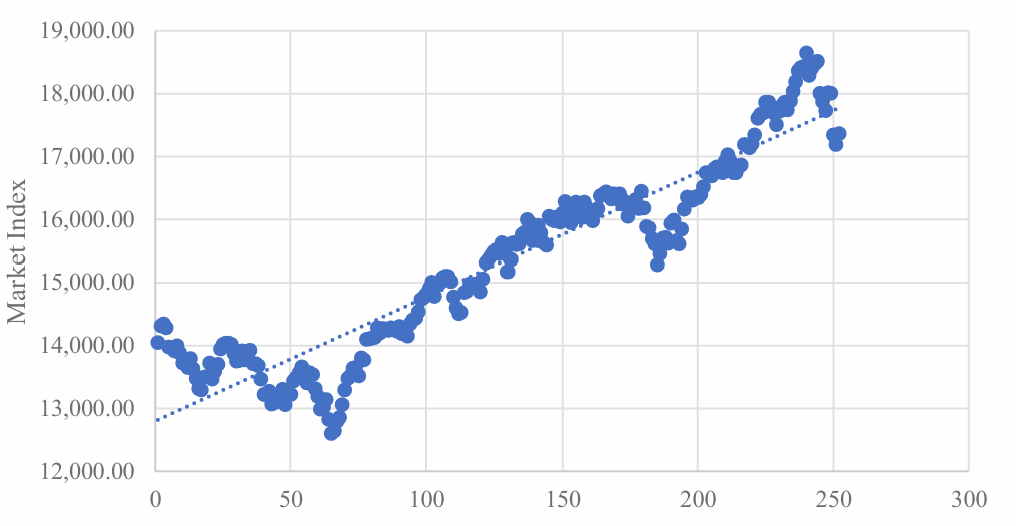
Figure 2: Linear Regression of Nasdaq Index
\( P(m)=19.725t+12800\ \ \ (5) \)
With an\( {R^{2}} \)of 0.8806, suggesting a strong linear relationship. The expected market return E(Rm) for different time periods was calculated using this regression model
\( \hat{{P_{m}}}=19.725×(252+t)=12800\ \ \ (6) \)
Assumptions for the CAPM model included:
1. The risk-free rate (\( {R_{f}} \)) is fixed at 4.818% based on the US 1-Year Treasury Rate.
2. No taxes or transaction costs are involved in buying or selling securities.
3. Investors have homogeneous expectations of returns, based on all available information.
4. Capital markets are efficiently in equilibrium, with all investments properly priced according to their risk levels, and no arbitrage opportunities exist.
5. The beta (\( {(β_{i}} \)) is stable over time.
6.\( E{(R_{M}})=\frac{\hat{{P_{m}}}-17357.88}{17357.88} \)and follows the linear regression function:
\( \hat{{P_{m}}}=19.725×(252+t)=12800\ \ \ (7) \)
Using the predicted market return from the NASDAQ regression, the expected return for Amazon's stock (\( E(Ri) \)) was calculated for various time periods, using the formula:
\( E(Ri)=0.0001320+1.1797(E(Rm)-0.0001320)\ \ \ (8) \)
The final results\( E(Ri) \)of are summarized below:
|
Time |
1 month |
3 months |
5 months |
1 year |
3 year |
|
NASDAQ |
18184.925 |
19013.375 |
19841.825 |
22741.4 |
27712.1 |
|
E(Rm) |
4.76% |
9.54% |
14.31% |
31.01% |
59.65% |
|
E(Ri) |
5.57% |
11.10% |
16.63% |
35.99% |
68.58% |
Using the same method, we calculated the beta of Amazon's competitive securities with respect to the market index. For Walmart and Target, we performed another autoregression of the S&P 500 index under the same assumptions and period, yielding the following equation, with a\( {R^{2}} \)of 0.8902:
\( \hat{P(m)}=5.3724×(t+252)+4190.2\ \ \ (9) \)
Figure 3: Graph: Linear Regression of SP 500 Index
By applying the predicted market excess return into the CAPM and using the standard deviation (𝜎) of daily excess returns (\( \hat{E(Ri)}) \)over the last 252 days, we derived the 2024 year-end excess return and risk for Amazon and its competitors based on data from July 27, 2023. Table 3 displays the results.
Table 3: CAPM predicted results of Amazon and its competitors
|
Security |
Beta (\( {β_{i}}) \) |
Return (\( E(Ri)) \) |
Risk (𝜎) |
ROR |
|
Amazon |
1.1797 |
0.1663 |
0.1796 |
0.9263 |
|
Ebay |
0.4061 |
0.0663 |
0.1585 |
0.4185 |
|
Alibaba |
0.6155 |
0.0934 |
0.2294 |
0.4072 |
|
Target |
0.5600 |
0.0727 |
0.2107 |
0.3450 |
|
Netflix |
0.9191 |
0.1326 |
0.2128 |
0.6233 |
|
Walmart |
0.2329 |
0.0383 |
0.4457 |
0.0860 |
|
|
1.0829 |
0.1538 |
0.1823 |
0.8440 |
|
QQQ |
0.6745 |
0.1010 |
0.1047 |
0.9645 |
|
SPY |
1.3137 |
0.1519 |
0.0751 |
2.0222 |
The return on risk analysis indicates that Amazon, with the highest return of 16.63% and a return on risk of 0.9263, is a strong investment target, offering a favorable trade-off between potential gains and associated risks. Although the analysis also shows the superiority of two index ETFs in return on risk, Amazon remains a compelling investment due to its substantial return.
4.Business Projections
4.1.July’s Event
This paper observed an intriguing trend in Amazon's stock price: the average stock price in July is consistently higher than in other months. Additionally, the maximum stock price in July often occurs between the 10th and 12th. Given this pattern, it is hypothesized that specific events in July might influence this behavior, prompting us to investigate the underlying causes. And this observation gives us a chance to do a speculative deal after 2025 Q2.
For this reason, a logistic regression model is used to analyze the relationship between time (independent variable T) and Prime membership sales in the US (dependent variable Y). Given that the value of Prime membership sales reflects the number of Amazon Prime subscribers, who are loyal customers of Amazon, this can be seen as a crucial metric for demonstrating the growth and expansion of its online retail market. To set up the model, two assumptions are established.
1.The rate of change in the value of Amazon Prime membership sales is proportional to its current value
As the value of Amazon Prime membership sales increases, more users are likely to trust Amazon's services and subscribe to Prime memberships. This growth in memberships will further drive sales at an accelerating rate.
\( ∴\frac{dY}{dT}={k_{1}}Y({k_{1 }}is a constant to be determined)\ \ \ (10) \)
2.Under the upper limit K, the change in the value of prime membership sales is proportional to the remaining quantity of membership sales (K-Y).
This is because when the value of membership sales increases, the value “to be increased” also decreases.
\( ∴\frac{dY}{dT}={k_{2}}(K-Y)({k_{2 }}is a constant to be determined)\ \ \ (11) \)
\( Hence,\frac{dY}{dT}={k_{2}}×k1×Y×(K-Y)=r×Y×(K-Y)\ \ \ (12) \)
(r is a constant to be determined)
It can be also written in a particular function:
\( Y=\frac{K{e^{KrT}}}{{e^{Krt}}+c} (c is a constant)\ \ \ (13) \)
The data listed are used for logistic regression, and the particular function is obtained with the help of Geogebra, presented in Table 4.
Table 4: Time& Value of Amazon’s membership sales in billion [6]
|
year since 2015 |
Y (in Billion $) |
|
9 |
12.9 |
|
8 |
12 |
|
7 |
11.2 |
|
6 |
10.4 |
|
5 |
7.16 |
|
4 |
4.19 |
|
3 |
2.41 |
|
2 |
1.52 |
|
1 |
0.9 |
When\( Y=\frac{K}{2} \), the value of\( r×Y×(K-Y) \)maximize. By using this model, this study finds the critical time period is around late August 2019, specifically August 23rd. This timing coincides with the initial breakout of COVID-19, leading to the closure of nearly 9,300 physical stores and widespread panic over insufficient goods supplies, which significantly boosted the demand for online shopping. Coupled with the seasonal increase in flu cases typically observed in October (according to the CDC), it is reasonable to predict a rise in membership sales in Q3 2025 (figure 4). This anticipated increase could significantly contribute to a rise in Amazon's stock price.
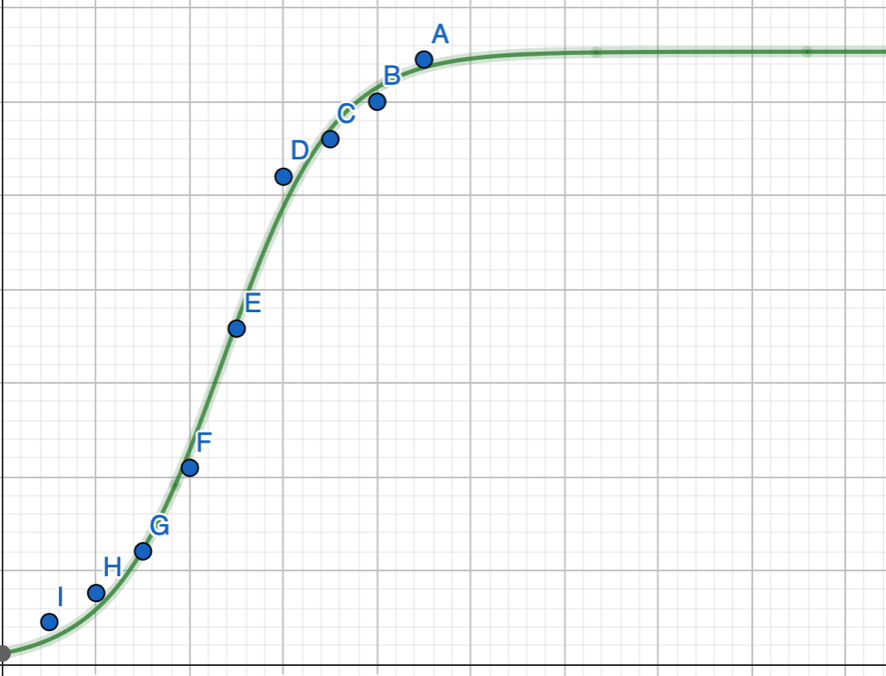
Figure 4: logistic fit line of the Time & Membership sale value
4.2.Predicted Share Price
A multiple linear regression model is employed to predict future changes in Amazon's stock price. This model calculates the relationship between Amazon's annual average stock price (dependent variable Y) and five independent variables: Gross Domestic Product (GDP) in the US, annual e-commerce sales value in the US, Amazon's annual revenue, Amazon's EBITDA, and Amazon's spending on lobbying (independent variables X1 through X5). The corresponding data from 2009 to 2023 are collected for regression, leading to the result:
\( Y=333.2953-{0.02287x_{1}}+5.343×{10^{-5}}{x_{2}}-2.689×{10^{-5}}{x_{3}}+0.00278{x_{4}}+8.06{x_{5}} \ \ \ (14) \)
A positive coefficient between the variables and the stock price means a rise in this figure will contribute to a rise in the stock price of Amazon, while a negative e coefficient between the variables and the stock price means a rise in this value will contribute to a fall in the stock price of Amazon. The value of the coefficient means the significance of the factor to the stock price. For example, the coefficient of\( { X_{2}}=5.343×{10^{-5}} \), which means that when the value of e-commerce sales in the US increase by 1 million$, the stock price of Amazon is supposed to rise by $\( 5.343×{10^{-5}} \)Among all the 5 variables, variable\( {X_{2}},{X_{3}},{X_{5}} \)are rejected due to their P-values are greater than 0.005. So only\( {X_{1 }} and {X_{4}} \)are kept, and the multiple linear regression function should be:
\( Y=-20.862223+0.00061711{X_{1}}+6.7307284{X_{4}}\ \ \ (15) \)
In 2025, the predictive value of X1 is 29256.38(billion $) (resource from the website of Statista) , $1079.78 billion higher than the predictive GDP of the US in 2024. And X4=109513.64 according to our own regression mode. Due to the fact that the coefficient of both variables is positive, the stock price of Amazon in 2025 is supposed to rise.
5.Risk Evaluations
When considering whether to invest in Amazon, we should weigh the associated risks carefully. The analysis involves evaluating crucial risk factors highlighted in Amazon's 10-K report and comparing the Value at Risk (VaR) among Amazon and its primary competitors.
5.1.Currency Risk
One of the major risks from the 10-K report includes exchange rate risk, which refers to potential losses from currency fluctuations in foreign trade [7]. Amazon's international division, which accounted for 22% of its total revenues in Q1 2024 [8], is particularly exposed to this risk. The correlative charges are transferred from U.S. Dollars to Euros, British Pounds, or Japanese Yen, as shown in Amazon's main overseas markets: Germany, the United Kingdom, and Japan [9]. With the euro, sterling, and yen expected to weaken against the US dollar [10] the appreciation of the US dollar may mitigate some of Amazon's foreign exchange risks in the coming months.
5.2.Value at Risk
Furthermore, the Value at Risk (VaR) metric provides a statistical estimate of potential financial losses within a portfolio over a specific period at a given significance level [11]. The formula for VaR is stated as:
\( VaR(α)=-({μ_{\frac{p}{l}}}-{z_{α}}×{σ_{\frac{p}{l}}})\ \ \ (16) \)
Where\( {μ_{p/l}} \)is the average mean of profit or loss (average daily stock return\( { R_{i}} \)),\( {z_{α}} \)stands for z statistic calculated given the significance level\( α \)(5%);\( {σ_{p/l}} \)represents the standard deviation of profit or loss (sampled daily stock return\( {R_{i}} \)).
Using historical stock price data from July 21, 2023, to July 22, 2024, the VaR for Amazon and its competitors, including eBay, Walmart, Alibaba, Target, Netflix, and Alphabet, was calculated. Amazon's VaR was found to be -2.71%, which is the second lowest among the companies analyzed, as shown in Table 5.
Table 5: Value at Risk of Amazon and its main competitors
|
Stock name |
Value at Risk % |
|
Amazon |
-2.71 |
|
eBay |
-2.55 |
|
Walmart |
-3.02 |
|
Alibaba |
-3.67 |
|
Target |
-3.33 |
|
Netflix |
-3.26 |
|
Alphabet |
-2.80 |
5.3.Hedging Strategies
To hedge our long position on Amazon, we could long a corresponding simple American put option, using the binomial model, and we could set the VaR amount as a basis for stop-loss and the determination of exercise price for hedging choices like put options (2.71% or above add up to the cost of stock) based on Amazon’s historical performances. To develop a logical static hedging strategy, we need to consider the Delta value (hedge ratio) which indicates the option's price sensitivity relative to small changes in the stock price.
In this analysis, we calculate the Delta for an American put option on Amazon with the following parameters: a stock price of $180.82, an exercise price of $185.73 (\( K) \), a time to maturity of 105 trading days, an annual risk-free rate of 4.818%, a volatility of 6.2189, and one binomial step.
First, we convert the given parameters: the annual risk-free rate of 4.818% to a daily rate and the time to maturity from trading days to years, resulting in approximately 0.4167 years. The up factor (\( u \)) and down factor (\( d \)) are computed as follows:
\( u={e^{σ\sqrt[]{\frac{t}{n}}}}\ \ \ (17) \)
\( d={e^{-σ\sqrt[]{\frac{t}{n}}}}\ \ \ (18) \)
Given the volatility (\( σ \)) of 6.2189 (standard deviation of Amazon’s daily return on stock price over the last 252 days) and the time step (\( \frac{t}{n} \)) of approximately 0.1389 years (one-third of the total time to maturity), the up factor is 10.078 and the down factor is approximately 0.09923. The probability (\( p \)) of an upward movement is calculated using:
\( p=\frac{{e^{\frac{rt}{n}}}-d}{u-d}\ \ \ (19) \)
This yields a probability of approximately 0.0902. The stock price tree is constructed over three steps. At each node, the stock price is multiplied by the up factor or the down factor, creating two nodes of possible future stock prices:\( Sd \)and\( Su \)(1822.22 and 1.78)
The next step involves using backward induction to determine the option's value (\( {f_{u}} and {f_{d}}) \)at two preceding nodes, using the formula:
\( {f_{u}} =max{({K-S_{0}}×u,0)}\ \ \ (20) \)
\( {f_{d}} =max{({K-S_{0}}×d,0)}\ \ \ (21) \)
Lastly, we could derive Delta using the formula:
\( ∆ =\frac{fd-fu}{Sd-Su}\ \ \ (22) \)
And this will lead us to a delta result of -0.041621 (24 option contracts for every 100 shares).
6.Conclusion
The comprehensive analysis of this paper reveals Amazon’s investment potential through the application of valuation models, risk assessment, and hedging strategies. The results, derived from the Free Cash Flow to the Firm (FCFF), Capital Asset Pricing Model (CAPM), and multi-linear regression analysis, indicate that Amazon possesses significant growth potential. The valuation model suggests an end-of-year price prediction at about $208, which provides a long opportunity on Amazon for a period of 4 to 6 months. For meticulous investors, continuous monitoring of Amazon’s Q3 and Q4 earnings reports is essential to ensure that performance remains consistent with the projections established in the analysis.
The logistic model and multi-linear regression model indicates a high momentum of Amazon’s stock prices in July. Therefore, looking ahead to 2025, a market-timing strategy appears viable, particularly in Q3, as the analysis projects a rise in Amazon’s stock price during this period. Adjusting positions in response to market trends during this timeframe would maximize returns and align with the anticipated price movements.
To mitigate the risks associated with market volatility, the analysis incorporates a hedging strategy through the acquisition of put options with a strike price above $186. The use of 24 put contracts for every 100 shares effectively provides a safeguard against unexpected market downturns.
In conclusion our analysis applies rigorous financial principles and quantitative methods, However, the unpredictability of the market and the economy is paramount. Hence, continuous reassessment of market conditions and developing adaptative strategies is critical to addressing these limitations, while the hedging strategy would eliminate certain subjective and uncertain downside risks, thereby enhancing its effectiveness over time.
Regarding the limitations of this analysis and the model we applied, the 4 to 6-month holding period is justified by the inherent in the valuation model. The FCFF model's reliance on historical annual accounting data, and the CAPM’s assumption of a stable beta, restrict the forecast to a finite time frame. Moreover, the macroeconomic variables used in the multi-linear regression model, such as GDP, may deviate from predicted values due to unforeseen economic fluctuations. As a result, the strategy is best implemented up to the end of 2024, after which reassessment is necessary to account for potential deviations and random errors.
Authors Contribution
All the authors contributed equally and their names were listed in alphabetical order.
References
[1]. Ge, Y. & Wu, H. (2020). Prediction of corn price fluctuation based on multiple linear regression analysis model under big data. Neural Computing and Applications, 32, 16843–16855.
[2]. Hendricks, D. (1996). Evaluation of value-at-risk models using historical data. Economic Policy Review, 2(1), 1-20.
[3]. Damodaran, A. (2006). Damodaran on valuation: Security analysis for investment and corporate finance (2nd ed.). John Wiley & Sons.
[4]. Sharpe, W. F. (1964). Capital asset prices: A theory of market equilibrium under conditions of risk. The Journal of Finance, 19(3), 425-442.
[5]. Lintner, J. (1965). The Valuation of Risk Assets and the Selection of Risky Investments in Stock Portfolios and Capital Budgets. The Review of Economics and Statistics, 47(1), 13–37.
[6]. Fama, E. F., & French, K. R. (2004). The capital asset pricing model: Theory and evidence. Journal of Economic Perspectives, 18(3), 25-46.
[7]. Ganti, A. (2020). Foreign Exchange Risk Definition. Investopedia. Retrieved from: https://www.investopedia.com.
[8]. U.S. Securities and Exchange Commission (SEC) EDGAR filings. Retrieved from: https://www.sec.gov/edgar.
[9]. Coppola, D. (2023). Amazon top markets net sales 2018. Statista. Retrieved from: https://www.statista.com.
[10]. Teng, T. (2024). Why might the euro continue to weaken against the US dollar? Euronews. Retrieved from: https://www.euronews.com.
[11]. Kenton, W. (2023). Value at Risk (VaR) Explained. Investopedia. Retrieved from: https://www.investopedia.com.
Cite this article
Jin,S.;Qi,C.;Xie,H. (2024). Investment Analysis of Amazon: Valuation, Regression Models, Risk Assessment, and Strategic Hedging. Advances in Economics, Management and Political Sciences,139,224-234.
Data availability
The datasets used and/or analyzed during the current study will be available from the authors upon reasonable request.
Disclaimer/Publisher's Note
The statements, opinions and data contained in all publications are solely those of the individual author(s) and contributor(s) and not of EWA Publishing and/or the editor(s). EWA Publishing and/or the editor(s) disclaim responsibility for any injury to people or property resulting from any ideas, methods, instructions or products referred to in the content.
About volume
Volume title: Proceedings of the 3rd International Conference on Financial Technology and Business Analysis
© 2024 by the author(s). Licensee EWA Publishing, Oxford, UK. This article is an open access article distributed under the terms and
conditions of the Creative Commons Attribution (CC BY) license. Authors who
publish this series agree to the following terms:
1. Authors retain copyright and grant the series right of first publication with the work simultaneously licensed under a Creative Commons
Attribution License that allows others to share the work with an acknowledgment of the work's authorship and initial publication in this
series.
2. Authors are able to enter into separate, additional contractual arrangements for the non-exclusive distribution of the series's published
version of the work (e.g., post it to an institutional repository or publish it in a book), with an acknowledgment of its initial
publication in this series.
3. Authors are permitted and encouraged to post their work online (e.g., in institutional repositories or on their website) prior to and
during the submission process, as it can lead to productive exchanges, as well as earlier and greater citation of published work (See
Open access policy for details).
References
[1]. Ge, Y. & Wu, H. (2020). Prediction of corn price fluctuation based on multiple linear regression analysis model under big data. Neural Computing and Applications, 32, 16843–16855.
[2]. Hendricks, D. (1996). Evaluation of value-at-risk models using historical data. Economic Policy Review, 2(1), 1-20.
[3]. Damodaran, A. (2006). Damodaran on valuation: Security analysis for investment and corporate finance (2nd ed.). John Wiley & Sons.
[4]. Sharpe, W. F. (1964). Capital asset prices: A theory of market equilibrium under conditions of risk. The Journal of Finance, 19(3), 425-442.
[5]. Lintner, J. (1965). The Valuation of Risk Assets and the Selection of Risky Investments in Stock Portfolios and Capital Budgets. The Review of Economics and Statistics, 47(1), 13–37.
[6]. Fama, E. F., & French, K. R. (2004). The capital asset pricing model: Theory and evidence. Journal of Economic Perspectives, 18(3), 25-46.
[7]. Ganti, A. (2020). Foreign Exchange Risk Definition. Investopedia. Retrieved from: https://www.investopedia.com.
[8]. U.S. Securities and Exchange Commission (SEC) EDGAR filings. Retrieved from: https://www.sec.gov/edgar.
[9]. Coppola, D. (2023). Amazon top markets net sales 2018. Statista. Retrieved from: https://www.statista.com.
[10]. Teng, T. (2024). Why might the euro continue to weaken against the US dollar? Euronews. Retrieved from: https://www.euronews.com.
[11]. Kenton, W. (2023). Value at Risk (VaR) Explained. Investopedia. Retrieved from: https://www.investopedia.com.