


1. Introduction
The rapid development of new energy vehicles in recent years has changed the landscape of the global automobile industry. There will be an estimated 14 million newly registered EVs, which adds up to 40 million in total and takes up 18% of annual sales of all automobiles [1]. The EV industry proliferated, and the aggregate sales revenue had a more than 30% increase on year and was six times larger than it was five years ago. In the competition of the new energy automobile industry, Tesla, as a pioneer and leader, has been at the top of the industry. Tesla's stock has grown rapidly over the past few years, and peak in 2021. Since then, Tesla's stock price does not appear to have fluctuated significantly after the two equity splits. Recently, with the policy changes within the company such as price cuts, the company's stock has experienced fluctuations. However, Tesla remains a robust competitor in the industry despite this minor setback. [2] As a well-established company, Tesla’s stock performance attracts countless investors in the global market. Therefore, understanding the volatility of Tesla's stock and the factors that drive this is a valuable research topic to study. In this study, this research uses time series methods like fundamental and technical analysis to identify and quantify the factors affecting the volatility of Tesla's stock price to help readers understand the major factors that drive the volatility of Tesla's stock price globally, especially within its major markets and the role that they have played in the past five years.
2. Literature review
2.1. Introduction
Technical and fundamental analysis is applied to cope with the concerns over the uncertainty of market return due to complex market factors and nonlinear variables. It usually involves the implementation of graphing tools and calculations of the past historical data of stock while fundamental analysis is based on the evaluation of a firm’s financial status and the computation and comparison of its values with the market indices [3].
2.2. Technique analysis
Technique analysis is a trading method that identifies the trading decision by predicting future price movement [4]. It can be analyzed using various matrices.
Kline analysis
Kline, known as a candlestick figure, is a technique applied to demonstrate the change in the price of a company in each period. Each candlestick represents four key information, the opening and closing price, the highest and lowest price. Different patterns of candlesticks provide different information on market trends [5].
MACD analysis
MACD (Moving Average Convergent /divergent) is a technique developed in the 1970s, it derives from the EMA. The standard MACD is computed by the EMA of 26 days subtracted from the 12-day EMA [6].
RSI analysis
Relative Strength Index (RSI) is also a key term in technique analysis. The RSI model concerns the differences between the aggregated capital gain and loss, and typically, the magnitude of RSI is positively correlated to the stock price, and it yields greater profits eventually [7].
2.3. Fundamental analysis
2.3.1. Financial analysis
Financial analysis measures the financial status and health of a company, it can be categorized into profitability analysis and debt service capacity, etc. It gives us an insight into a company’s profitability, liquidity, and effectiveness.
Profitability analysis
This study measures the profitability analysis by its return on equity (ROE) and return on assets (ROA), then compares the differences between these indices with the industry or market value respectively. ROE is calculated by net income divided by average shareholders’ equity, it measures a company’s profitability about the shareholders’ equity, which indicates how effectively the firm utilizes the investing money from the shareholders to generate profits [8].
Debt service capacity analysis
The ability to repay the debt is evaluated through indices and matrices like debt capacity, EBITDA, and ICR (interest coverage ratio). Debt capacity standard for the maximum amount of debt a company can withhold while maintaining a healthy financial status. It involves the computation of a firm’s net income, credit score, existing debt, expenses, assets DTI (Debt-to-income ratio), etc. EBITDA stands for Earnings before interest, taxes, depreciation, and amortization. According to EBITDA (Corporate Finance Institute, n.d.), it is an index applied to rate the overall operating performance of a firm.
Cash flow analysis
The cash flow analysis is an analysis of the cash inflows and expenditures of a company, it is essential in understanding the financial health of a firm. Researchers can implement cash flow statements to examine the firm's liquidity [9].
2.3.2. Valuation analysis
P-E ratio
The price-earnings ratio is an important measurement in valuation analysis. The p-E ratio reflects the per-dollar stock profits that investors are willing to spend. The P/E ratio calculates the current market value of a company's shares about its earnings, and it is used to compare different firms' performance. [10]. Generally, a stock with a higher P/E ratio is more appealing to investors who expect the stock price to grow, while those who expect to spend less on units of earning are more likely to invest in stocks with a low P/E ratio, hence are less optimistic about the company’s future growth.
P-B ratio
It’s another valuation metric that determines the market capitalization to the book value of a company, it tells us how much an investor is willing to pay for the unit dollar net assets of a company. When the P-B value is smaller than 1 means the market value of a firm is lower than the book value, conversely, if the P-B value is greater than 1, it symbolizes the market value of the firm is higher.
2.4. Summary
This literature review explores the role and significance of technical and fundamental analysis in the study of stock price volatility. Technical analysis methods such as MA, MACD, and RSI help investors identify buy and sell signals through historical price data and market patterns. These tools provide useful information for short-term trading. While Fundamental analysis focuses on evaluating a company's financial health and intrinsic value, including financial ratios such as ROE, ROA, and EBITDA, as well as valuation metrics like P/E and P/B. These analyses help to understand a company's long-term investment value.
3. Methodology
3.1. Research design
Time series analysis is a common method for studying stock volatility, it is observation for a given string of data or phenomena in a consecutive period point [11]. This research paper will analyze and study Tesla's stock for the last five years using a quantitative research methodology with both technical and fundamental analysis. This study will analyze the volatility of Tesla's stock, speculate on the causes of the stock price fluctuations, and give investors relevant investment advice.
3.2. Data collection
Researchers should rely on more than one index and matrices to predict the market performance of the target company. These measurements include the reference to fiscal reports and the visualization of historical data [12]. To assess the historical volatility of Tesla’s stock price, this study will use different sources of data and information, such as online databases, fiscal reports, and industrial reports, covering the historical data of Tesla stock from the past five years. Because the data is large enough to include various fluctuations of the stock market like bull market bear market and volatile market, hence gives more diversified historical data. This study will also use the data gathered by Tesla to compare it with the market average, hence evaluating the company's competitiveness.
3.3. Data analysis
As discussed in the literature review, this research paper will utilize a time series method to conduct technical and fundamental analysis of Tesla’s past stock price data.
In terms of technique analysis, this research paper will dive deep into the computation of the three matrices. To begin with, K line analysis gives an overview of the price movement of Tesla in a specific time slot. In practice, when the closing price is higher than the opening, it indicates bullish sentiment, where candlesticks are in green color. Conversely, if the closing price is lower, it represents bearish sentiments, and candlesticks are in red [5]. Consider moving averages, MACD can be measured through two exponential moving averages of the assets’ price: a faster 12-period EMA and a slower 26-period EMA. According to Pines, L, the 9-period EMA is called the signal line and the MACD histogram measures the differences between MACD and the signal line [13]. When the 12-day EMA is above the 26-day EMA, the MACD line will be higher than the zero line, conversely, if it crosses below the EMA of the 26 days, the MACD line intercepts beneath the zero line. RSI is a strong indicator that can determine the magnitude of the price change so it can predict if the price of a stock is in a condition of either overbought or oversold. RSI is composed of Relative Strength, Average Gain, and Average Loss, where the quantitative expressions are RSI=100-100/(1+RS) where RS=AG/AL [7].
Fundamental analysis comprised of financial analysis and valuation analysis. The subcategories of financial analysis are profitability, debt service capacity, and cash flow analysis.
To evaluate the profitability of Tesla, this study will search for the ROE and ROA through the fiscal report of Tesla over the past five years and compare these indices with the market or industry average. Normally, a higher ROE indicates higher efficiency in profit generation [14]. Similarly, ROA measures the ability of a company to generate profit concerning its assets, which equals net income/ total assets. For the debt services capacity, this study will refer to Tesla’s EBITDA and ICR over the years on its fiscal report 2019-2024. EBITDA provides a general picture of the operating profitability of the company in the absence of taxation and non-cash expenses, while ICR measures Tesla’s ability to meet its interests’ obligations with its earnings. Finally, this research paper includes cash flow analysis as it can help us understand the firm’s financial health and liquidity as well as the ability to maintain its growth. A common approach for measuring the cash flow is the quick ratio, which measures the liquidity of a company and is calculated by current asset-inventory/current liabilities.
For valuation analysis. This study is concerned with two matrices, the PE ratio, and the ratio. PE ratio =Current share price/Earnings per share (EPS). It tells us the relative valuation of the company with others from the same industry, the growth potential for the firm and it also reflects the market sentiment of Tesla towards any other companies from the same industry.
The PB ratio is calculated by market price per share/ book value per share. It reflects the investors’ sentiment which is usually used to measure the confidence of the investors. Generally, a higher PB ratio suggests higher confidence of the investors.
3.4. Validity and reliability
To ensure the validity of this research, this research has references to different firsthand and secondhand sources of data, including online sources, Tesla’s fiscal report, the reliable third-party databases. Our research is based on two systematic time series methods of fundamental and technical analysis. These two methods involve different matrices and indices like MA, ROE, EBITDA, and P/E ratio, which ensures versatility and accuracy of analytical results. Our data will be presented with different visualizations including MA curves, tables, line figures, and histographies. Most of the analyzed data will be compared with the market or industrial average to make sure they are appropriately collected, categorized, and presented.
3.5. Limitation
Since this study only relies on time series methods to analyze Tesla’s historical stock price, the research design may have the following limitations. One noticeable limitation is that the study neglected the macro-economic factors. Since technical and fundamental analysis mainly focuses on the company’s financial status and market behaviors, this paper won’t analyze the impact of some macroeconomic factors, such as changes in interest rates, economic cycles, and policy shifts on the volatility of Tesla's stock price. Another potential flaw in our design is that time series research fails to catch up with the impacts of the breaking events of Tesla. As an emerging energy car manufacturer, Tesla faces many challenges and competition from the same industry such as fierce competition as it enters the Chinese market, and the competitors generally take up its places by applying various strategies [15]. These indicate that factors such as technological breakthroughs, corporate restructuring, stock splits, and management changes could have a significant impact on the company's share price volatility in the near term.
Finally, technical analysis relies too much on historical data, which may not reflect the company's future development and stock price change. The new energy vehicles industry is at the forefront of ever-changing rapid development and change.
4. Results
4.1. Technical analysis
Kline analysis:
According to the candle figure from Figure 1, Tesla’s stock has exhibited an upward trend from 2020 to 2021 and reached a peak on Monday, November 1st, 2021, symbolizing bullish engulfing. Then it experienced fluctuation in the following three years and remained stable after all.
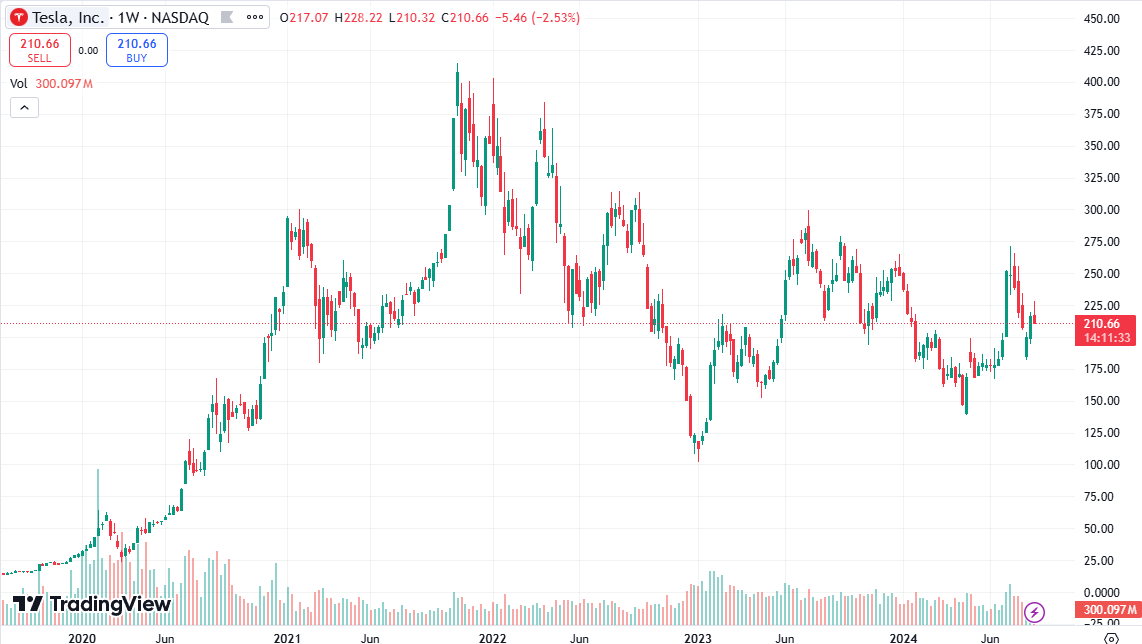
Figure 1: Candlestick figure of Tesla from 2019-2024 (Trading View)
Let’s choose the nearest month (August 2024) as an example to do a monthly K-line analysis. As displayed in Figure 2, the opening price was 219.80 USD, and the closing price was around 220.32 USD, the highest price reached 232.10 while the lowest price was 191.76 (Google Finance. n.d.) At the beginning of August, the figure displays a clear bearish engulfing pattern, which signals the reverse from an upward trend to a downward one. It also shows several Doji patterns, meaning market indecision and potential reversal. It's also worth noting Hammer appears several times at both the beginning of the month and the mid of August, which can indicate that interest buying at the low level is strong. At the end of August, the stock prices generally climb up and reach a price level like the opening price.
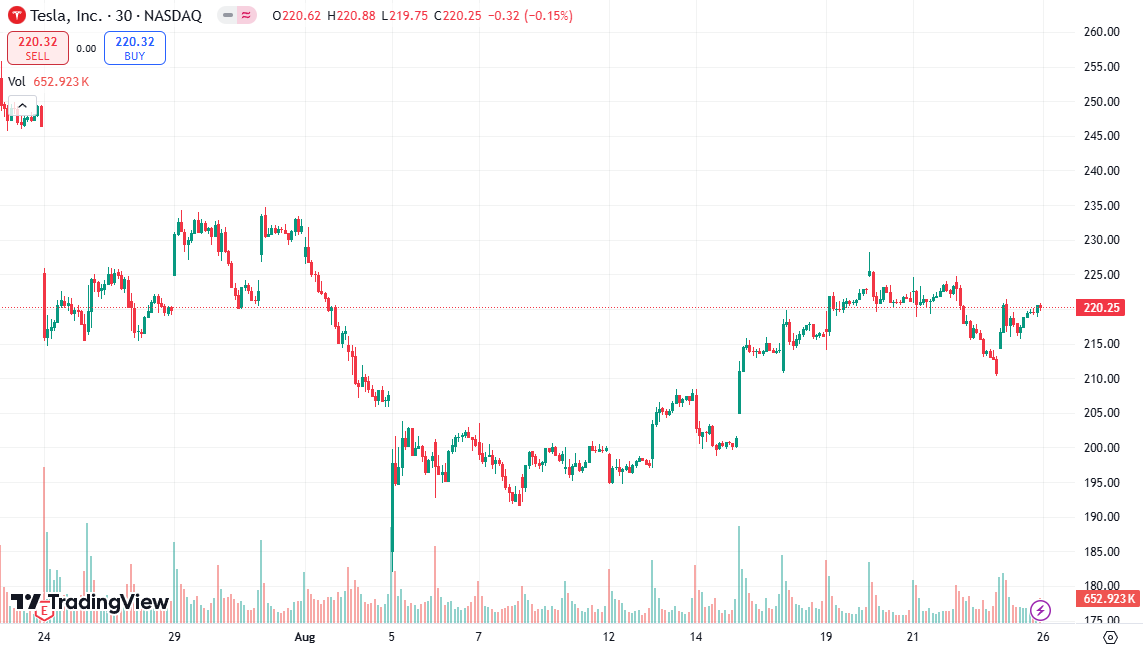
Figure 2: Trending View of the candlestick figure of Tesla in one month (Trading View).
MACD:
Both Tesla’s EMA5(220.30) and EMA20(220.32) are greater than or equal to the share price (220.32) while both EMA100(219.94) and EMA200(219,37) are smaller than the share price, signaling buy instead. The MACD (12,26) is 0.03 indicating EMA12-EMA26 is 0.03 higher than EMA9 (Tip ranks), suggesting the stock price will continue to rise in the future.
RSI:
Till August 2024, Tesla has an RSI (14) =50.20, which is between the interval 30-70, indicating a neutral market sentiment (Tip ranks).
4.2. Fundamental analysis
4.2.1. Financial analysis
Profitability analysis
ROE is calculated by net income/ shareholder’s equity. Figure 3 shows that Tesla’s ROE has increased sharply for the past five years from -11.55% to 19.89% in the second quarter of 2024. The Lowest ROE occurred in Q3 2019 while the peak was in Q4 2022. According to Figure 3, Tesla’s ROE increased drastically and plummeted before it remained steady after Q4 2022. Generally, it remains a high profile and stable trending, indicating Tesla’s high efficiency and strong ability to utilize its equity to generate profits (Macrotrends).
Figure 3: Tesla Return on Equity 2019-2024 (Macrotrends).
Figure 4: Tesla’s Return on Assets (Macrotrends).
As illustrated in Figure 4, Tesla’s ROA has a similar pattern to the ROA, it started with -2.24% in Q2 2019 and ended with 11.76% in Q2 2024. The highest ROA was 17.28 in Q4 2022, and the lowest ROA was -2.71% in Q,32019. The ROA has experienced promising growth between 2019 and 2022. Despite minor fluctuations after 2022, Tesla’s ROA can remain at a high level above 0, indicating its success in generating earnings from its assets (Macrotrends).
Debt service capacity:
Table 1: Tesla Annual EBITDA (Millions of USD) (Macrotrends)
Year | Millions of USD |
2023 | $13,558 |
2022 | $17,403 |
2021 | $9,434 |
2020 | $4,316 |
2019 | $2,085 |
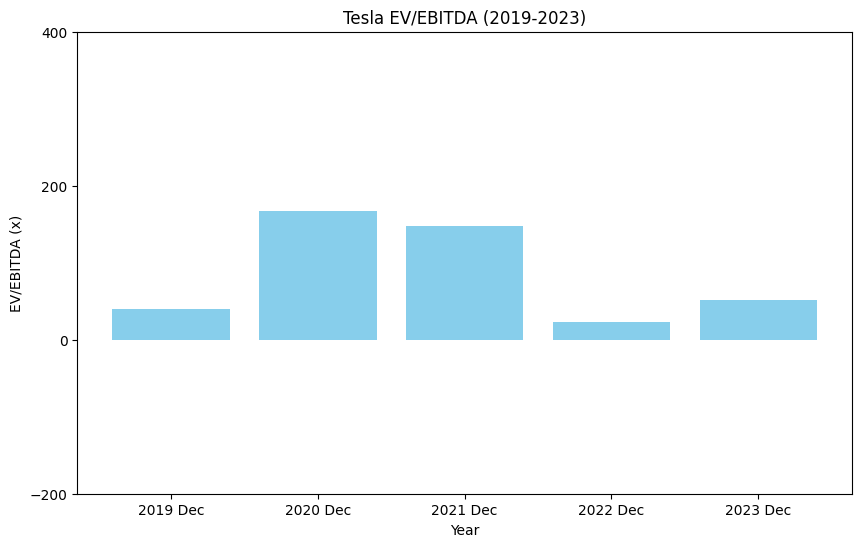
Figure 5: Tesla’s Enterprise Value (EV, in billions of USD) (Fin Box)
According to Table 1, In the past five years, Tesla has experienced robust growth for 4 consecutive years from 2019-2022, then it fell back by 22.09% in 2023, but still higher than the previous three years. According to Figure 5, the EBITDA multiples from the end of 2019 to 2024 are 41.31, 155.46,112.2, 21.54, and 57.01 respectively (Fin Box).
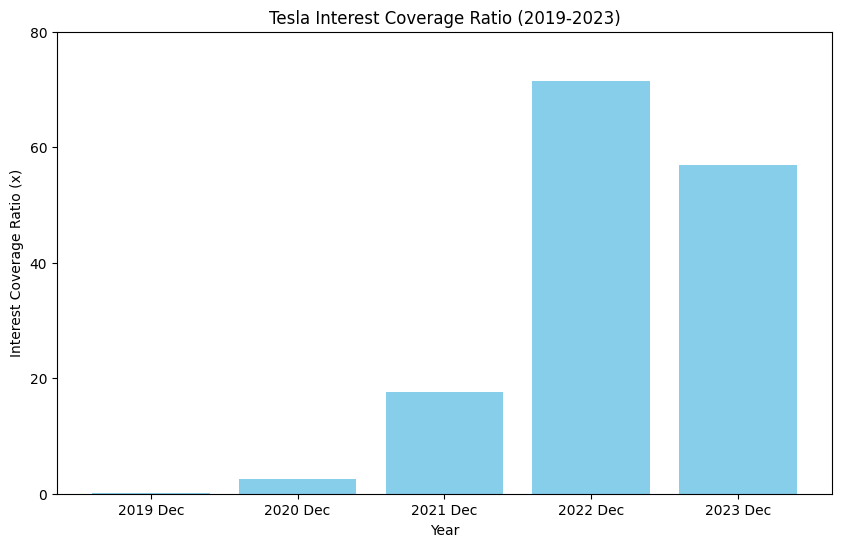
Figure 6: Tesla’s Interest Coverage Ratio (Fin Box).
For ICR, as displayed in Figure 6, the average interest coverage ratio from the end of 2019-2023 is 29.8x. During the past 5 years, the highest ICR was 71.5x at the end of 2022, while the lowest ICR in the past five years was 0.1x at the end of 2019. The highest ICR growth happened at the end of 2020, followed by a +2263.8% increase. According to the latest data, the nearest 12-month ICR of Tesla is 27.5x (Fin Box).
Cash flow analysis:
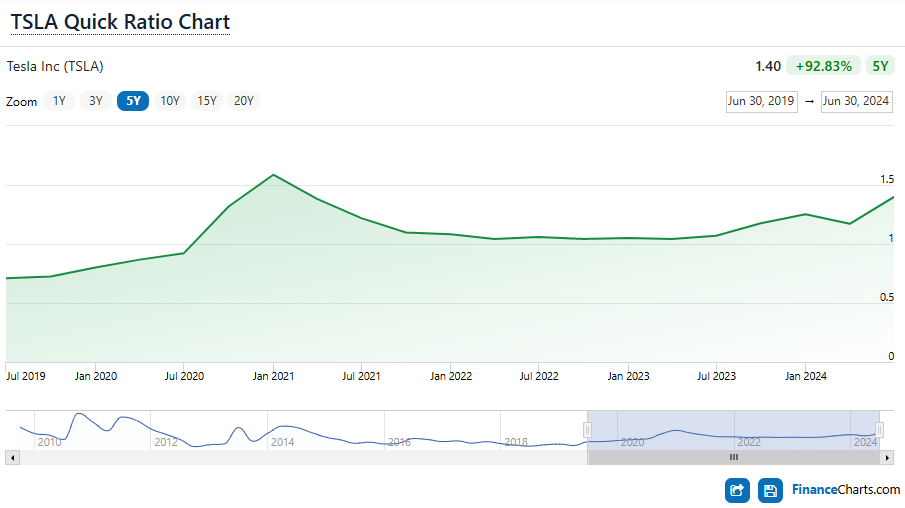
Figure 7: Tesla’s Quick Ratio from Jul 2019-2024(Finance Charts).
As demonstrated by Figure 7, over the past five years, Tesla’s quick ratio has had minor fluctuations and mostly remained above 1. The highest QR was 1.59 in January 2021, while the lowest was 0.71 in January 2019. As for Q2 2024, Tesla's Quick ratio is 1.40 (Finance Charts).
4.2.2. Evaluation analysis
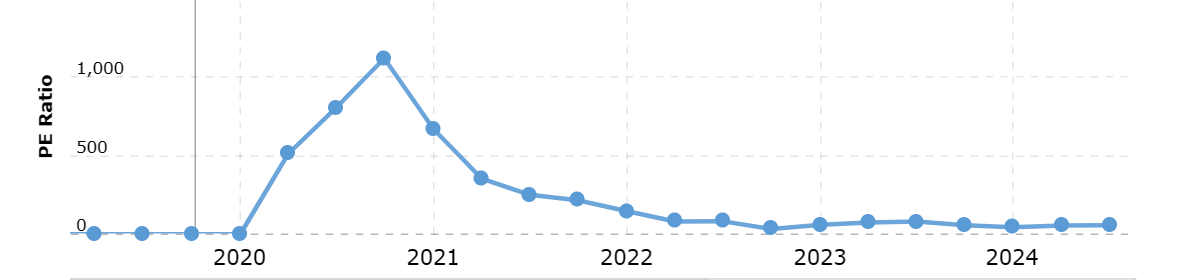
Figure 8: PE ratio of Tesla from 2019-2024 (Macrotrends)
PE ratio:
According to Figure 8, Tesla has a P/E ratio of 57.96 till August 28, 2024, for the past five years, Tesla s P/E ratio has displayed a trend of great ups and downs. Before 2020, the P/E ratio of the company had negative EPS, so their calculated P/E ratio was 0. After 2020, TSLA experienced rapid growth in the short term and achieved 1120.11x at the end of 2020. Then, the P/E ratio falls back in the following two years and the trend becomes stable after all (Macrotrends).
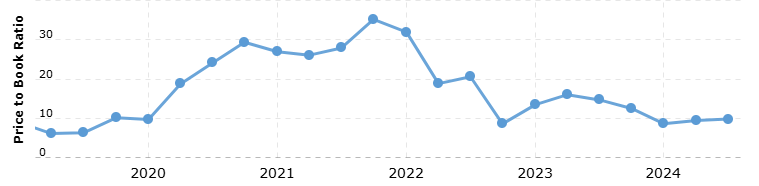
Figure 9: Tesla’s PB ratio from 2019-2024 (Macrotrends).
P/B Ratio:
As shown in Figure 9, Tesla's PB ratio has had a more zigzag evolution. The high point was 35.21 at the end of 2021, while the low point was 6.09 in the first half of 2019. As of the end of August 2024, the P/B ratio was 9.78. Generically, Tesla has a relatively higher P/B ratio throughout the period (Macrotrends).
5. Discussion
5.1. Technical analysis
k-line analysis
Based on our Technical analysis of the pattern of the long-term and short-term K-line of Tesla, this study finds that over the past half-decade, Tesla’s stock has displayed remarkable growth which encompassed significant fluctuations and rapid appreciation, especially from 2020-2021. Nonetheless, it also witnessed a noticeable decline since then. It can recover and remain stable eventually. Till August 2024, Tesla’s stock price also exhibits considerable volatility but closed at a similar level to the opening price, which matches the long-term K-line performance of the company. Therefore, it reflects the market indecision and the strong buying interests at a low level.
MACD & RSI
In terms of MACD, the 12-day EMA is slightly higher than the 26-day EMA by 0.03 (CSI market). The figure is positive suggesting the sign of bullish, signalling the stock price will continue to grow soon. However, the magnitude of MACD is too small suggesting the momentum is not strong. For RSI, since the value reflects a neutral market sentiment, it suggests that there’s no strong buying or selling pressure.
5.2. Fundamental analysis
5.2.1. Profitability analysis
ROE and ROA
For the fundamental analysis, this study will compare the relative matrices with the market average. For the EV industry, the market average ROE and ROA are 12.49% and 3.65% respectively. Tesla has relatively higher ROE (19.89%) and ROA (11.76%) in the recent year (CSI market). Higher ROE showcases Tesla is significantly more effective at generating profits from its shareholders’ equity, suggesting the company has high management efficiency and the ability to be profitable. Besides, Tesla has a much higher ROA than the market level, indicating that the firm can effectively utilize its assets and operate efficiently. These criteria make the company more attractive to investors compared with its competitors from the same industry.
Debt service capacity
For EBITDA multiple, the industry average of Auto parts is 9.15 in the recent year and has a 10.11 5-year average (Full Ratio). From the past data, the EBITDA multiple of Tesla is much higher than the market average, reflecting its strong competitiveness and potential for growth. Over the years, Tesla has maintained its EBITDA at a considerably high level, despite its decline in 2023, its EBITDA multiple is still much higher than the market average in the same period, indicating its resilience and competitiveness.
Liquidity
In 2023, ICR for all industries was 2.51x and the auto industry average ranged from 2-10x, Tesla’s interest coverage ratio has greatly improved in the past few years. Despite 2019 and 2020, it has far higher ICR compared with the whole market and the industry average (Ready Ratios). It indicates that the company has gained financial stability and can meet most of its interest obligations. Considering the liquidity of the company, the quick ratio ranged from 0.71-1.59x from the 2019-2024 fiscal year. The industry average for car manufacturers is 0.61x, while the figure for Tesla is 1.4, more than two times the industry index (Full Ratio). This emphasizes the company has robust financial health and can effectively manage its liquidity.
5.2.2. Valuation analysis
PE ratio
Finally, for the valuation analysis, this research is concerned with P/E and P/B ratios. According to the given data, the P/E ratio for Tesla was negative before 2020, that’s because the company had negative EPS, indicating they were not profitable and in capital loss. However, Tesla has robust growth in the following years and the P/E ratio skyrocketed at the end of 2020. The overall average PE ratio is 242.17. Despite the sharp decline after 2021, it remains relatively high at 57.96 till Q3 2024 (Companies Market Cap).
The industry average, on the other hand, is only 9.97. Tesla has a much greater PE ratio than the border car manufacturers reflecting the investor's strong confidence in its future development. However, Tesla also exhibits a trend toward stabilization. Consequently, the market has begun to evaluate its growth prospects more pragmatically.
PB ratio
Tesla’s PB ratio shows more volatility compared with its PE ratio. Until 2024, the PB ratio of the auto industry is 4.62. While the current P/B ratio of Tesla is 9.78. This high value suggests the investors are willing to buy at a premium for the company’s stock relative to its book value. The peak performance in 2021 might reflect the optimism of the investors but the subsequent decline signals a more prudent attitude of assessment among investors (Stern NYU).
6. Conclusion
6.1. Technical analysis
Tesla stocks have exhibited significant volatility in the last five years. The general pattern is experiencing short periods of rapid growth early on, then falling back quickly after peaking before maintaining stability at an above-average level. From 2020-2021, it experienced rapid growth. Despite a considerable decline after that, the stock price signals the possibility of recovery and stabilization. The current technical matrices (like MACD and RSI) showcase neutral market sentiments. However, there are slight bullish signals suggesting that further growth may be in store for the future.
6.2. Fundamental analysis
Tesla’s financial indices like ROE and ROA are high above the industry average, indicating that the firm has high efficiency and profitability in utilizing assets and shareholders’ equity. Besides, the high EBITDA multiple and ICR underscores the robust competitive advantage and the financial stability of Tesla. The high quick ratio also symbolizes the financial health and liquidity of the management of the firm.
Despite the considerable volatility of the P/E and P/B ratio, Tesla has both indices higher than the industry average, indicating investors have strong confidence in the future development of Tesla. Although investors have a more realistic assessment of Tesla’s future growth, the high valuation figures indicate they are still willing to pay a premium for the perspective of the company.
6.3. Investment suggestions
For the long-term investors, Tesla remains an attractive choice. Its strong financial performance and market leadership make it full of potential for growth in the following years.
For short-term investors, despite the volatility of the stock price, our technical analysis suggests a slight bullish sign. In this case, investors need to focus on the market sentiments and find an appropriate buying opportunity.
In terms of risk management. It’s worth noting that Tesla has high valuation figures and market volatility. Therefore, investors need to diversify their portfolios and avoid investing excessively in a single stock. Meanwhile, investors need to pay attention to the changes in the market and the company’s financial performance, to make timely decisions and adjustments to its investment policies.
6.4. Summary
To conclude, Tesla continues to be a leading company in its industry and a worth investing target. However, investors should be prudent and focus on market sentiments to make the right policies based on their financial goals and risk-bearing capacities.
References
[1]. International Energy Agency. (2024). Trends in electric cars – Global EV Outlook 2024 – Analysis. IEA. https://www.iea.org/reports/global-ev-outlook-2024/trends-in-electric-cars
[2]. Spilka, D. (2023, October 27). Why Tesla Remains the Star of Automotive Investing https://www.nasdaq.com/articles/why-tesla-remains-the-star-of-automotive-investing-despite-recent-volatility
[3]. Almeida L, Vieira E. Technical Analysis, Fundamental Analysis, and Ichimoku Dynamics: A Bibliometric Analysis. Risks. 2023;11(8):142.
[4]. Eugster, P., & Uhl, M. W. (2023). Technical analysis: Novel insights on contrarian trading. European Financial Management: The Journal of the European Financial Management Association, 29(4), 1160–1190. https://doi.org/10.1111/eufm.12389
[5]. Understanding the Basics of K-Line Pattern | EBC Financial Group. (2023). Ebc.com. https://www.ebc.com/forex/k-line-chart-basic-introductory-knowledge-to-explain
[6]. Wang, J., & Kim, J. (2018). Predicting Stock Price Trend Using MACD Optimized by Historical Volatility. Mathematical Problems in Engineering, 2018, 1–12. https://doi.org/10.1155/2018/9280590
[7]. Day, M.-Y., Cheng, Y., Huang, P., & Ni, Y. (2022). The profitability of trading US stocks in Quarter 4 - evidence from trading signals emitted by SOI and RSI. Applied Economics Letters, 1–6. https://doi.org/10.1080/13504851.2022.2041165
[8]. Buckley, D. (2023, October 18). ROI: ROC vs. ROA vs. ROE. Daytrading.com. https://www.daytrading.com/roc-vs-roa-vs-roe
[9]. Fletcher, E. S., Jr., & Rose, J. T. (2020). Digging deeper into UCA cash flow analysis: Sustainable versus unsustainable operating cash flows. The RMA Journal, 103(2), 42-55.
[10]. Freihat, A. R. F. (2019). Factors affecting price-to-earnings ratio (P/E): Evidence from the emerging market. Risk Governance and Control: Financial Markets & Institutions, 9(2), 47-56. DOI: 10.22495/rgcv9i2p4.
[11]. A new approach of moving average method in time series analysis | IEEE Conference Publication | IEEE Xplore. (n.d.). Ieeexplore.ieee.org. https://ieeexplore.ieee.org/document/6708545
[12]. Ho, T.-T., & Huang, Y. (2021). Stock Price Movement Prediction Using Sentiment Analysis and CandleStick Figure Representation. Sensors, 21(23), 7957. https://doi.org/10.3390/s21237957
[13]. Pines, L. (2022, March 27). When To Use And How To Read The MACD Indicator. Commodity.com; Commodity Trading.https://commodity.com/technicalanalysis/macd/#:~:text=The%20primary%20method%20of%20interpreting%20the%20MACD
[14]. Moro-Visconti R. Augmented Corporate Valuation. 1st ed. Cham: Palgrave Macmillan; 2022. 769 p. Available from: https://doi.org/10.1007/978-3-030-97117-5
[15]. He, W., & Hao, X. (2023). Competition and welfare effects of introducing new products into the new energy vehicle market: Empirical evidence from Tesla’s entry into the Chinese market. SSRN. https://papers.ssrn.com/sol3/papers.cfm?abstract_id=4232784
Cite this article
Li,H. (2025). Analysis of Tesla’s Stock Price Volatility and Driving Factors in the Context of New Energy Vehicle Industry Development from 2019 to 2024. Advances in Economics, Management and Political Sciences,153,109-121.
Data availability
The datasets used and/or analyzed during the current study will be available from the authors upon reasonable request.
Disclaimer/Publisher's Note
The statements, opinions and data contained in all publications are solely those of the individual author(s) and contributor(s) and not of EWA Publishing and/or the editor(s). EWA Publishing and/or the editor(s) disclaim responsibility for any injury to people or property resulting from any ideas, methods, instructions or products referred to in the content.
About volume
Volume title: Proceedings of the 3rd International Conference on Financial Technology and Business Analysis
© 2024 by the author(s). Licensee EWA Publishing, Oxford, UK. This article is an open access article distributed under the terms and
conditions of the Creative Commons Attribution (CC BY) license. Authors who
publish this series agree to the following terms:
1. Authors retain copyright and grant the series right of first publication with the work simultaneously licensed under a Creative Commons
Attribution License that allows others to share the work with an acknowledgment of the work's authorship and initial publication in this
series.
2. Authors are able to enter into separate, additional contractual arrangements for the non-exclusive distribution of the series's published
version of the work (e.g., post it to an institutional repository or publish it in a book), with an acknowledgment of its initial
publication in this series.
3. Authors are permitted and encouraged to post their work online (e.g., in institutional repositories or on their website) prior to and
during the submission process, as it can lead to productive exchanges, as well as earlier and greater citation of published work (See
Open access policy for details).
References
[1]. International Energy Agency. (2024). Trends in electric cars – Global EV Outlook 2024 – Analysis. IEA. https://www.iea.org/reports/global-ev-outlook-2024/trends-in-electric-cars
[2]. Spilka, D. (2023, October 27). Why Tesla Remains the Star of Automotive Investing https://www.nasdaq.com/articles/why-tesla-remains-the-star-of-automotive-investing-despite-recent-volatility
[3]. Almeida L, Vieira E. Technical Analysis, Fundamental Analysis, and Ichimoku Dynamics: A Bibliometric Analysis. Risks. 2023;11(8):142.
[4]. Eugster, P., & Uhl, M. W. (2023). Technical analysis: Novel insights on contrarian trading. European Financial Management: The Journal of the European Financial Management Association, 29(4), 1160–1190. https://doi.org/10.1111/eufm.12389
[5]. Understanding the Basics of K-Line Pattern | EBC Financial Group. (2023). Ebc.com. https://www.ebc.com/forex/k-line-chart-basic-introductory-knowledge-to-explain
[6]. Wang, J., & Kim, J. (2018). Predicting Stock Price Trend Using MACD Optimized by Historical Volatility. Mathematical Problems in Engineering, 2018, 1–12. https://doi.org/10.1155/2018/9280590
[7]. Day, M.-Y., Cheng, Y., Huang, P., & Ni, Y. (2022). The profitability of trading US stocks in Quarter 4 - evidence from trading signals emitted by SOI and RSI. Applied Economics Letters, 1–6. https://doi.org/10.1080/13504851.2022.2041165
[8]. Buckley, D. (2023, October 18). ROI: ROC vs. ROA vs. ROE. Daytrading.com. https://www.daytrading.com/roc-vs-roa-vs-roe
[9]. Fletcher, E. S., Jr., & Rose, J. T. (2020). Digging deeper into UCA cash flow analysis: Sustainable versus unsustainable operating cash flows. The RMA Journal, 103(2), 42-55.
[10]. Freihat, A. R. F. (2019). Factors affecting price-to-earnings ratio (P/E): Evidence from the emerging market. Risk Governance and Control: Financial Markets & Institutions, 9(2), 47-56. DOI: 10.22495/rgcv9i2p4.
[11]. A new approach of moving average method in time series analysis | IEEE Conference Publication | IEEE Xplore. (n.d.). Ieeexplore.ieee.org. https://ieeexplore.ieee.org/document/6708545
[12]. Ho, T.-T., & Huang, Y. (2021). Stock Price Movement Prediction Using Sentiment Analysis and CandleStick Figure Representation. Sensors, 21(23), 7957. https://doi.org/10.3390/s21237957
[13]. Pines, L. (2022, March 27). When To Use And How To Read The MACD Indicator. Commodity.com; Commodity Trading.https://commodity.com/technicalanalysis/macd/#:~:text=The%20primary%20method%20of%20interpreting%20the%20MACD
[14]. Moro-Visconti R. Augmented Corporate Valuation. 1st ed. Cham: Palgrave Macmillan; 2022. 769 p. Available from: https://doi.org/10.1007/978-3-030-97117-5
[15]. He, W., & Hao, X. (2023). Competition and welfare effects of introducing new products into the new energy vehicle market: Empirical evidence from Tesla’s entry into the Chinese market. SSRN. https://papers.ssrn.com/sol3/papers.cfm?abstract_id=4232784