


1. Introduction
The research status of the fast-moving consumer goods industry and purchasing power shows that the market is undergoing a series of changes and challenges, and the growth and consumption trends of the fast-moving consumer goods market have an impact on consumer behavior changes. The return of rational consumption also has a strong guiding change in people's purchasing power. Different from Zhang Long's thinking on marketing strategies in the fast-moving consumer goods industry, or Like Fu Yingjun and Tang Huailin, this article focuses on reflecting changes in national living standards and development trends through changes in residents' purchasing power towards fast-moving consumer goods[1][2]. Some fast-moving consumer goods are products of international companies and exported globally, and their prices are particularly sensitive to changes in exchange rates. These changes can be used to study macroeconomic trends. By analyzing the purchasing power of domestic currency and the consumption ability of the middle class in Japan and Australia through the price range of fast-moving consumer goods. This article mainly analyzes the price datasets of fast-moving consumer goods (such as cola and cigarettes) in Japan and Australia in recent years. By importing the corresponding dataset into analysis software such as SPSS. It analyzes the national consumption level and currency exchange rate trends of each country indirectly through the results[3]. Using time series analysis methods for analysis and prediction, and combining the chart results with the purchasing power of the local working class towards these fast-moving consumer goods and the relationship between the two. The research results of this article are conducive to directly reflecting the relationship between income and fast-moving consumer goods for macro wage regulation by enterprises or governments. It provides a simple explanation of how fast-moving consumer goods reflect purchasing power differences and the most direct and visible impact of currency exchange rate changes on people's lives.
2. Theoretical Background
Fast-moving consumer goods: Fast moving consumer goods refer to goods with a shorter lifespan and faster consumption speed; these types of products have lower prices and belong to mass consumer goods, such as food and beverages, personal care products, tobacco, alcohol, household items, etc. Hereinafter referred to as FMCG.
Currency exchange rate: Exchange rate mainly refers to the exchange rate ratio between one country's currency and another country's currency[4]. Exchange rate fluctuations mainly affect foreign trade imports and exports through commodity prices and channels of national income and expenditure.
Purchasing power: Purchasing power refers to the total amount of currency used to purchase goods during a certain period of time.
3. Data Source and Data Sorting
The dataset collected from the financial statistics website CEIC involves how Japanese residents use their monthly income to purchase beverages and non-alcoholic beverages, as well as how Australian residents use their income to purchase beverages, non-alcoholic beverages, and cigarettes each month[5]. As for beverages, we choose Coca Cola, which is popular worldwide, while for cigarettes, we choose Marlboro cigarettes, one of the world's best-selling cigarette brands. The reason for choosing these two brand products is that both Coca Cola and Marlboro cigarettes have a long history, relatively stable prices, strong referenceability, and extremely wide global product coverage. Importing the above dataset into SPSS for analysis yields the following icons and data.
4. Results and Result Analysis
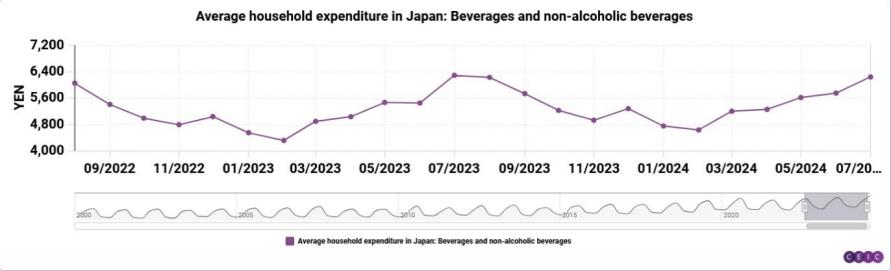
Figure 1: The income distribution of Japanese citizens towards beverages and non-alcoholic beverages; Unit: Japanese yen
Figure 1 presents the income distribution of Japanese citizens towards beverages and non-alcoholic beverages from 2022 to 2024.
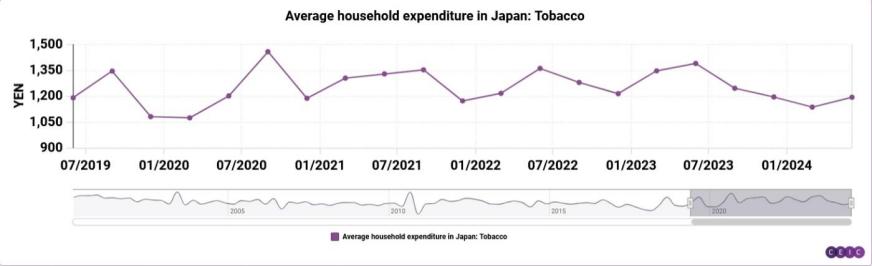
Figure 2: The income distribution of Japanese citizens towards cigarettes; Unit: Japanese yen
Figure 2 presents the income distribution of Japanese citizens towards cigarettes from 2019 to 2024[4].
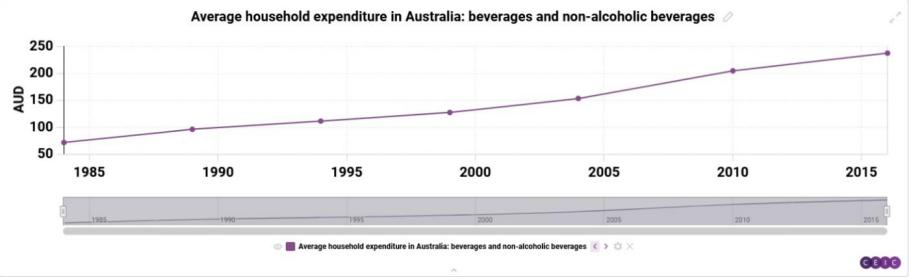
Figure 3: The income distribution of Australian citizens towards beverages and non-alcoholic beverages; Unit: AUD
Figure 3 presents the income distribution of Australian citizens towards beverages and non-alcoholic beverages from 1985 to 2015.
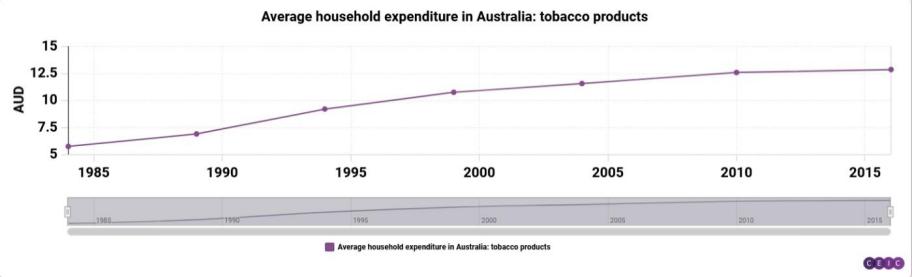
Figure 4: The income distribution of Australian citizens towards cigarettes; Unit: AUD
Figure 4 presents the income distribution of Australian citizens towards cigarettes from 1985 to 2015[5].

Figure 5: Japanese Marlboro cigarette price reference[6]
Table 1: Australian main selling cigarette prices[7]
Brand | Sales volume |
Marlboro | 35 |
Ninfield | 30 |
Peter Jackson | 25 |
Alpine | 20 |
After on-site investigation, the average selling price of Coca Cola in Japan over the past decade has been 120 yen nationwide, while in Australia it is 3.5 Australian dollars (due to differences in development levels and prices between cities in Japan and Australia, prices also vary to some extent, so taking the average here is more informative) [6]. The average price of various types of Marlboro cigarettes sold by duty-free shops and vending machines in Japan is about 4300 yen after tax exemption, while the average price in Australia is about 35 Australian dollars(as shown in Table 1 and Figure 5).
Here, we use the method of summarizing purchasing power parity to define a purchasing power value (dividing the maximum and average value of the corresponding income distribution by the corresponding commodity to obtain a ratio, which is the purchasing power of households in these two countries for the commodity, and can also be understood as the number of items that households can purchase based on their income distribution): monthly expenses divided by the unit price of the commodity[7]. According to the analysis results, it can be seen that Japanese households have shown frequent changes in their beverage expenditure in the past decade. The average income distribution of the purchasing power value of Coca Cola for Japanese households' beverage expenditure is 4090 yen, with the earliest and latest distributions being 6049 and 6235. It can be concluded that the average purchasing power value for Coca Cola is 34, and the earliest and latest purchasing power values are 50.4 and 51.9, respectively. Then, the data for Japanese cigarettes is fitted into the above calculation to obtain an average purchasing power value of 0.25, the earliest value is 0.29, and the latest value is 0.2. By substituting Coca Cola data from Australia into the calculation, the average purchasing power value is 63.8, with an earliest value of 60.1 and a latest value of 67.7[8]; The average purchasing power value of Marlboro cigarettes in Australia is calculated from the data of Marlboro cigarettes. Due to the control of the Australian cigarette market, the price of Marlboro cigarettes fluctuates greatly, and the reference value is low, so no calculation is made here, only the purchasing power value of Coca Cola is taken.
5. Discussion
Comparing the earliest and latest values can infer whether the income and purchasing power of the country's citizens have increased over the years, and thus determine whether the income level and living standards of residents and households have improved. The calculation function of the average purchasing power value is to roughly analyze whether the income of residents in a country is stable by referring to the degree of dispersion between the maximum and minimum values and the average value. The smaller the dispersion and the smaller the income fluctuation, the more stable the income.
Firstly, analyze the data from Japan. Based on the calculation results, it can be concluded that there is not much difference between the earliest and latest purchasing power values of Coca Cola in Japan, which generally indicates a slow growth in household income[9]. In addition, extreme weather and natural disasters have also become important factors that may affect personal consumption. This summer, Japan has entered a "heatwave" mode. In the past, when the weather was hot, the consumption of summer clothes, beverages and other consumer goods had an increasing trend. However, fewer individuals are ready to purchase on the streets this year due to the high temperatures and heatwave, which has negatively impacted several clothes retailers' sales. Due to customers' unwillingness to stand in queue in the intense heat, even convenience stores and ice cream shops have seen unexpected drops in sales. However, there is a large dispersion from the average value of 34, indicating that the income of Japanese households and residents fluctuates greatly and is not stable. In addition, due to the vulnerability of Japan's economic situation to external influences, fluctuations in financial markets and instability in domestic and international politics also bring uncertainty to Japan's economic activities. After the Japanese monetary policy meeting in July this year, due to domestic policy adjustments and changes in global expectations for the US economy, both the Japanese yen exchange rate and the Japanese stock market experienced severe fluctuations, which brought a strong sense of insecurity to Japanese investors. The rapid rise of the yen had a more negative impact on the Japanese economy, which is highly dependent on overseas business, in the short term[10]; The purchasing power value of Marlboro cigarettes is similar to that of Coca Cola, and the latest value has decreased compared to the earliest value. This is because the calculation years for extracting the purchasing power value of Marlboro cigarettes are relatively few and recent. But because of the warmth and high temperatures this year, fewer people are prepared to buy on the streets, which has hurt sales for a number of clothing stores. Even convenience stores and ice cream shops have unexpectedly noticed a decline in sales as a result of customers being unwilling to wait in queue in the extreme heat. The purchasing power of Coca Cola in Australia is quite different. The latest value has a certain increase compared with the earliest value, and the dispersion between the earliest value and the latest value and the average value is small, which indicates that the consumption power and purchasing power of Australian residents have small growth, and the income mode is relatively fixed and stable, it can also be inferred that prices in Australia are maintaining a moderate growth rate[11]. It is a research method worthy of reference and practice to study the exchange rate difference of currency and the consumption capacity of people in various countries through the price of FMCG. The sampling of research samples is also relatively easy. The price of FMCG not only clearly reflects the purchasing power difference of people in various countries, but also provides the most direct and credible reference for people who are going to study or business exchanges in foreign countries.
6. Conclusion
In general, the purchasing power of Australian households and residents has continued to grow without considering the impact of the rise and fall of the exchange rate of the Australian dollar on macro data in a short period of time (the exchange rate changes slightly within a month). Although Australia's economic growth is relatively weak, the amount of total income allocated to beverage expenses can still increase after a moderate increase in prices, indicating an increase in the reference purchasing power value. The power market and prices are in a state of recovery. There is still room for improvement in this study, and there are still issues that need to be addressed urgently. The research sample itself has limitations, as fast-moving consumer goods only represent low-priced universal goods. In recent years, some previously expensive goods have gradually developed into fast-moving consumer goods. For example, with the emergence of new energy vehicles, the prices of new energy vehicles are getting lower and the update frequency is faster than traditional energy vehicles. This can also be attributed to the inclusion of fast-moving consumer goods in the sample for analysis and reference. Innovative analytical methods, such as AI analysis, can be used to solve the problem of calculation and analysis difficulties after expanding the sample range and quantity. It is also possible to break away from the research scope of fast-moving consumer goods and expand the sample size, which greatly increases the referenceability and representativeness of the research.
References
[1]. Zhang Long. Reflections on Marketing Strategies in the Fast Moving Consumer Goods Industry [J]. Investment and Cooperation, 2024, (05): 178-180.
[2]. Fu Yingjun, Tang Huailin. A Comprehensive and Objective View of the Current Macroeconomic Situation [J]. Investment an54d Cooperation, 2024, (05): 178-180.
[3]. Wang Yiyun. Analysis of Factors Influencing the Competitiveness of Fast Moving Consumer Goods Brands Based on Time Series [J]. Marketing of Time honored Brands, 2023, (23): 6-10.
[4]. Guan Tao, Wei Junjie. Analysis of the Impact of RMB Exchange Rate Changes on China's Import and Export Trade [J]. New Finance, 2024, (01): 15-22+30.
[5]. ceicdata. Data surce. https://www.ceicdata.com/e.
[6]. Japan duty free. https://duty-free-japan.jp/narita/jp/.
[7]. The Cost of Living in New York, London, and Beijing [J]. Urban Development, 2019, (10): 50-51.
[8]. Bowling ,Danielle.Coles points finger at Coke in latest pricing debate[J]. Food Magazine, 2013.
[9]. Xie Chang. Study on Deviation of Purchasing Power Parity Summary Method [J]. Statistical Research, 2024, 41 (06): 18-29. DOI: 10.19343/j.cnki. 11-1302/c.2024.06.002
[10]. Chen Yitong. The Japanese economy still faces significant uncertainty [N]. Economic Daily, 2024 (004).
[11]. Zhang Wentao. Analysis of Australia's Current Economic Situation and Annual Outlook [J]. China Economic and Trade Journal, 2024, (09): 42-44.
Cite this article
Tao,J. (2025). Exploring Changes in National Income from Fast-moving Consumer Goods. Advances in Economics, Management and Political Sciences,133,183-188.
Data availability
The datasets used and/or analyzed during the current study will be available from the authors upon reasonable request.
Disclaimer/Publisher's Note
The statements, opinions and data contained in all publications are solely those of the individual author(s) and contributor(s) and not of EWA Publishing and/or the editor(s). EWA Publishing and/or the editor(s) disclaim responsibility for any injury to people or property resulting from any ideas, methods, instructions or products referred to in the content.
About volume
Volume title: Proceedings of the 4th International Conference on Business and Policy Studies
© 2024 by the author(s). Licensee EWA Publishing, Oxford, UK. This article is an open access article distributed under the terms and
conditions of the Creative Commons Attribution (CC BY) license. Authors who
publish this series agree to the following terms:
1. Authors retain copyright and grant the series right of first publication with the work simultaneously licensed under a Creative Commons
Attribution License that allows others to share the work with an acknowledgment of the work's authorship and initial publication in this
series.
2. Authors are able to enter into separate, additional contractual arrangements for the non-exclusive distribution of the series's published
version of the work (e.g., post it to an institutional repository or publish it in a book), with an acknowledgment of its initial
publication in this series.
3. Authors are permitted and encouraged to post their work online (e.g., in institutional repositories or on their website) prior to and
during the submission process, as it can lead to productive exchanges, as well as earlier and greater citation of published work (See
Open access policy for details).
References
[1]. Zhang Long. Reflections on Marketing Strategies in the Fast Moving Consumer Goods Industry [J]. Investment and Cooperation, 2024, (05): 178-180.
[2]. Fu Yingjun, Tang Huailin. A Comprehensive and Objective View of the Current Macroeconomic Situation [J]. Investment an54d Cooperation, 2024, (05): 178-180.
[3]. Wang Yiyun. Analysis of Factors Influencing the Competitiveness of Fast Moving Consumer Goods Brands Based on Time Series [J]. Marketing of Time honored Brands, 2023, (23): 6-10.
[4]. Guan Tao, Wei Junjie. Analysis of the Impact of RMB Exchange Rate Changes on China's Import and Export Trade [J]. New Finance, 2024, (01): 15-22+30.
[5]. ceicdata. Data surce. https://www.ceicdata.com/e.
[6]. Japan duty free. https://duty-free-japan.jp/narita/jp/.
[7]. The Cost of Living in New York, London, and Beijing [J]. Urban Development, 2019, (10): 50-51.
[8]. Bowling ,Danielle.Coles points finger at Coke in latest pricing debate[J]. Food Magazine, 2013.
[9]. Xie Chang. Study on Deviation of Purchasing Power Parity Summary Method [J]. Statistical Research, 2024, 41 (06): 18-29. DOI: 10.19343/j.cnki. 11-1302/c.2024.06.002
[10]. Chen Yitong. The Japanese economy still faces significant uncertainty [N]. Economic Daily, 2024 (004).
[11]. Zhang Wentao. Analysis of Australia's Current Economic Situation and Annual Outlook [J]. China Economic and Trade Journal, 2024, (09): 42-44.