


1. Introduction
Cross-border venture capital (VC) currently plays a crucial role in China's venture capital market, particularly in angel investment and early-stage investment for technology-based enterprises in the seed stage, which are more reliant on cross-border VC. Since 2003, China has become the largest net recipient of cross-border VC in the world. From 2000 to 2017, cross-border VC invested in 14,781 startups in China, among which 10,250 disclosed their investment amounts, totaling a staggering 1.51 trillion RMB[1]. This substantial funding has strongly supported the development of a large number of technology-based small and medium-sized startups. In 2012, China's Ministry of Housing and Urban-Rural Development unveiled the initial cohort of national smart city pilot projects, encompassing 90 prefecture-level and county-level cities[2]. As of December 2020, more than 900 cities had proposed "smart cities" as their development blueprint, making China the world's largest implementer of smart city construction. The objective is to evaluate the impact of smart city development on cross-border venture capital inflows by employing the quasi-natural experiment of smart city pilots and utilizing multi-period Difference-in-Differences (DID), Propensity Score Matching-DID (PSM-DID), and other methodologies. The primary contributions are: (1) it specifically analyzes the unique effects of smart city development on attracting cross-border venture capital inflows across cities of differing sizes and educational levels; (2) it enhances the literature on the socio-economic ramifications of smart city development and the determinants of cross-border venture capital attraction by being the inaugural study to investigate the influence of smart city pilot policies on such inflows; (3) it explores the spatial spillover effects of smart city development on cross-border venture capital inflows.
2. Literature Review
By encouraging technology-oriented small and medium-sized businesses’ growth and fostering an atmosphere that is receptive to innovation and entrepreneurship, smart city development helps draw in cross-border venture capital. According to recent studies on the topic, "smart cities" have the following traits in common: they use ICT to solve public problems; they work together with businesses and governments. The purpose is to improve the citizens’ quality and the effectiveness of urban governance. Websites for smart cities offer a multitude of data that benefits society and its residents and may be used by both public and private organizations to develop new services[3].
By offering improved public services and a cleaner environment, smart cities increase their appeal to talent and promote a more competitive business and innovation climate[4]. The connection is mutually beneficial. Initially, to facilitate socio-technical transitions in cities and transform them into smart cities, entrepreneurs initiate technology interventions[5]. Second, the data produced by the technologies that cities employ enables businesses to investigate new prospects. Entrepreneurs can take advantage of new business opportunities through an awareness of market trends, customer desires, and the policy environment with the help of open urban data and transparent government information[6]. In the process of business innovation, venture capital is essential since it boosts production efficiency and promotes regional economic growth. Corporate innovation is significantly facilitated by venture capital, particularly in later phases[7]. The factors affecting venture capital differ depending on a nation's level of development. Innovation is a key factor in the growth of venture capital in developing nations[8]. Experienced venture capitalists have a stronger preference for investing in riskier and more inventive businesses in booming marketplaces[9].
3. Empirical Methodology
3.1. Data
The data used in this paper comes from the Zero2IPO Private Equity Database and the Dow Jones Private Equity Database. The city-level control variable data is obtained from the CSMAR Database [10].
3.2. Model
A multi-period DID methodology is employed to assess the effect of smart city development on the influx of cross-border venture capital. In 2012, the Ministry of Housing and Urban-Rural Development initiated the first series of national smart city pilot projects, followed by the second and third series in 2013 and 2014, respectively. This study establishes a quasi-natural experiment utilizing panel data from 280 prefecture-level and higher cities spanning from 2009 to 2021. Certain prefecture-level cities designated specific districts or counties as smart city pilot programs. To ensure precise evaluation, these cities were omitted, resulting in 106 smart city pilots as the experimental group and 174 cities as the control group.
Only specific districts or counties were selected as smart city pilots by some prefecture-level cities. Following the exclusion of these cities for the sake of evaluative precision, 106 smart city pilots constituted the experimental group, and the remaining 174 cities comprised the control group.
The model is constructed because the smart city experiments were deployed yearly and gradually. Both the key explanatory variables and the control variables in this study are addressed with a one-period lag because there is a lag effect when information infrastructure is built after smart city pilots are established, and the accompanying policy effects also show time delays. The model is as follows:
\( {quantity_{it}}= {α_{0}}+{α_{1}}{DID_{i,t-1}}+\sum {b_{j}}{X_{i,t-1}}+{μ_{i}}+{λ_{t}}+{ε_{it}} \) (1)
\( {lnvalue_{it}}= {β_{0}}+{β_{1}}{DID_{i,t-1}}+\sum {b_{j}}{X_{i,t-1}}+{μ_{i}}+{λ_{t}}+{ε_{it}} \) (2)
i and t denotes the city and the year, respectively; \( {number_{it}} \) signifies the inflow quantity of cross-border VC; \( {lnvalue_{it}} \) is the inflow amount of cross-border VC; \( {DID_{i, t-1}} \) represents the smart city pilot policy variable; X represents the collection of control variables; \( {μ_{i}} \) represents the city fixed effects; \( {λ_{t}} \) represents the year fixed effects; and \( {ε_{it}} \) represents the random error term.
3.3. Explanation of Variables
Dependent Variables: The inflow amount denotes the aggregate volume of cross-border venture capital investments that entered the city. The inflow value denotes the overall real investment amount of cross-border venture capital in the city.
Independent Variables: The independent variable is the smart city pilot policy, denoted as a binary variable. The years subsequent to the policy implementation are assigned a value of 1, whilst non-pilot cities and the years preceding or coinciding with the policy implementation are assigned a value of 0.
Control Variables: This article additionally accounts for other variables influencing the influx of cross-border venture capital, specifically:
• - lnGDP, measured by the GDP of each city, expressed in logarithmic form.
• - prop. of 2nd inds., assessed by the ratio of the secondary sector in each city's GDP.
• - lnwage, measured by the employees’ average wage in each city, expressed in logarithmic form.
• - FDI/GDP, assessed by the proportion of foreign direct investment to GDP.
• - per book, measured by the per capita collection of books in city libraries.
• - lnsciexp, measured by the fiscal expenditure on science and technology by each prefecture-level city's government, expressed in logarithmic form.
• - lnphoneusers, quantified by the quantity of mobile phone users at year-end, represented in logarithmic format.
Descriptive Statistics of Variables: The panel data collected in this article from 280 prefecture level cities in China from 2009 to 2021 are descriptive statistics of the data:(Table 1)
Table 1: The descriptive statistics of the data
N | Mean | Sd | Max | Min | ||
Dependent Variables | Inflow Quantity of Cross-border VC | 3640 | 1.215 | 9.515 | 221.000 | 0.000 |
Inflow Value of Cross-border VC | 3640 | 0.346 | 1.358 | 10.519 | 0.000 | |
Independent Variables | DID | 3640 | 0.254 | 0.435 | 1.000 | 0.000 |
Control Variables | lnGDP | 3640 | 7.342 | 0.948 | 10.674 | 4.793 |
prop. of 2nd inds. | 3640 | 0.461 | 0.112 | 0.897 | 0.113 | |
lnwage | 3640 | 10.846 | 0.420 | 12.678 | 8.885 | |
FDI/GDP | 3640 | 0.026 | 0.212 | 10.552 | 0.000 | |
lnsciexp | 3640 | 10.354 | 1.476 | 16.286 | 6.624 | |
per book | 3640 | 0.685 | 1.125 | 32.068 | 0.000 | |
lnphoneusers | 3640 | 5.786 | 0.789 | 8.389 | 2.805 |
4. Empirical Results Analysis
4.1. Baseline Regression
Table 2 displays the projected results. Columns (1) through (4) examine how the development of smart cities affects the amount of cross-border venture capital that enters cities. The results of examining how the development of smart cities affects the amount of cross-border venture capital entering the city are presented in columns (1) to (4). As shown in column (4), the estimated coefficient is significantly positive at the 1% level. This indicates that the development of smart cities can significantly increase the amount of cross-border venture capital flowing into a country. Of course, this result was obtained by controlling for fixed effects of year and city, and the analysis of the impact of smart city development on cross-border venture capital inflows into cities is presented in columns (5) to (8).
Table 2: The estimated results of the baseline regression
| (1) | (2) | (3) | (4) | (5) | (6) | (7) | (8) |
quantity | quantity | quantity | quantity | lnvalue | lnvalue | lnvalue | lnvalue | |
L.DID | 3.642*** | 1.946*** | 1.046*** | 1.572*** | 0.861*** | 0.491*** | 0.164*** | 0.318*** |
(0.391) | (0.285) | (0.332) | (0.353) | (0.054) | (0.0521) | (0.0596) | (0.0623) | |
L.lnGDP | 1.705** | 1.904** | 0.601*** | 0.629*** | ||||
(0.676) | (0.748) | (0.121) | (0.132) | |||||
L.prop. of 2nd inds. | -2.468 | 0.728 | 1.343*** | -0.292 | ||||
(2.085) | (2.618) | (0.374) | (0.462) | |||||
L.lnwage | 0.495 | 0.877 | 0.0907 | 0.138 | ||||
(0.660) | (0.939) | (0.118) | (0.166) | |||||
L.fdi/GDP | 0.400 | 0.336 | 0.0735 | 0.0513 | ||||
(0.492) | (0.489) | (0.0882) | (0.0863) | |||||
L.lnsciexp | -0.0437 | -0.00481 | 0.0561* | 0.0746** | ||||
(0.167) | (0.168) | (0.0299) | (0.0296) | |||||
L.per book | 0.252** | 0.234* | 0.0528** | 0.0472** | ||||
(0.120) | (0.120) | (0.0215) | (0.0211) | |||||
L.lnphoneusers | -1.405** | -0.795 | 0.566*** | 0.383*** | ||||
(0.554) | (0.582) | (0.0994) | (0.103) | |||||
City Fixed Effects | No | Yes | Yes | Yes | No | Yes | Yes | Yes |
Year Fixed Effects | No | No | No | Yes | No | No | No | Yes |
Cons. | 0.398** | 0.808*** | -7.255 | -18.35* | 0.154*** | 0.243*** | -1.769** | -4.265** |
(0.192) | (0.111) | (4.590) | (10.59) | (0.0265) | (0.0202) | (0.823) | (1.867) | |
No. of observations | 3360 | 3360 | 3360 | 3360 | 3360 | 3360 | 3360 | 3360 |
\( {R^{2}} \) | 0.0252 | 0.7625 | 0.7653 | 0.7693 | 0.0704 | 0.6038 | 0.6217 | 0.6404 |
4.2. Parallel Trends and Dynamic Effects Testing
The event research method is used to examine the smart city pilot policy's dynamic economic consequences. In particular, the following dynamic model is created since the policy timeline is centralized (the duration of each period is deducted from the duration of the policy's implementation):
\( {quantity_{it}}= {β_{0}}+\sum _{k=-M}^{N}{β_{k}}{Policy_{i,t-k}}+\sum {γ_{j}}{X_{it}}+{μ_{i}}+{λ_{t}}+{ε_{it}} \) (3)
\( {lnvalue_{it}}= {β_{0}}+\sum _{k=-M}^{N}{β_{k}}{Policy_{i,t-k}}+\sum {γ_{j}}{X_{it}}+{μ_{i}}+{λ_{t}}+{ε_{it}} \) (4)
\( {Policy_{i,t-k}} \) is a dummy variable; it equals 1 if city i becomes a smart city pilot in period (t−k), otherwise o (M and N represent the number of periods before and after, respectively). \( {β_{0}} \) measures the policy effect in the period when it is implemented, \( {β_{-M}} \) to \( {β_{-1}} \) measure the policy effects in the M periods prior to the implementation, and \( {β_{1}} \) to \( {β_{N}} \) measure the policy effects in the N periods following the implementation of the policy.
To mitigate multicollinearity, this paper consolidates periods beyond four intervals before to policy implementation into period -4 and amalgamates periods surpassing six intervals post-implementation into period 6. Based on the number of periods before and after dummy variables are generated for each period, labeled as pre4-pre1, current, post1-post6 (corresponding to \( {Policy_{i,t-k}} \) ). Besides, the period before the policy implementation (pre1) is excluded.
First, the trends in cross-border venture capital inflows prior to and during the pilot implementation are compared using graphical analysis in this study. The parallel trend assumption is upheld since Figures 1 and 2 illustrate that, before the implementation of the pilot program, there was no significant disparity in the volume and value of cross-border VC inflows between the experimental and control groups.
The policy effect becomes apparent following the smart city pilot's deployment, and it generally exhibits an increasing tendency over time. Consequently, the program has a long-term beneficial effect on foreign venture capital inflows.
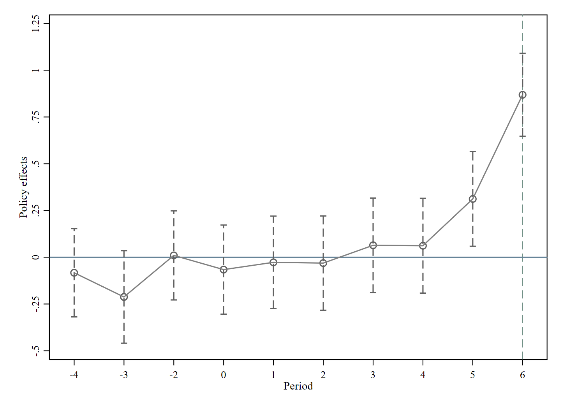
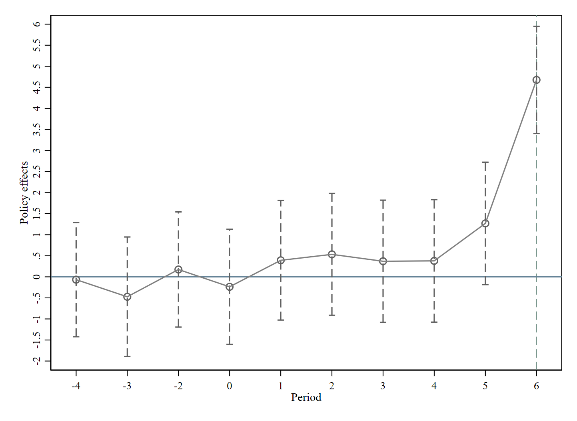
Figure 1: Trend of Inflow Quantity of Cross Figure 2: Trend of Inflow Value of Cross
border VC border VC
Second, this paper performs regressions on the cross-border VC quantities and values at each policy implementation point to further assess the dynamic policy effects. The findings indicate that the regression coefficients typically exhibit an increasing trend following the adoption of the policy, and that the policy coefficients do not become considerably positive until the fifth period following the policy's implementation. It suggests that the effects of smart city construction on cross-border venture capital inflows are gradual and show some lag.
4.3. Validation Based on the PSM-DID Method
The choice to adopt a smart city pilot program is not wholly exogenous, given that the Chinese government may employ a number of factors, including economic development and information technology, when choosing smart city pilot cities. The author uses the PSM method to match a certain control group city for every experimental group city in order to lessen the problem of selection bias. A logit model was utilized to estimate the propensity scores, with control variables selected as matching features. The matching was done using the 1:2 nearest-neighbor matching method. The majority of samples came within the common support range when the matched experimental and control groups were obtained, suggesting that the majority of samples qualified for matching. This paper also conducted a balance test. The covariates' standard deviation dramatically dropped after matching. Following confirmation of the PSM-DID method's reasonableness, additional regression analysis was carried out; the outcomes are displayed in Table 3. The results from the baseline regression are corroborated by the significantly positive regression coefficients of the smart city pilot dummy variable from column (1) to column (4), under the assumption of shared support. The development of smart cities has significantly facilitated the influx of international venture capital.
Table 3: The estimated results of PSM-DID
(1) | (2) | (3) | (4) | |
quantity | quantity | lnvalue | lnvalue | |
L.DID | 0.526*** | 0.822*** | 0.136** | 0.286*** |
(0.162) | (0.171) | (0.0595) | (0.0622) | |
Control Variables | Yes | Yes | Yes | Yes |
City Fixed Effects | Yes | Yes | Yes | Yes |
Year Fixed Effects | No | Yes | No | Yes |
Cons. | -2.800 | -10.44** | -1.692** | -4.097** |
(2.232) | (5.121) | (0.821) | (1.858) | |
No. of observations | 3329 | 3329 | 3329 | 3329 |
\( {R^{2}} \) | 0.870 | 0.873 | 0.542 | 0.564 |
4.4. Spatial Spillover Effect
This paper tests the spatial spillover effect of smart city building on cross-border VC inflow using an SDID model, developing the following model to better investigate how smart city construction affects the influx of cross-border VC in nearby cities:
\( {quantity_{it}}= {α_{0}}+{α_{1}}{DID_{it}}+{α_{2}}{W_{1}}{DID_{it}}+\sum {b_{j}}{X_{it}}+{μ_{i}}+{λ_{t}}+{ε_{it}} \) (5)
\( {lnvalue_{it}}= {β_{0}}+{β_{1}}{DID_{it}}+{β_{2}}{W_{1}}{DID_{it}}+\sum {b_{j}}{X_{it}}+{μ_{i}}+{λ_{t}}+{ε_{it}} \) (6)
\( {quantity_{it}}= {θ_{0}}+{θ_{1}}{DID_{it}}+{θ_{2}}{W_{2}}{DID_{it}}+\sum {b_{j}}{X_{it}}+{μ_{i}}+{λ_{t}}+{ε_{it}} \) (7)
\( {lnvalue_{it}}= {φ_{0}}+{φ_{1}}{DID_{it}}+{φ_{2}}{W_{2}}{DID_{it}}+\sum {b_{j}}{X_{it}}+{μ_{i}}+{λ_{t}}+{ε_{it}} \) (8)
Two kinds of spatial weight matrices are established in this research. The first, \( {W_{1}} \) , is the adjacency matrix, which illustrates the impact of smart city development on the influx of cross-border venture capital into adjacent cities. \( {W_{2}} \) , is the inverse distance matrix, reflecting how the spatial spillover effect decays with increasing distance.
Table 4 displays the outcomes of the spatial difference-in-differences model. Even considering the spatial spillover effect, the advancement of smart cities markedly enhances the influx into the local region. However, the building of smart cities has a negative geographical spillover impact, and this effect is more noticeable the closer the city is. This indicates that the advancement of smart cities adversely affects the influx of foreign venture capital. Enhanced business environments and elevated levels of intelligence and information technology attract individuals and technology from surrounding regions to urban areas, hence promoting the development of local small and medium-sized technology enterprises and drawing increased cross-border venture capital.
However, underperformance in small and medium-sized technology firms’ growth in those locations is caused by the outflow of talent and technology from nearby places, which lowers cross-border venture capital intake.
Table 4: The estimated results of spatial spillover effects
Adjacency Matrix ( \( {W_{1}} \) ) | Inverse Distance Matrix ( \( {W_{2}} \) ) | |||
(1) | (2) | (3) | (4) | |
quantity | lnvalue | quantity | lnvalue | |
Main DID | 1.027*** | 0.167*** | 1.458*** | 0.299*** |
(0.311) | (0.0553) | (0.328) | (0.0573) | |
Control Variables | Yes | Yes | Yes | Yes |
City Fixed Effects | Yes | Yes | Yes | Yes |
Year Fixed Effects | Yes | Yes | Yes | Yes |
Wx DID | -2.124*** | -0.439*** | -4.138*** | -0.848*** |
(0.578) | (0.103) | (0.995) | (0.178) | |
No. of observations | 3640 | 3640 | 3640 | 3640 |
R2 | 0.0778 | 0.2482 | 0.0986 | 0.2566 |
5. Heterogeneity
5.1. Urban Heterogeneity in Size
The degree of innovation, entrepreneurship, and financial development in a city is influenced by its size. Megalopolises are defined as cities with a permanent population exceeding 10 million, megacities as those with a population between 5 and 10 million, large cities as having a population of 1 to 5 million, and medium and small cities as those with a population below 1 million, as per the classification criteria for urban sizes set by the State Council of China. The sample is categorized into two groups: large cities and small to medium-sized cities, as well as megacities and megalopolises. The findings are presented in Table 5. In columns (3) and (4), the computed coefficients are statistically positive at the 1% level, suggesting that smart city development in megacities and megalopolises substantially enhances cross-border VC inflows, but this effect is not apparent in big, small, and medium-sized cities.
Table 5: The estimated results of urban heterogeneity in size
large cities & small and medium-sized cities | megacities& megalopolises | |||
(1) | (2) | (3) | (4) | |
quantity | lnvalue | quantity | lnvalue | |
L.DID | 0.401* | 0.0627 | 2.997*** | 0.630*** |
(0.215) | (0.0658) | (0.877) | (0.125) | |
Control Variables | Yes | Yes | Yes | Yes |
City Fixed Effects | Yes | Yes | Yes | Yes |
Year Fixed Effects | Yes | Yes | Yes | Yes |
Cons. | -7.884 | -2.560 | -13.170 | -1.118 |
(6.973) | (2.135) | (27.74) | (3.942) | |
No. of observations | 2172 | 2172 | 1188 | 1188 |
\( {R^{2}} \) | 0.548 | 0.475 | 0.795 | 0.720 |
5.2. Urban Heterogeneity in Science and Education
A concentration of diverse abilities and a wealth of technological advancements are frequently found in cities with greater levels of education and science. Cross-border venture capital (VC) finds these places more appealing because of their thriving innovation and entrepreneurial activity, large number of startup technology businesses, and variety of investment prospects for VC institutions. This study assesses a city's scientific and educational standing based on the ratio of higher education students per 10,000 population. This statistic is divided into three categories: cities with low, medium, and high levels of education and science, respectively.
Each group undergoes a separate regression analysis, and Table 6 displays the findings. At the 1% level, the estimated coefficients in columns (3) and (4) are significantly positive. It demonstrates how the development of smart cities greatly encourages a rise in cross-border venture capital inflow amounts and values in cities with high levels of education and research. Nonetheless, the expansion of smart cities has minimal impact on the influx of cross-border venture capital in urban areas characterized by low to medium levels of education and scientific advancement. It indicates that cities with more advancements in research and education are more attractive for smart city development to international venture capitalists.
Table 6: The estimated results of urban heterogeneity in science and education
Science and Education | ||||||
low | medium | high | ||||
(1) | (2) | (3) | (4) | (5) | (6) | |
quantity | lnvalue | quantity | lnvalue | quantity | lnvalue | |
L.DID | -0.0478 | -0.0308 | 0.0954 | 0.0829 | 2.941*** | 0.523*** |
(0.0577) | (0.0705) | (0.0631) | (0.0735) | (1.028) | (0.153) | |
Control Variables | Yes | Yes | Yes | Yes | Yes | Yes |
City Fixed Effects | Yes | Yes | Yes | Yes | Yes | Yes |
Year Fixed Effects | Yes | Yes | Yes | Yes | Yes | Yes |
Cons. | -0.778 | -0.586 | -4.693** | -4.959** | -64.40 | -9.162 |
(1.220) | (1.490) | (1.849) | (2.155) | (44.18) | (6.561) | |
No. of observations | 1116 | 1116 | 1128 | 1128 | 1116 | 1116 |
\( {R^{2}} \) | 0.1423 | 0.1227 | 0.2227 | 0.1869 | 0.7801 | 0.7079 |
6. Conclusion
Smart city construction significantly promotes the inflow of cross-border VC, as evidenced by a notable increase in both the quantity and value of cross-border VC inflows. Furthermore, this effect is long-term and exhibits a certain degree of lag. Upon considering spatial spillover effects, the development of smart cities continues to exert a substantial beneficial influence on the local influx of cross-border venture capital, while simultaneously demonstrating a siphoning effect on adjacent cities. Although this effect is less pronounced in large and medium-sized cities, the development of smart cities significantly enhances the influx of cross-border venture capital in megacities and megalopolises. The development of smart cities markedly enhances cross-border venture capital investments in regions with superior educational and research standards. The findings offer theoretical recommendations for cities looking to boost investment support for high-tech businesses, draw in cross-border venture capital inflows, and further advance smart city construction. This study concludes that megacities, megalopolises, and cities with elevated levels of science and education can enhance cross-border venture capital attraction by advancing smart city development. For other cities wishing to attract cross-border VC through smart city construction, caution is advised. Additionally, when striving to achieve the goal of attracting cross-border VC through smart city construction, cities should fully consider factors such as city size, the level of science and education, economic development level and make decisions carefully.
References
[1]. Han W., Huixia L., Jianwei D., 2022. Research on the Selection of State owned Joint Investment Partners by Cross border VCs from a Cultural Perspective. Management Review. 34 (07), 17-32.
[2]. The Ministry of Housing and Urban Rural Development announces the first batch of national smart city pilot list. 2013. https://www.gov.cn/gzdt/2013-01/31/content_2323562.htm
[3]. Abella A., Ortiz-de-Urbina-Criado M., De-Pablos-Heredero C., 2017. A model for the analysis of data-driven innovation and value generation in smart cities' ecosystems. Cities. 64(4), 47-53.
[4]. Appio, F.P., Lima, M., Paroutis, S., 2019. Understanding smart cities: innovation eco-systems, technological advancements, and societal challenges. Technological Forecasting & Social Changes 142, 1-19.
[5]. Kummitha, R.K.R., 2019. Smart cities and entrepreneurship: An agenda for future research. Technological Forecasting and Social Change.149(12), 119763.
[6]. Barba-Sánchez, V., Arias-Antúnez, E. & Orozco-Barbosa, L., 2019. Smart cities as a source for entrepreneurial opportunities: Evidence for Spain. Technological Forecasting & Social Change, 119713.
[7]. Faria, A.P., Barbosa, N., 2014. Does venture capital really foster innovation? Econ. Lett. 122 (2), 129–131.
[8]. Groh, A.P., Wallmeroth, J., 2016. Determinants of venture capital investments in emerging markets. Emerging Markets Review. 29(12), 104-132.
[9]. Ramana, N., Matthew, R., 2013. Investment cycles and startup innovation. Journal of Financial Economics. 110 (2), 403-418.
[10]. Data source. CSMAR. https://data.csmar.com
Cite this article
Gao,Z. (2025). Can Construction of Smart Cities Promote Cross-border Venture Capital Inflows? : Evidence from China. Advances in Economics, Management and Political Sciences,159,11-19.
Data availability
The datasets used and/or analyzed during the current study will be available from the authors upon reasonable request.
Disclaimer/Publisher's Note
The statements, opinions and data contained in all publications are solely those of the individual author(s) and contributor(s) and not of EWA Publishing and/or the editor(s). EWA Publishing and/or the editor(s) disclaim responsibility for any injury to people or property resulting from any ideas, methods, instructions or products referred to in the content.
About volume
Volume title: Proceedings of the 4th International Conference on Business and Policy Studies
© 2024 by the author(s). Licensee EWA Publishing, Oxford, UK. This article is an open access article distributed under the terms and
conditions of the Creative Commons Attribution (CC BY) license. Authors who
publish this series agree to the following terms:
1. Authors retain copyright and grant the series right of first publication with the work simultaneously licensed under a Creative Commons
Attribution License that allows others to share the work with an acknowledgment of the work's authorship and initial publication in this
series.
2. Authors are able to enter into separate, additional contractual arrangements for the non-exclusive distribution of the series's published
version of the work (e.g., post it to an institutional repository or publish it in a book), with an acknowledgment of its initial
publication in this series.
3. Authors are permitted and encouraged to post their work online (e.g., in institutional repositories or on their website) prior to and
during the submission process, as it can lead to productive exchanges, as well as earlier and greater citation of published work (See
Open access policy for details).
References
[1]. Han W., Huixia L., Jianwei D., 2022. Research on the Selection of State owned Joint Investment Partners by Cross border VCs from a Cultural Perspective. Management Review. 34 (07), 17-32.
[2]. The Ministry of Housing and Urban Rural Development announces the first batch of national smart city pilot list. 2013. https://www.gov.cn/gzdt/2013-01/31/content_2323562.htm
[3]. Abella A., Ortiz-de-Urbina-Criado M., De-Pablos-Heredero C., 2017. A model for the analysis of data-driven innovation and value generation in smart cities' ecosystems. Cities. 64(4), 47-53.
[4]. Appio, F.P., Lima, M., Paroutis, S., 2019. Understanding smart cities: innovation eco-systems, technological advancements, and societal challenges. Technological Forecasting & Social Changes 142, 1-19.
[5]. Kummitha, R.K.R., 2019. Smart cities and entrepreneurship: An agenda for future research. Technological Forecasting and Social Change.149(12), 119763.
[6]. Barba-Sánchez, V., Arias-Antúnez, E. & Orozco-Barbosa, L., 2019. Smart cities as a source for entrepreneurial opportunities: Evidence for Spain. Technological Forecasting & Social Change, 119713.
[7]. Faria, A.P., Barbosa, N., 2014. Does venture capital really foster innovation? Econ. Lett. 122 (2), 129–131.
[8]. Groh, A.P., Wallmeroth, J., 2016. Determinants of venture capital investments in emerging markets. Emerging Markets Review. 29(12), 104-132.
[9]. Ramana, N., Matthew, R., 2013. Investment cycles and startup innovation. Journal of Financial Economics. 110 (2), 403-418.
[10]. Data source. CSMAR. https://data.csmar.com