


1. Introduction
The relationship between economic growth and carbon emissions is a central topic in sustainable development research. As global climate change escalates, balancing economic growth with carbon reduction has become a critical challenge. Jiangxi Province, situated in eastern China, has witnessed swift economic expansion driven by industrialization and urbanization, thus leading to heightened energy consumption and carbon emissions. As such, reconciling economic growth with carbon mitigation presents a critical challenge for policymakers and researchers. To analyze the strength and causality of this relationship, correlation and regression analyses are utilized, offering key insights for policy development. Decoupling theory has become an indispensable framework for investigating the nexus between economic growth and environmental impact. For example, studies examining China’s 31 provinces from 2001 to 2015 show varied decoupling patterns for different pollutants, with significant regional variations [1]. Research on Beijing and Shanghai indicates that the decoupling of economic output from CO2 emissions occurs at different scales and in distinct patterns across sectors [2]. Furthermore, studies on the effects of information and communication technology (ICT) agglomeration reveal that despite hindering short-term decoupling, ICT clustering encourages long-term decoupling trends [3]. Besides, the research identifies economic output as the main driver of carbon emissions in China, with energy intensity playing a key role in transitioning to a low-carbon economy [4]. Comparative studies of decoupling trends reveal strong decoupling in developed countries, while developing nations experience weak and unstable decoupling. China’s stabilization and optimization process outpaces that of Brazil and India [5]. Research across various regions underscores the vital role of decoupling theory in informing policy development, optimizing resource distribution, and advancing green growth. Despite existing studies on Jiangxi’s economic growth and carbon emissions, many are limited to data from 1995 to 2012 [6]. The study aims to fill the gap in understanding the relationship between GDP and carbon emissions in Jiangxi Province from 2010 to 2022. A quantitative analysis is conducted using multiple regression and correlation methods to examine the dynamic interplay between these variables. Data on Jiangxi’s GDP, carbon emissions, and energy consumption are gathered to develop a regression model that assesses the influence of economic growth on carbon emissions. Correlation coefficients are also calculated to measure the strength and direction of the linear relationship between these variables, ensuring the scientific robustness and reliability of the results.
2. Methodology
2.1. Research Objectives
The study explores the dynamic relationship between GDP and carbon emissions in Jiangxi from 2010 to 2022, utilizing the decoupling theory to analyze their interconnection and offer a scientific foundation for policy-making. It investigates the nature of this relationship, the occurrence of decoupling over the study period, and the factors driving its evolution.
2.2. Sample Selection
The regional GDP and energy consumption data for Jiangxi Province (2010-2022) are from the Jiangxi Statistical Yearbook (2011-2023). To ensure consistency and comparability, all GDP values have been adjusted to 2022 base-year prices. This method effectively stabilizes the data, allowing for accurate comparisons of economic scale and growth rates across different years in terms of real value and purchasing power. The calculation of total carbon emissions utilizes the standard coal CO2 emission factor from the BP China Carbon Emissions Calculator, a globally recognized tool that considers the energy density and emission potential of various fuel types to provide relatively precise carbon emission estimates. During the data collection process, the selected data underwent rigorous validation to ensure their authority and reliability. These reliable data sources form a strong foundation for the study, allowing an in-depth analysis of the connection between economic growth and carbon emissions in Jiangxi Province.
2.3. Data Processing Methods
2.3.1. Carbon Emissions Estimation
This study utilizes data on Jiangxi’s total energy consumption, employing a method akin to Wei Yanting’s approach [7], which is based on Mo Weicheng’s calculation technique [8]. In order to estimate total CO2 emissions, the BP China Carbon Emissions Calculator’s standard coal CO2 emission factor is applied. The specific formula used is:
\( C=2.493×E \) (1)
where \( C \) represents total carbon emissions, \( E \) denotes total energy consumption, and 2.493 is the CO2 emission factor for standard coal from the BP China Carbon Emissions Calculator. And this formula enables the accurate estimation of total carbon emissions in Jiangxi Province throughout the study period, offering essential data for further analysis.
2.3.2. Decoupling Theory Model
Existing research mainly uses two main approaches for decoupling analysis: the OECD decoupling index, which compares initial and final values, and the Tapio decoupling elasticity method, which focuses on state-level analysis. In contrast to the OECD method, which may involve subjectivity in selecting a base year, the Tapio method enables year-to-year comparisons, offering a more objective assessment of the decoupling between economic growth and carbon emissions [5]. Also, the Tapio method introduces the concepts of decoupling elasticity and mediating variables, enabling dynamic analysis of the sensitivity of influencing factors. It classifies decoupling into three main indicators and eight sub-states, offering a more comprehensive and accurate evaluation of the relationship between regional economic growth and carbon emissions [9,10]. Therefore, the Tapio decoupling elasticity method offers a more precise and reliable framework for understanding the dynamics of economic growth and carbon emissions. The calculation formula for the Tapio decoupling elasticity method is as follows:
\( T= \frac{ ∆C/C}{∆E/E}×\frac{∆E/E}{∆GDP/GDP} = \frac{∆C/C}{∆GDP/GDP} \) (2)
where \( T \) represents the decoupling elasticity index, \( C \) denotes the total carbon emissions of the region, \( E \) is the total energy consumption, and GDP is the regional gross domestic product. The Tapio decoupling elasticity method analyzes changes in carbon emissions and energy consumption to assess their sensitivity. It classifies decoupling elasticity into three main indices and eight distinct decoupling states, as detailed in Table 1.
Table 1: Decoupling Elasticity Index and Decoupling State Classification
Decoupling Elasticity Index (T) | Environmental Pressure ( \( ∆C \) ) | Economic Growth ( \( ∆GDP \) ) | Decoupling Type | Decoupling State |
T>1.2 | \( ∆C \) >0 | \( ∆GDP \) >0 | Expansive Negative Decoupling | Negative Decoupling |
T<0 | \( ∆C \) >0 | \( ∆GDP \) <0 | Strong Negative Decoupling | |
0<T<0.8 | \( ∆C \) <0 | \( ∆GDP \) <0 | Weak Negative Decoupling | |
0<T<0.8 | \( ∆C \) >0 | \( ∆GDP \) >0 | Weak Decoupling | Decoupling |
T<0 | \( ∆C \) <0 | \( ∆GDP \) >0 | Strong Decoupling | |
T>1.2 | \( ∆C \) <0 | \( ∆GDP \) <0 | Recession Decoupling | |
0.8<T<1.2 | \( ∆C \) >0 | \( ∆GDP \) >0 | Growth Coupling | Coupling |
0.8<T<1.2 | \( ∆C \) <0 | \( ∆GDP \) <0 | Recession Coupling |
3. Results and Analysis
3.1. The Basic Development Trends from 2010 to 2022
From 2010 to 2022, Jiangxi Province experienced significant economic growth, with the regional GDP expanding from 938.316 billion yuan to 3,207.472 billion yuan, as shown in Table 2. This period also saw a substantial rise in total energy consumption, which increased from 6.28055 trillion standard coal units to 10.78569 trillion standard coal units. Concurrently, carbon emissions grew markedly, rising from 15.65741 trillion tons in 2010 to 26.88873 trillion tons in 2022. These trends reflect the province’s accelerated industrialization and urbanization, which, while fostering significant economic growth, have concurrently resulted in increased energy consumption and a heightened environmental impact.
Table 2: GDP, Energy Consumption, and Carbon Emissions in Jiangxi (2010-2022)
Year | Regional GDP (billion yuan) | Total Energy Consumption (trill. std. coal units) | Carbon Emissions (trill. tons) |
2010 | 9383.16 | 6280.55 | 15657.41 |
2011 | 11584.52 | 6847.1 | 17069.82 |
2012 | 12807.69 | 7148.3 | 17820.71 |
2013 | 14200.17 | 7582.9 | 18904.17 |
2014 | 15667.78 | 8055.4 | 20082.11 |
2015 | 16780.89 | 8423.4 | 20999.54 |
2016 | 18388.59 | 8730.1 | 21764.14 |
2017 | 20210.78 | 8971.9 | 22366.95 |
2018 | 22716.51 | 9285.7 | 23149.25 |
2019 | 24667.29 | 9665.15 | 24095.22 |
2020 | 25781.95 | 9808.58 | 24452.79 |
2021 | 29827.83 | 10617.78 | 26470.13 |
2022 | 32074.72 | 10785.69 | 26888.73 |
Figure 1 illustrates the annual growth trends in Jiangxi’s regional GDP, energy consumption, and carbon emissions from 2010 to 2023. The growth of regional GDP can be categorized into three phases: 2010-2018, 2019, and 2020-2022. Between 2010 and 2018, Jiangxi experienced strong GDP growth, driven by China's rapid economic expansion and supportive provincial policies. However, from 2019 onward, economic activities faced major disruptions, resulting in a marked deceleration of GDP growth, highlighting the pandemic's effect on economic performance. During the recovery period from 2020 to 2022, effective control measures, economic stimulus policies, and a gradual market recovery contributed to a resurgence in Jiangxi's GDP growth. Concurrently, energy consumption and carbon emissions continued to rise steadily, suggesting that despite economic growth fluctuations, long-term energy demand and carbon emissions remained on an upward path.
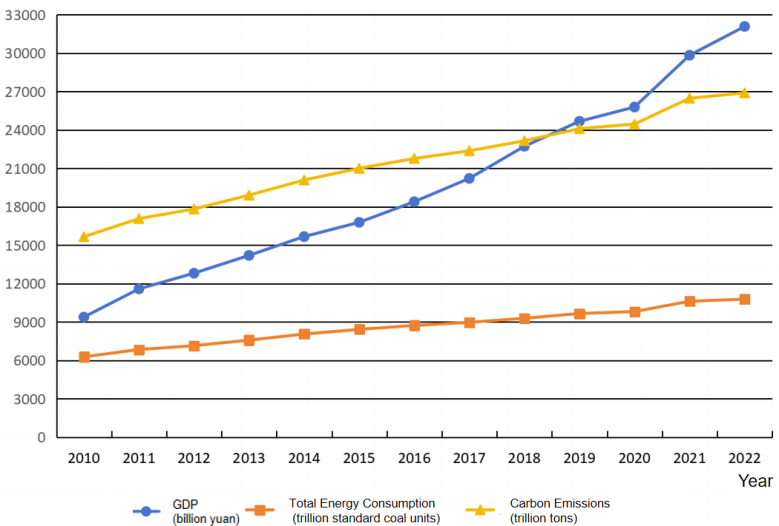
Figure 1: Trends in Regional GDP, Total Energy Consumption, and Carbon Emissions in Jiangxi (2010 -2022)
3.2. The Correlation and Regression Analysis from 2010 to 2022
The tables and figure above show that energy consumption and carbon emissions in Jiangxi have increased in parallel with economic growth. To delve deeper into the connection between economic growth and carbon emissions, the correlation coefficient between the province’s GDP and carbon emissions is computed. By examining the size of these correlation coefficients, it becomes possible to evaluate the appropriateness of using regression analysis to quantitatively explore the relationship between these variables, as demonstrated in Table 3. This method offers a clearer insight into how economic growth impacts carbon emissions and lays the groundwork for policy recommendations aimed at promoting more sustainable development.
Table 3: GDP and Carbon Emissions Correlation in Jiangxi (2010-2023)
Regional GDP (billion yuan) | Total Energy Consumption (trill. standard coal units) | |
Regional GDP (billion yuan) | 1 | |
Total Energy Consumption (trill. standard coal units) | 0.987493267 | 1 |
The correlation coefficient indicates a robust positive association between economic growth and carbon emissions in Jiangxi Province. This suggests that as the province's GDP increases, carbon emissions rise in tandem. In essence, the region's economic growth is closely linked to energy consumption, especially from sources that drive higher carbon emissions. Given that the correlation coefficient markedly exceeds 0.5, the relationship between economic growth and carbon emissions is statistically significant, providing a robust foundation for subsequent causal analysis. Regression analysis can now be used to evaluate the predictive power of Jiangxi’s GDP on carbon emissions and to quantify their relationship, as presented in Tables 4, 5, 6, and Figure 2. This analysis will offer deeper insights into how economic growth influences carbon emissions and may help inform future strategies for decoupling economic development from environmental impact.
Table 4: Regression Analysis of GDP and Carbon Emissions in Jiangxi (2010-2022)
Regression Statistics | |
Multiple R | 0.987493 |
R Square | 0.975143 |
Adjusted R Square | 0.972883 |
Standard Error | 580.3189 |
Observations | 13 |
Table 5: ANOVA of GDP and Carbon Emissions in Jiangxi (2010-2022)
df | SS | MS | F | Significance F | |
Regression Analysis | 1 | 145326505.4 | 145326505.4 | 431.5304 | 3.55613E-10(Scientific Notation) |
Residual | 11 | 3704470.14 | 336770.0128 | ||
Total | 12 | 149030975.5 |
|
|
|
Table 6: Parameter Estimation for GDP and Carbon Emissions in Jiangxi (2010-2022)
Coefficients | Standard Error | t Stat | P-value | Lower 95% | Upper 95% | |
Intercept | 11921.40631 | 489.1571438 | 24.37132211 | 6.35203E-11 | 10844.7787 | 12998.03393 |
Regional GDP (billion yuan) | 0.490935307 | 0.023632984 | 20.7733103 | 3.55613E-10 | 0.43891946 | 0.542951154 |
From the values under Coefficients, the estimated intercept a is 10,844.7787, and the regression coefficient b (GDP coefficient) is 0.490935307. Thus, the derived regression equation is:
\( ŷ = a + bx = 10844.7787+ 0.490935307x \) (3)
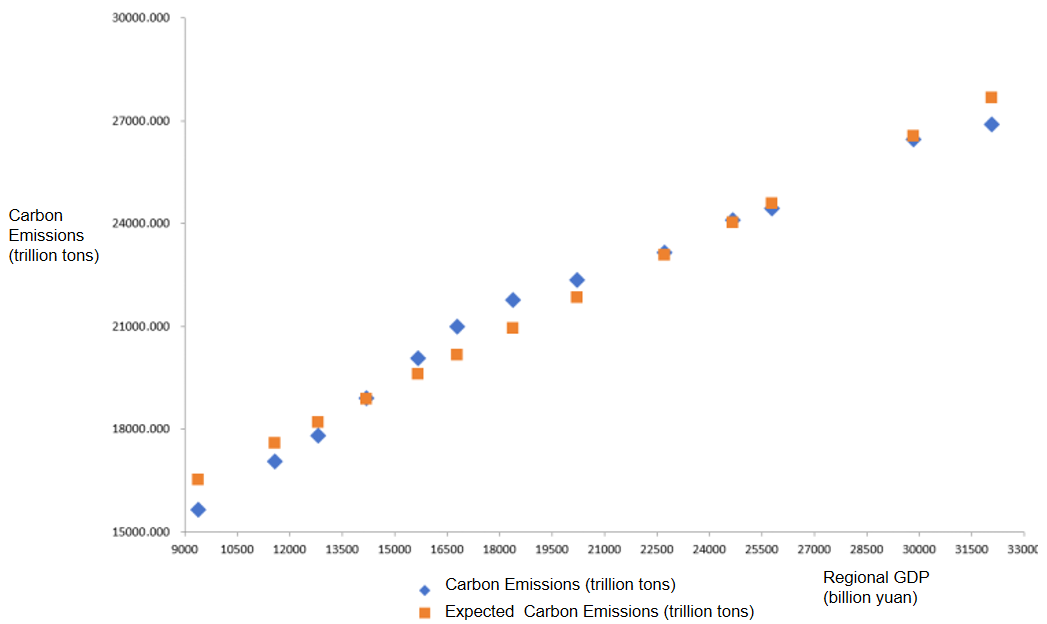
Figure 2: Linear Regression of GDP and Carbon Emissions in Jiangxi (2010-2022)
Figure 2 demonstrates a positive correlation between GDP and carbon emissions, suggesting that economic growth in Jiangxi is linked to higher carbon emissions, emphasizing the importance of balancing development with environmental sustainability. However, the Figure also shows some fluctuations in the data points, indicating that in certain years, despite GDP growth, the increase in carbon emissions was minimal or even declined. This could be due to the province’s energy-saving and emission-reduction initiatives during those years. Overall, a positive linear relationship between economic growth and carbon emissions is evident in Jiangxi from 2010 to 2022, although the tension between growth and environmental protection appears to have gradually diminished.
3.3. Decoupling Status Analysis from 2011 to 2022
Employing the Tapio decoupling model and actual GDP and carbon emissions data from Jiangxi Province for the period 2010 to 2022, the decoupling elasticity index (T) was calculated for the years 2011 to 2022. By applying the calculation method outlined in Formula (2) and the assessment criteria in Table 1, the decoupling status for each year was determined through an analysis of changes in GDP and carbon emissions, as shown in Table 7.
Table 7: Decoupling Status of Economic Growth and Carbon Emissions in Jiangxi (2011-2022)
Year | ∆GDP (Hundred Million Yuan) | ∆GDP/GDP (%) | ∆C (Trillion Tons) | ∆C/C (%) | Decoupling Elasticity Index T | Decoupling State |
2011 | 2201.36 | 19.00 | 1412.41 | 8.27 | 0.435430199 | Weak Decoupling |
2012 | 1223.17 | 9.55 | 750.89 | 4.21 | 0.44120069 | Weak Decoupling |
2013 | 1392.48 | 9.81 | 1083.46 | 5.73 | 0.584465621 | Weak Decoupling |
2014 | 1467.61 | 9.37 | 1177.94 | 5.87 | 0.626197753 | Weak Decoupling |
2015 | 1113.11 | 6.63 | 917.42 | 4.37 | 0.658623618 | Weak Decoupling |
2016 | 1607.7 | 8.74 | 764.60 | 3.51 | 0.401825946 | Weak Decoupling |
2017 | 1822.19 | 9.02 | 602.81 | 2.70 | 0.298924346 | Weak Decoupling |
2018 | 2505.73 | 11.03 | 782.30 | 3.38 | 0.306369571 | Weak Decoupling |
2019 | 1950.78 | 7.91 | 945.97 | 3.93 | 0.49643124 | Weak Decoupling |
2020 | 1114.66 | 4.32 | 357.57 | 1.46 | 0.338226168 | Weak Decoupling |
2021 | 4045.88 | 13.56 | 2017.34 | 7.62 | 0.561863491 | Weak Decoupling |
2022 | 2246.89 | 7.01 | 418.60 | 1.56 | 0.222233584 | Weak Decoupling |
Table 7 shows that between 2011 and 2022, both GDP and carbon emissions in Jiangxi Province showed an upward trajectory. However, the GDP growth rate consistently surpassed the carbon emissions growth rate, signaling a relative decoupling of economic growth from carbon emissions during this period. Specifically, the decoupling elasticity index remained below 1, indicating that the rate of increase in carbon emissions was slower than that of GDP. This suggests that, although the economy continued to grow, the pace of carbon emissions growth was effectively moderated, leading to weak decoupling. Weak decoupling signifies that Jiangxi Province managed to slow the growth of carbon emissions while continuing to experience economic expansion, thereby improving environmental efficiency. However, this decoupling does not imply a decrease in the absolute level of carbon emissions. Throughout the period, despite the weakening correlation between economic growth and carbon emissions, total emissions continued to rise, highlighting that Jiangxi has not yet achieved absolute decoupling. In other words, while the link between economic growth and carbon emissions has weakened, overall emissions have not been significantly reduced. In addition, the decoupling elasticity index for 2020 and 2022 was notably lower than in other years, indicating the need for further examination. In 2020, due to exceptional economic conditions, Jiangxi’s economy experienced a substantial decline, leading to a significant short-term reduction in carbon emissions. In contrast, in 2022, as the economy began to recover, carbon emissions increased, but at a slower rate than GDP, suggesting that Jiangxi’s green development policies and environmental initiatives effectively mitigated the environmental impact of economic recovery, which further strengthens the decoupling trend between economic growth and carbon emissions.
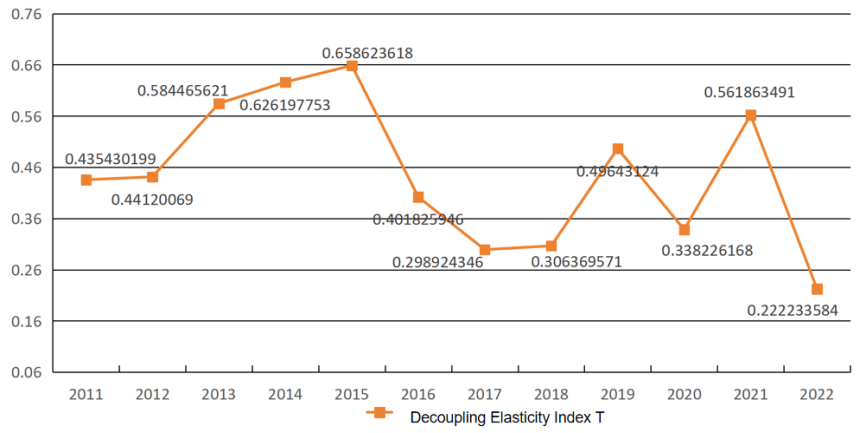
Figure 3: Decoupling Elasticity Trend between Economic Growth and CO2 Emissions in Jiangxi (2011-2022)
Figure 3 clearly depicts the changing decoupling trend between economic growth and carbon emissions in Jiangxi Province. From 2011 to 2015, the decoupling resilience index showed an upward trajectory, rising from 0.4354 to 0.6586. This indicates a gradual reduction in the reliance of economic growth on carbon emissions, with a weakening correlation between the two.However, between 2015 and 2017, the index fell from 0.6586 to 0.2989, indicating a growing reliance of economic growth on carbon emissions and a stronger connection between the two. From 2017 to 2019, the decoupling resilience index increased again, rising from 0.2989 to 0.4963, suggesting a reduced dependence of economic growth on carbon emissions. However, from 2019 to 2021, the trend reversed, with the index dropping from 0.4963 to 0.2223, reflecting a renewed increase in dependence during this period. Although the decoupling resilience index remained within the range of 0 to 0.8, indicating a weak decoupling status, it displayed fluctuations without a discernible, consistent trend. These variations reflect the intricate dynamics between economic growth and carbon emissions, influenced by factors such as shifts in industrial structure, advancements in energy efficiency, technological innovations, and the implementation of government policies. Periods of economic recovery may temporarily elevate emissions, while environmental policies or transitions in energy sources can mitigate these effects. The volatility of the index underscores the difficulty of achieving sustained decoupling, where economic growth is not accompanied by a proportional rise in carbon emissions.
4. Conclusion
This study, employing the CO2 emission coefficient for standard coal from the BP China Carbon Emissions Calculator, quantified Jiangxi’s carbon emissions and performed a correlation regression analysis to explore the relationship between economic growth and carbon emissions in the province. Additionally, the Tapio decoupling model was utilized to evaluate the decoupling relationship between economic growth and carbon emissions in Jiangxi from 2010 to 2022. The results show a strong positive correlation between economic growth and carbon emissions in Jiangxi, with the decoupling relationship remaining relatively stable and classified as weak decoupling throughout the assessment period. However, the decoupling elasticity values fluctuate, exhibiting alternating trends. Although economic growth in Jiangxi has started to outpace the growth rate of carbon emissions, suggesting a weak decoupling trend, it is crucial to note that this does not indicate a decrease in emissions. In fact, carbon emissions continue to rise. To reach the more ambitious goal of absolute decoupling, where economic growth is coupled with a reduction in carbon emissions, Jiangxi must not only maintain economic development but also implement more effective strategies for managing and reducing greenhouse gas emissions. This highlights the necessity for government development policies to align with global economic trends and the province’s unique circumstances. The government should recognize the varying stages of decoupling and implement differentiated energy-saving and emission-reduction policies, focusing on energy efficiency and clean energy technologies. Moreover, establishing a carbon trading market can motivate companies to innovate and improve emissions management by assigning value to carbon credits. Financial incentives, such as subsidies and tax breaks, can also support the development of low-carbon technologies and direct investment into green industries. However, market mechanisms may be impeded by information asymmetry and insufficient regulation, highlighting the need for a robust regulatory framework and transparent information systems to ensure the effective functioning of the market.
References
[1]. Shi, Y.B., Zhao, X.X., Jang, C.L. and Chang, C.P. (2019) Decoupling Effect between Economic Development and Environmental Pollution: A Spatial-Temporal Investigation Using 31 Provinces in China. ENERGY & ENVIRONMENT, 30(5): 755-775.
[2]. Wang, Q., Zhao, M.M. and Li., R.R. (2019) Decoupling Sectoral Economic Output from Carbon Emissions on City Level: A Comparative Study of Beijing and Shanghai, China.” Journal Of Cleaner Production 209: 126-133.
[3]. Ying, H.Q., Peng, H., Lu, Y.B. and Gupta, S. (2024) How Does Information and Communications Technology Agglomeration Affect the Decoupling of Economic Growth and Carbon Emissions? Evidence from 257 Cities in China. JOURNAL OF ENVIRONMENTAL PLANNING AND MANAGEMENT 67(13): 3139-3167.
[4]. Jiang, R., Zhou, Y.L. and Li, R.R. (2018) Moving to a Low-Carbon Economy in China: Decoupling and Decomposition Analysis of Emission and Economy from a Sector Perspective.” Sustainability 10(4): 978.
[5]. Wang, Q, and Su, M. (2020) Drivers of Decoupling Economic Growth from Carbon Emission - an Empirical Analysis of 192 Countries Using Decoupling Model and Decomposition Method. ENVIRONMENTAL IMPACT ASSESSMENT REVIEW, 81:106356.
[6]. Liu, T.F. and Guo, B.N. (2015) An Empirical Analysis of the Decoupling Relationship between Economic Growth and Energy Carbon Emissions in Jiangxi Province. Science and Technology Management Research, 35(13): 225-228+233.
[7]. Wei, Y.T, Li, S.J. and Zhang, H. (2022) Temporal and Spatial Characteristics of Carbon Emissions and Their Influencing Factors in the Chengdu-Chongqing Urban Agglomeration. China Environmental Science, 42(10): 4807-4816.
[8]. Mo, W.C. (2020) The Impact of FDI on Regional Carbon Dioxide Emissions: An Analysis Based on the Spatial Panel Data Model of Guangdong Province . Industry and Technology Forum, 19(15): 69-71.
[9]. Xiong, X., Liu, X.L. and Zhou, P. (2015) A Comparative Study on the Dynamics of the Decoupling Relationship between Economic Growth and Carbon Emissions in Hunan Province - Based on the Situation in Hunan Province since the 11th Five-Year Plan.China Energy, 7(1):6.
[10]. Dong, B., Zhang, M., Mu, H.L. and Su, X.M. (2016) Study on Decoupling Analysis between Energy Consumption and Economic Growth in Liaoning Province. ENERGY POLICY, 97: 414-420.
Cite this article
Xu,Y. (2025). A Study on the Link Between Economic Growth and Carbon Emissions in Jiangxi Province: An Empirical Approach Using Decoupling Theory. Advances in Economics, Management and Political Sciences,159,20-28.
Data availability
The datasets used and/or analyzed during the current study will be available from the authors upon reasonable request.
Disclaimer/Publisher's Note
The statements, opinions and data contained in all publications are solely those of the individual author(s) and contributor(s) and not of EWA Publishing and/or the editor(s). EWA Publishing and/or the editor(s) disclaim responsibility for any injury to people or property resulting from any ideas, methods, instructions or products referred to in the content.
About volume
Volume title: Proceedings of the 4th International Conference on Business and Policy Studies
© 2024 by the author(s). Licensee EWA Publishing, Oxford, UK. This article is an open access article distributed under the terms and
conditions of the Creative Commons Attribution (CC BY) license. Authors who
publish this series agree to the following terms:
1. Authors retain copyright and grant the series right of first publication with the work simultaneously licensed under a Creative Commons
Attribution License that allows others to share the work with an acknowledgment of the work's authorship and initial publication in this
series.
2. Authors are able to enter into separate, additional contractual arrangements for the non-exclusive distribution of the series's published
version of the work (e.g., post it to an institutional repository or publish it in a book), with an acknowledgment of its initial
publication in this series.
3. Authors are permitted and encouraged to post their work online (e.g., in institutional repositories or on their website) prior to and
during the submission process, as it can lead to productive exchanges, as well as earlier and greater citation of published work (See
Open access policy for details).
References
[1]. Shi, Y.B., Zhao, X.X., Jang, C.L. and Chang, C.P. (2019) Decoupling Effect between Economic Development and Environmental Pollution: A Spatial-Temporal Investigation Using 31 Provinces in China. ENERGY & ENVIRONMENT, 30(5): 755-775.
[2]. Wang, Q., Zhao, M.M. and Li., R.R. (2019) Decoupling Sectoral Economic Output from Carbon Emissions on City Level: A Comparative Study of Beijing and Shanghai, China.” Journal Of Cleaner Production 209: 126-133.
[3]. Ying, H.Q., Peng, H., Lu, Y.B. and Gupta, S. (2024) How Does Information and Communications Technology Agglomeration Affect the Decoupling of Economic Growth and Carbon Emissions? Evidence from 257 Cities in China. JOURNAL OF ENVIRONMENTAL PLANNING AND MANAGEMENT 67(13): 3139-3167.
[4]. Jiang, R., Zhou, Y.L. and Li, R.R. (2018) Moving to a Low-Carbon Economy in China: Decoupling and Decomposition Analysis of Emission and Economy from a Sector Perspective.” Sustainability 10(4): 978.
[5]. Wang, Q, and Su, M. (2020) Drivers of Decoupling Economic Growth from Carbon Emission - an Empirical Analysis of 192 Countries Using Decoupling Model and Decomposition Method. ENVIRONMENTAL IMPACT ASSESSMENT REVIEW, 81:106356.
[6]. Liu, T.F. and Guo, B.N. (2015) An Empirical Analysis of the Decoupling Relationship between Economic Growth and Energy Carbon Emissions in Jiangxi Province. Science and Technology Management Research, 35(13): 225-228+233.
[7]. Wei, Y.T, Li, S.J. and Zhang, H. (2022) Temporal and Spatial Characteristics of Carbon Emissions and Their Influencing Factors in the Chengdu-Chongqing Urban Agglomeration. China Environmental Science, 42(10): 4807-4816.
[8]. Mo, W.C. (2020) The Impact of FDI on Regional Carbon Dioxide Emissions: An Analysis Based on the Spatial Panel Data Model of Guangdong Province . Industry and Technology Forum, 19(15): 69-71.
[9]. Xiong, X., Liu, X.L. and Zhou, P. (2015) A Comparative Study on the Dynamics of the Decoupling Relationship between Economic Growth and Carbon Emissions in Hunan Province - Based on the Situation in Hunan Province since the 11th Five-Year Plan.China Energy, 7(1):6.
[10]. Dong, B., Zhang, M., Mu, H.L. and Su, X.M. (2016) Study on Decoupling Analysis between Energy Consumption and Economic Growth in Liaoning Province. ENERGY POLICY, 97: 414-420.